
MARKET MESSAGES
4/05/13 . . .
The warning blog issued on 4/3/13 has worked well.
Following are some charts to help lead the way.
Here is an interesting chart that put some possible temporary limits on the upside. The market formed a congestion area around the 161% level. We had an earlier inverse head and shoulders that predicted 1600 on the SPX. But the nature of this type of head and shoulders isn’t reliable for measuring. It wasn’t a reversal pattern, it was a continuation pattern.
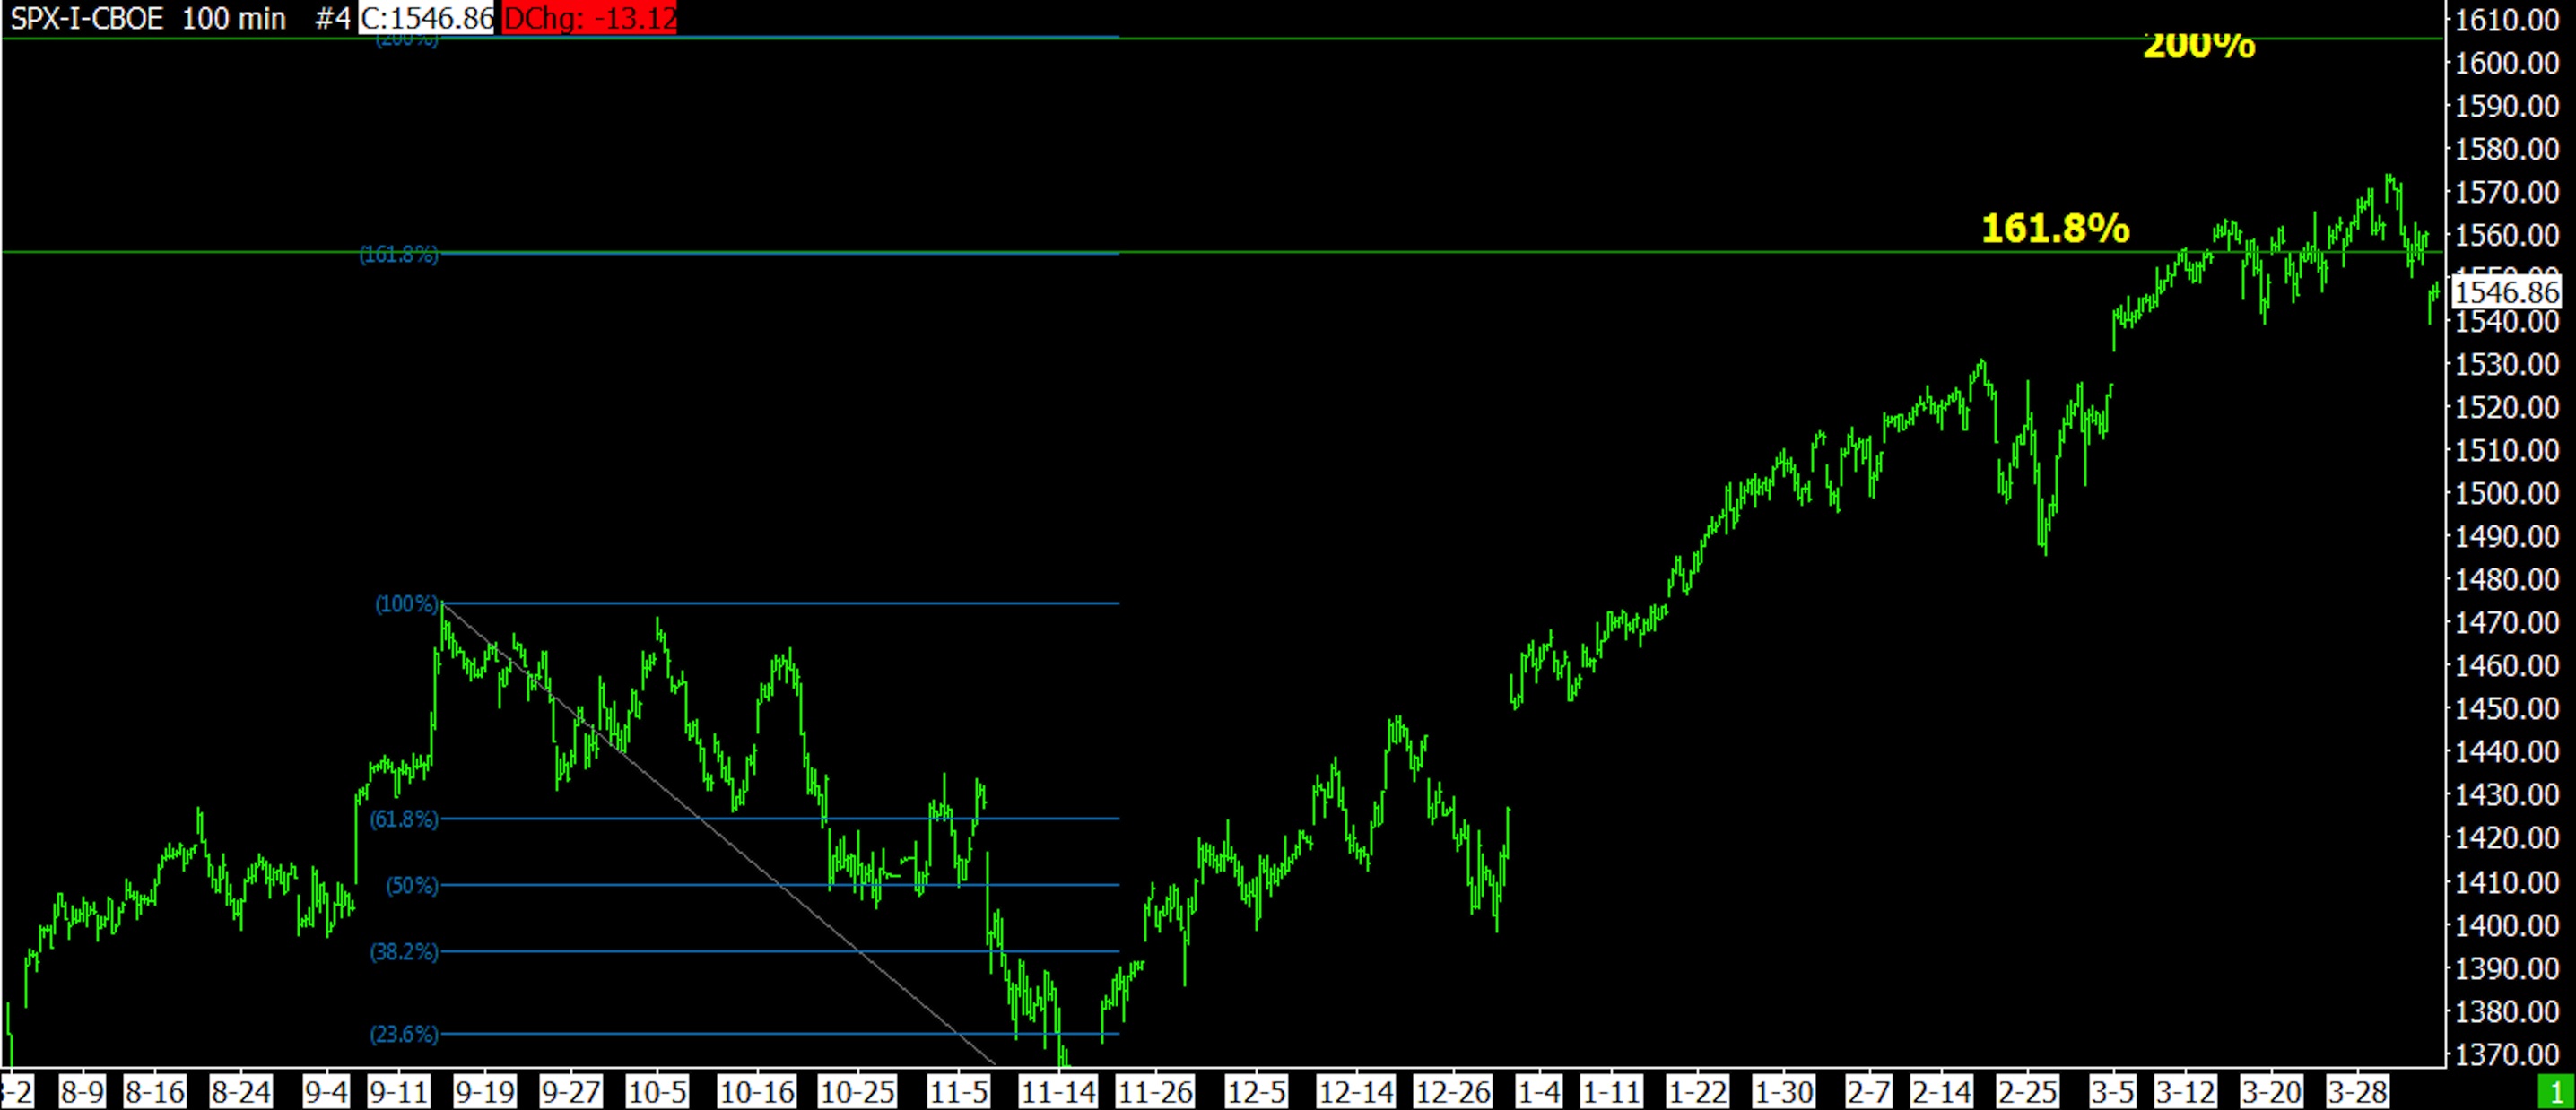
04-05-13 SPX 100 MINUTE BARS
The correct wave count
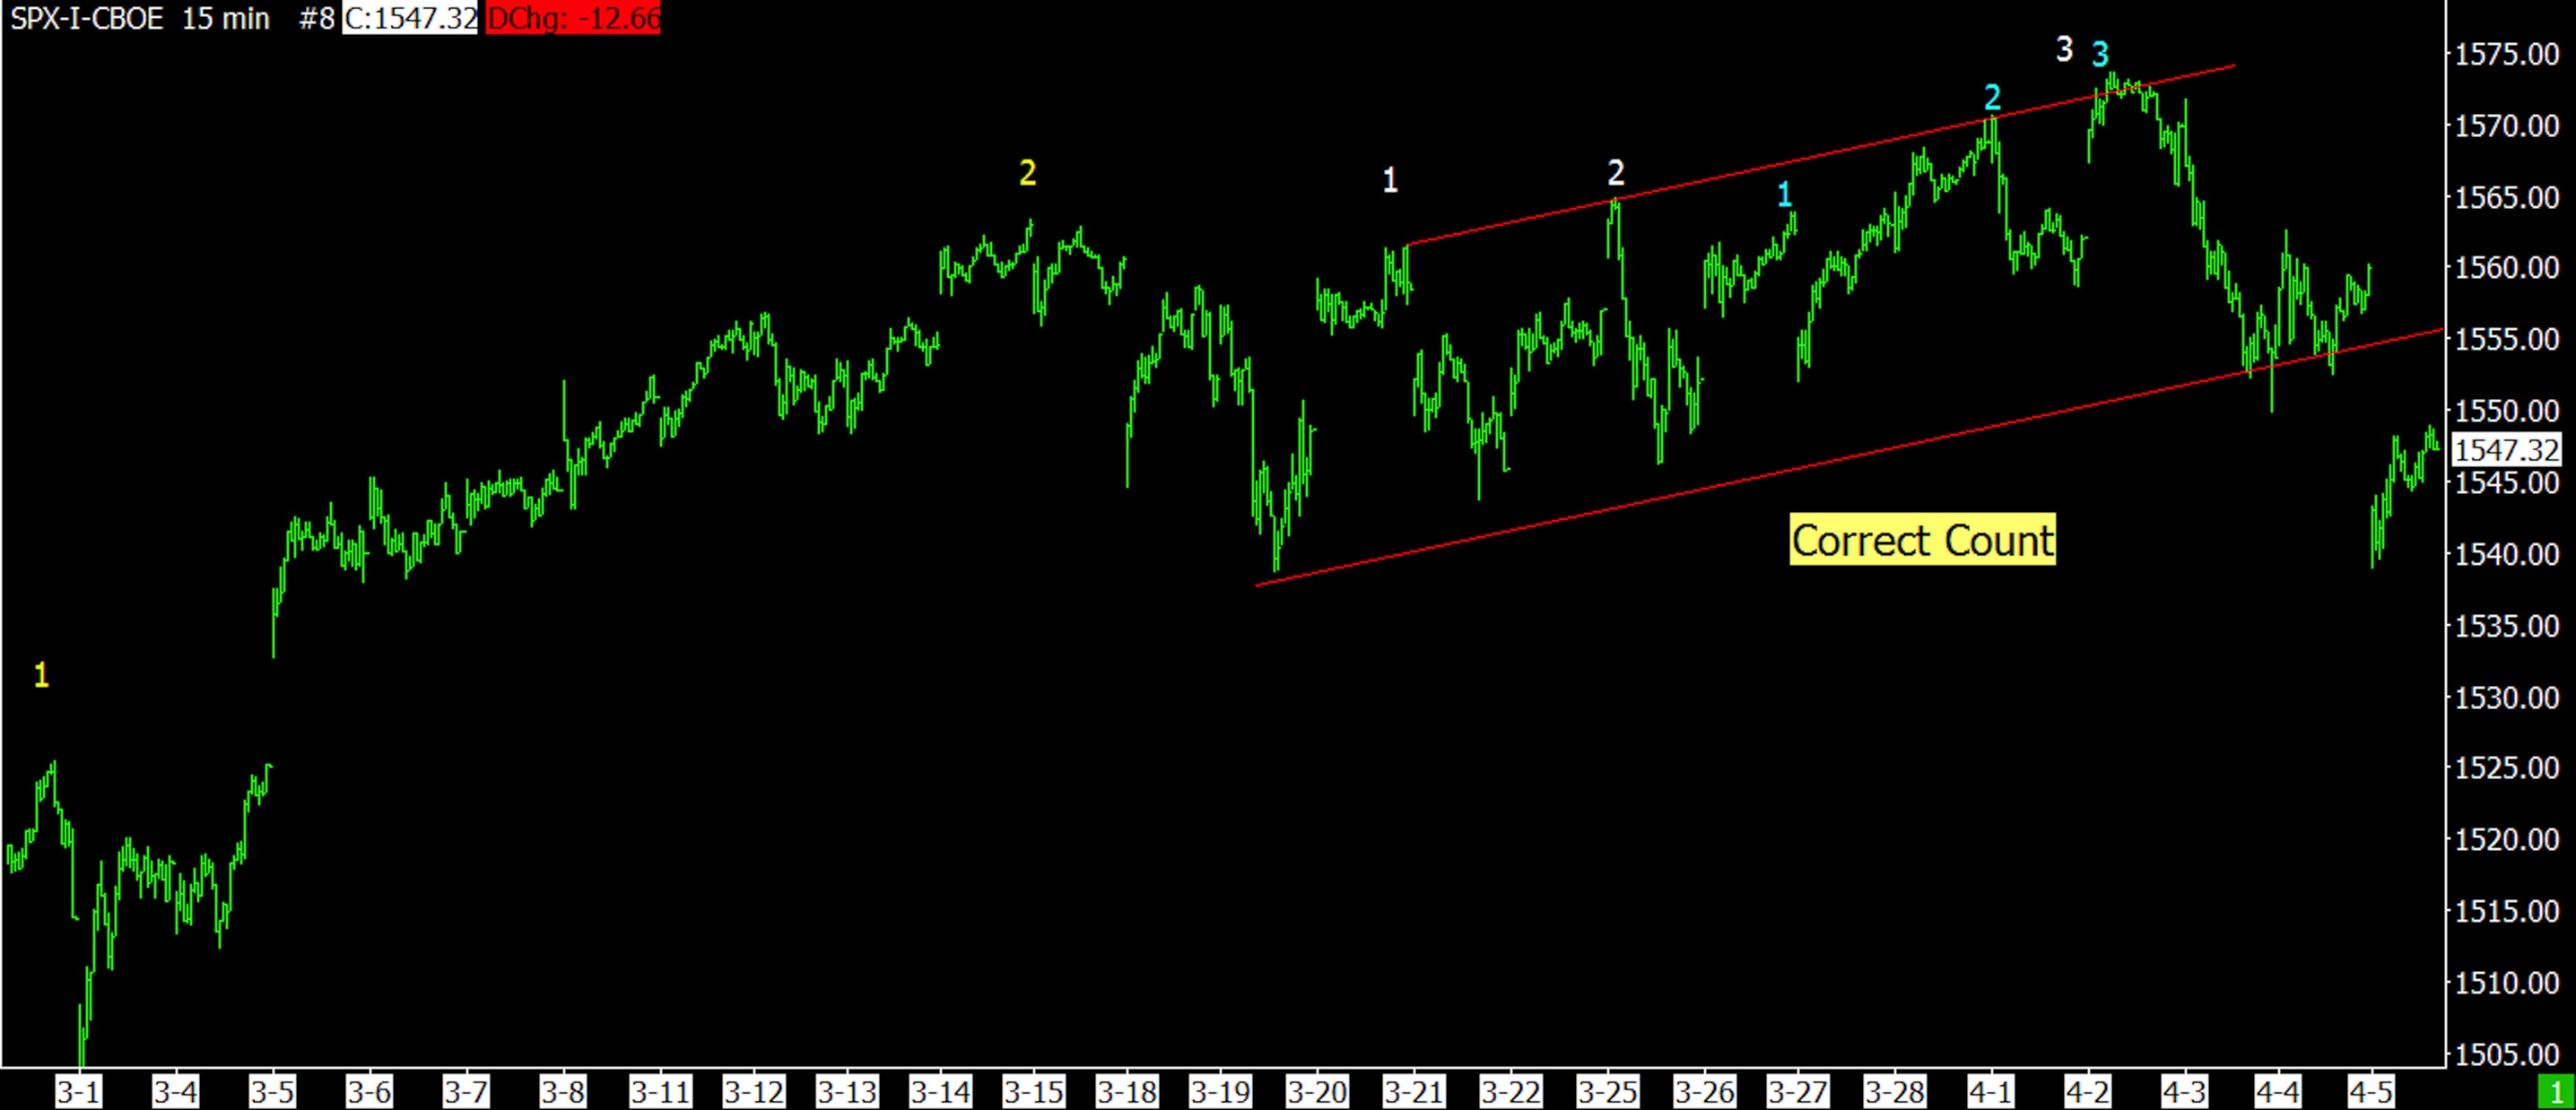
04-05-13 SPX 15 MINUTE
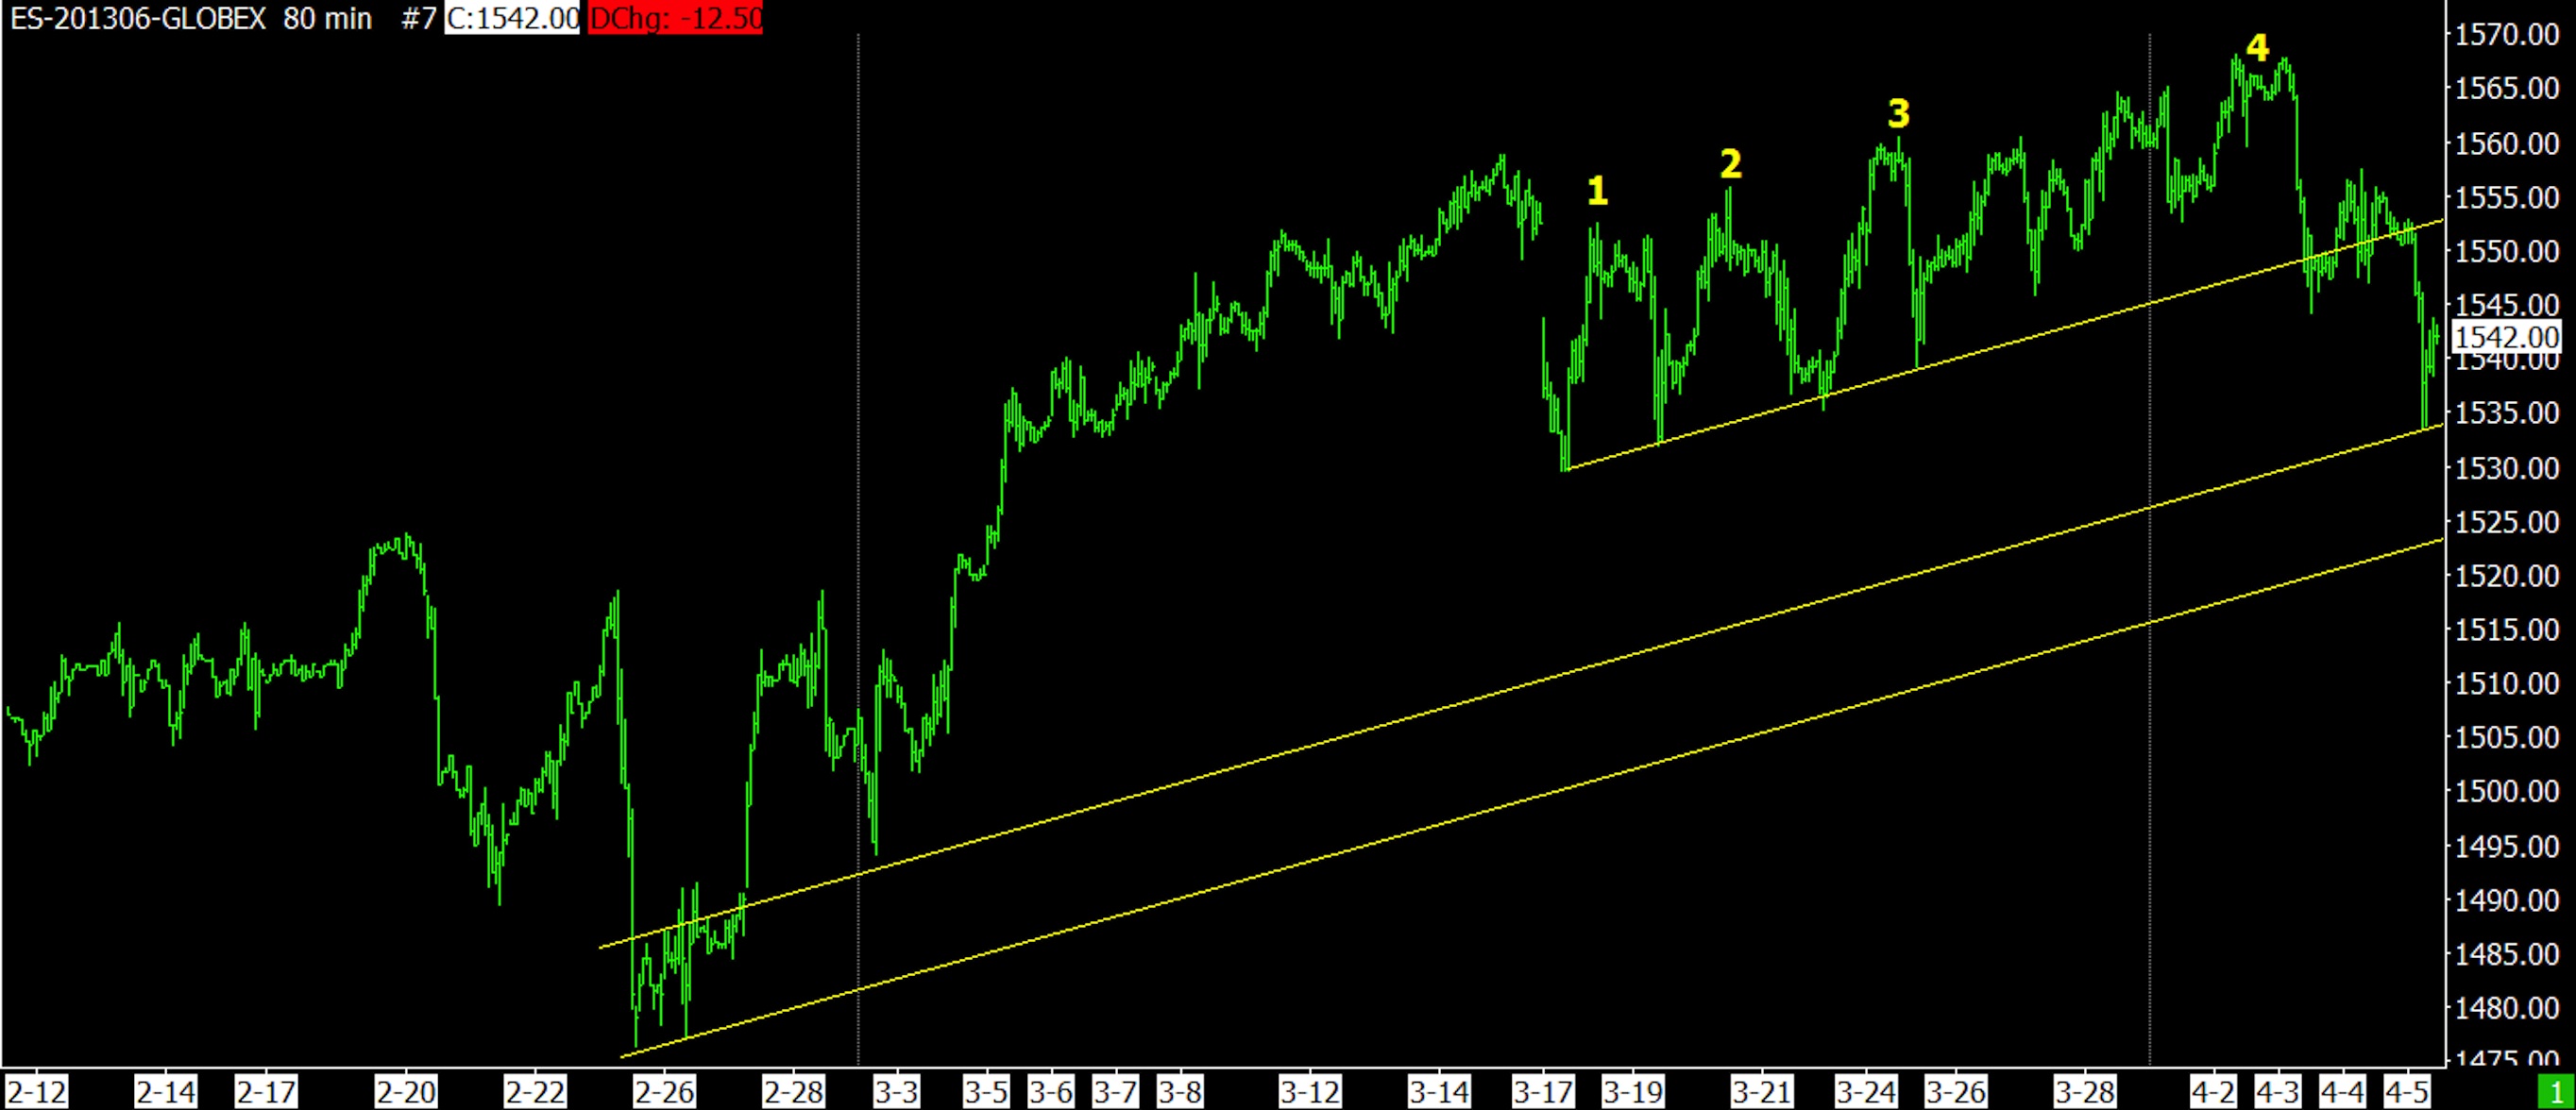
The next was the alternate count, which is now discounted. This time the SPX chart provided the best count and not the ES. That’s not usually the case.
-

04-05-13 ES 80 MINUTE
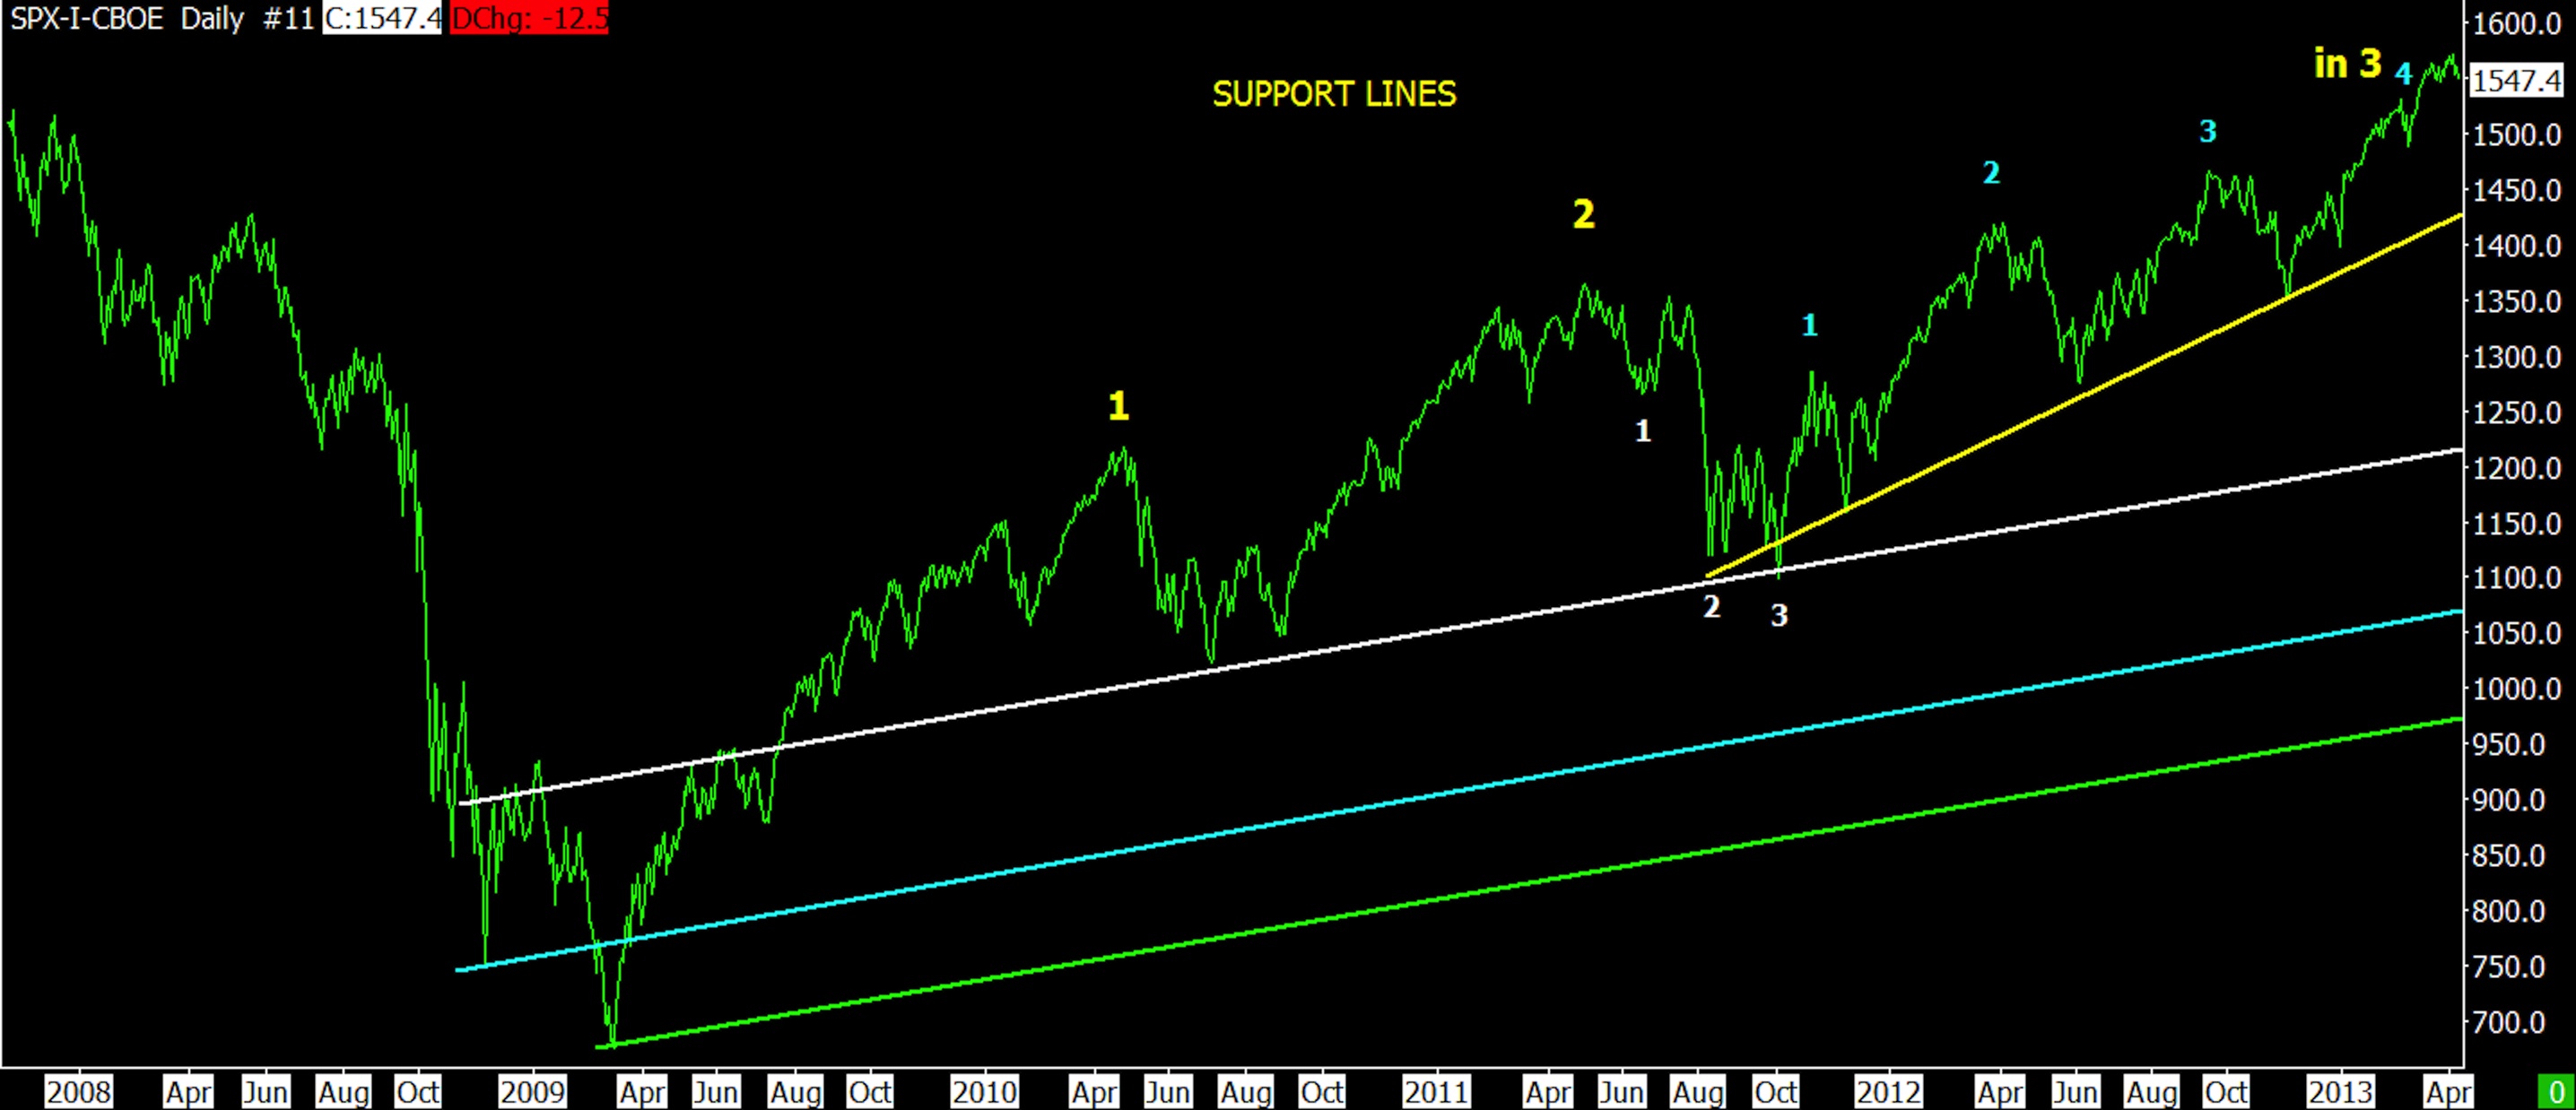
Which count is correct, the next chart or the following one???

04-05-13 SPX DAILY 1

04-05-13 SPX DAILY 2
This a real head scratcher. If the second chart is correct, we will have another attempt at new highs. But if the first one is correct, we are going to have a correction of significance here. If we have another attempt at a new high, I would expect to see poor high low figures and lower advance decline figures. Much like what happened in Oct 2007.
The market doesn’t normally make U-turns. It forms these broad saw tooth formations and that is definitely missing here. That is encouraging.
The big question is whether we “may” be finishing the bull market since March 2009. I have been intrigued for some time that we could have the biggest correction since March 2009 and keep the bull intact. This type of correction “could” go close to or below the Oct 2011 lows. After that if would rise in yellow step 4 and 5 (as portrayed above). This is a highly bullish picture that “may” see the Dow at 20,000 or higher (several years from now though). This “could” still be part of the rising line on the megaphone formation. Probably the answer to this is whether the FED is all out of bullets. That is always a possibility because the FED has never been backed against the wall like this in its lifetime. 2008 created problems that the FED and the economy are still struggling to overcome.
If the FED was out of ammunition, could the market make a U-turn??? The situation is brand new and there is no precedent so I don’t know. You just kinda have to guess at the outcome and read the market.
The flip side and most bearish picture is the bull is dead and large step 3 down will begin. That is very ominous and will end below the March 2009 lows. Possibly much lower.
I have not published any updates from Jeff Saut for awhile because we have begun to deviate on opinion. He has become very bullish and this was OK for awhile, but now I am growing more cautious and can’t agree with his viewpoint. The wave count has always been the limiting factor for me and it has looked like it “could” be in some type of ending phase since Nov 2012 (3rd step). I elected to not confuse the situation by publishing Jeff Saut’s material.
When reading my remarks, remember that I was a regular Chicken Little from late 1998 until 2000. I was really bad, the sky is going to fall, the sky is going to fall. Nobody listened and I mean nobody. I can be early on big turns and who knows if I’m too early again but I am taking steps to protect against that.
I have not issued a sell signal for the bull market that began in March 2009 and do not intend to do so until a significant correction unfolds. I will issue warnings and that’s all. I am trying to avoid another repeat of 1998 to 2000.
—————————————————————
Is anybody listening???

- Click on any picture or chart to enlarge it
All Rights Reserved © ™
