11/25/13 . . . by Bob Karrow
- Read about my unorthodox wave counting at the beginning of the Glossary. The glossary also contains ideas and details that will never appear in the blog.
- Don’t confuse my count method with Elliott Wave cuz it ain’t, but it does drive the Elliott people crazy.
Wave Counting & Concept Glossary
- My Charts have wave counts on indexes that begin with the bear market bottom of 1974 (monthly charts). You can also find weekly and daily wave counts showing increasingly more detail. All of these charts can be found on page 1.
- Indexes with smaller time scales is page 2. Page 3 begins with a lot of indicators that show the health of the market. See them at . . .
“My Charts” from StockCharts.com
- My tweets can be frequent and my blogs can be infrequent. Tweets will often contain links to charts. Stay up to date on my ramblings.
—————————————————
SENTIMENT
Two comments about stock market sentiment.
- Measuring sentiment can be difficult as the public’s market attitudes shift quickly.
- Sentiment is not an absolute measurement, meaning it can always rise higher or fall lower before a correction takes place.
Does the public “act” on quickly shifting beliefs in the market? For the vast majority, I doubt it. I have noted that a constantly shifting attitude in the market usually belongs to an active market trader, or a member of the public that isn’t invested in the market.
The public’s normal characteristic when invested is to be myopic to most everything except reasons why their stock is going to go up. Have you ever tried to convince someone that their XYZ stock is a dog or their market timing is not good and they should sell out. It’s never a fruitful conversation, is it???
“Nobody is more bearish than a sold-out bull.”
“The hardest part of a bull market is staying on.”
“A bubble is a bull market in which you don’t have a position.”
A good example of quickly shifting attitudes is the “American Association of Individual Investors” or AAII poll of sentiment. Here is a recent chart of the AAII bulls and bears. In these two charts, notice the level of bulls and bears since January 2013.
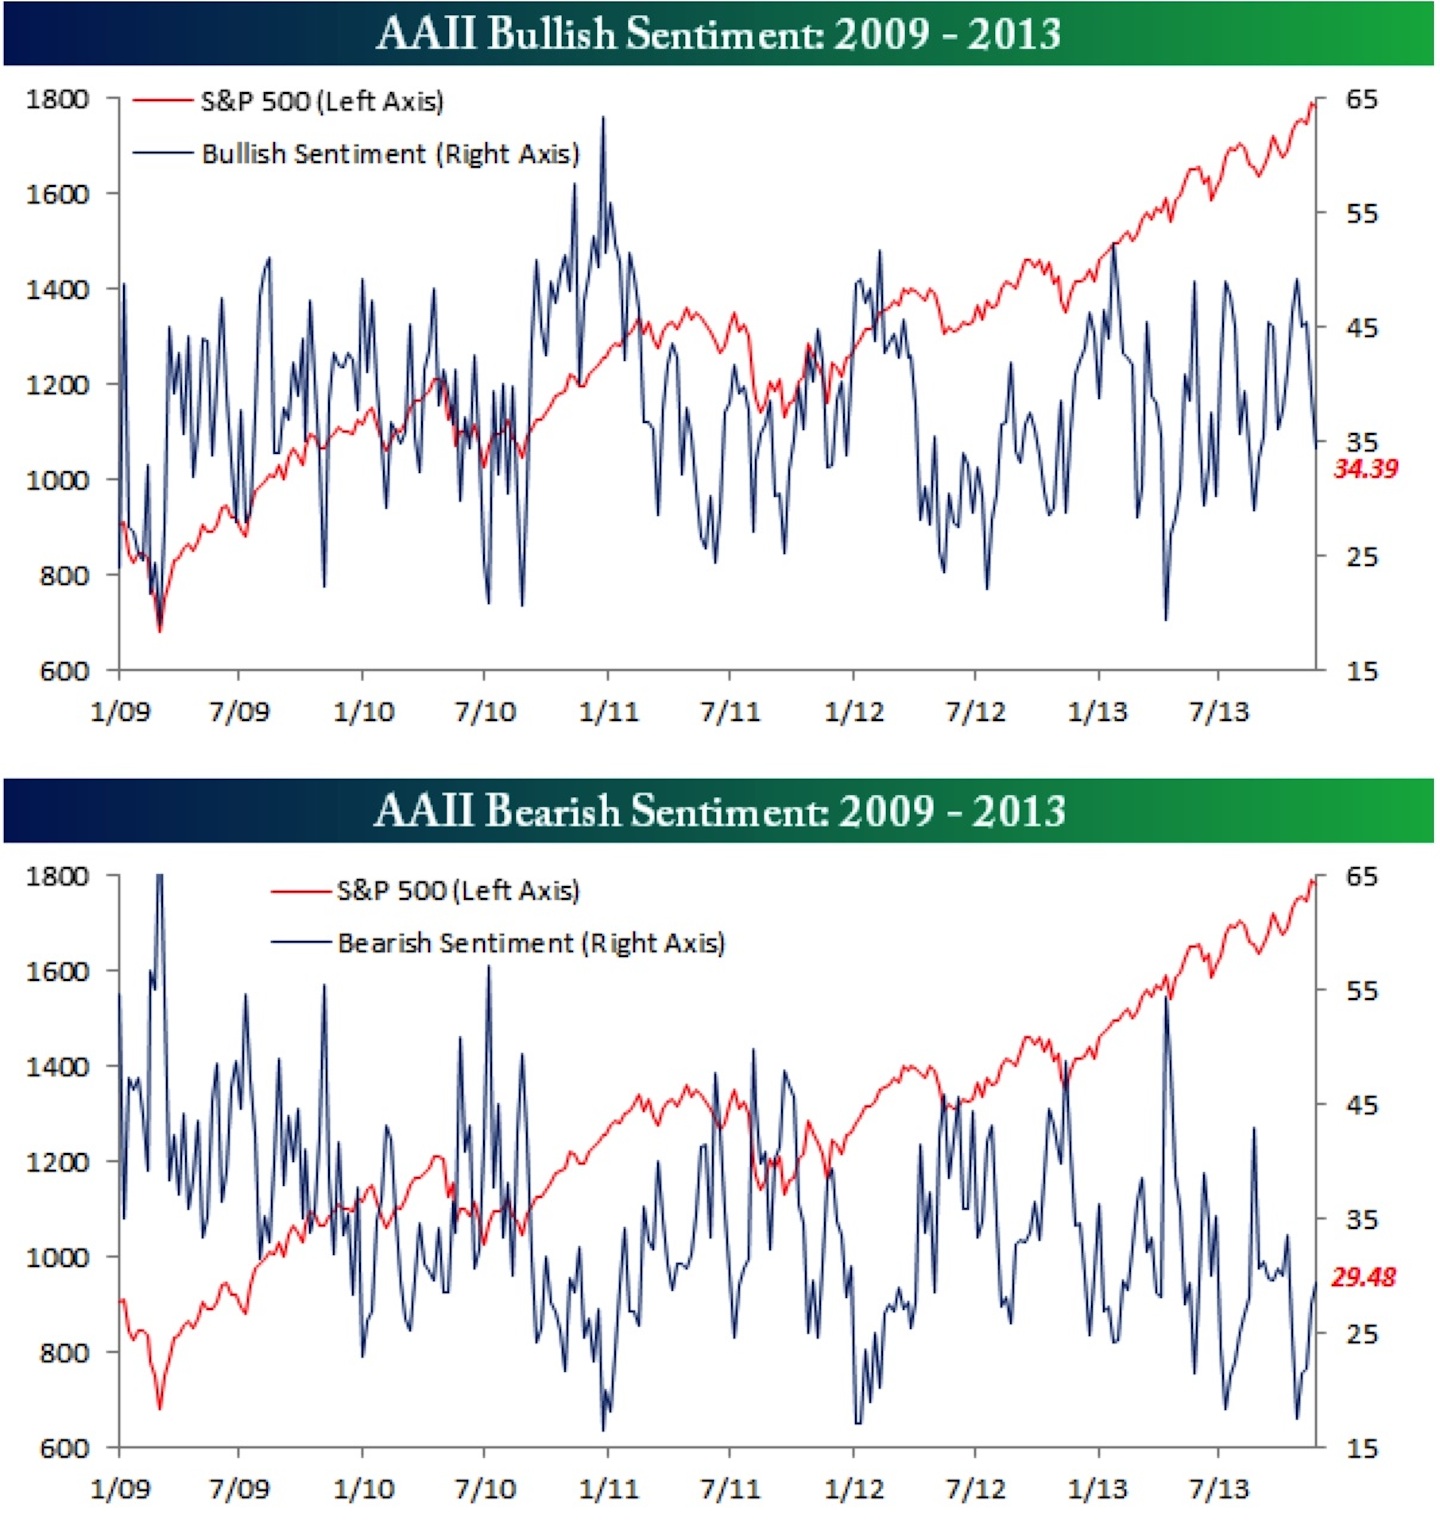
AAII BULL BEAR
Do you think the AAII poll participants are buying and selling as pictured in this chart???
It’s certainly possible that the AAII members are trading as shown by this poll. The problem is they wouldn’t be making much money and they would soon learn their trading isn’t working and eventually take up buy and hold investing. At least buy and hold for a reasonable period of time, months not days.
The point is that this chart is probably only showing people’s attitudes and NOT what they are actually doing. What investor’s are actually doing is far more important than today or tomorrow’s attitude. Only surveys inside a brokerage firm can yield those statistics and they usually don’t want to share that info.
Price is probably the only good indicator showing what investors are actually doing. Prices don’t tell us if the majority of those trading are the public or institutions.
Looking back at the AAII chart, I see easily spooked “investors” (using that term loosely) that buy and sell the market at the least little jiggle or anticipated jiggle. At times, the AAII chart can be trendlessly unrelated to reality. Only some of the extremes are of value. That’s unfortunate because extremes are always supposed to yield good inflection points.
I’ll sum up and say that the AAII sentiment poll has some use and it’s occasionally OK for yielding true market extremes.
A market that continues rising in a bull market (or falling in a bear market) and generates continuous rising (or falling) optimism is useful. In a continuous trend, it becomes a natural progression that the the optimism (or pessimism) rises (or falls) to a historical point that precipitates a significant correction in the market.
The Investors Intelligence survey of market letter writers (the professionals????) falls into this category. The chart of professional opinion shows that they are not more proficient at calling market tops or bottoms than the public and the public is very bad on peaks or bottoms. The public invariably act on emotional buying or selling when the market is surging toward the peak or bottom.
In a recent survey of the Investors Intelligence letter writer’s survey, one more point in optimism and it will be at the highest level since the 1987 crash. Not many people were short in 1987 (I was out but not short). It was an eye-opening event to say the least. I watched interviews of floor traders that were literally wiped out in one day. Stunned people walked the floor looking like zombies, nothing seemed to be registering anymore. I suppose when you’ve lost everything in hours, that would be a normal look of stunned disbelief.
1987 was not a full fledged bear market. It was a very sharp correction that mostly took place over one week. In historical context, it was a short term blip in the upward trend that occurred during the 1990s.
Following are reprints from the 1987 crash. I also kept the paper versions of the WSJ and Barrons for historical purposes.
Wall St Journal 11-20-87, Black Monday
On The Spot: Stock Market Frenzy Puts Greenspan in a Crucial Position
Chicago’s Shadow Markets Led Free Fall
A Repeat of 1929? Depression in ’87 Is Not Expected
Market Debacle Rouses Worst Fears of Little Investors
Short Sellers, Data Processing Firms Won Big as Others Wailed Monday
Crash of ’87 Recollections: ‘My Singularly Worst-Day Ever
Blah, blah, about the 1987 market crash. I’m not predicting anything like that. It’s only an object lesson in extremes in market optimism.
Here is a recent chart of an Investors Intelligence survey.
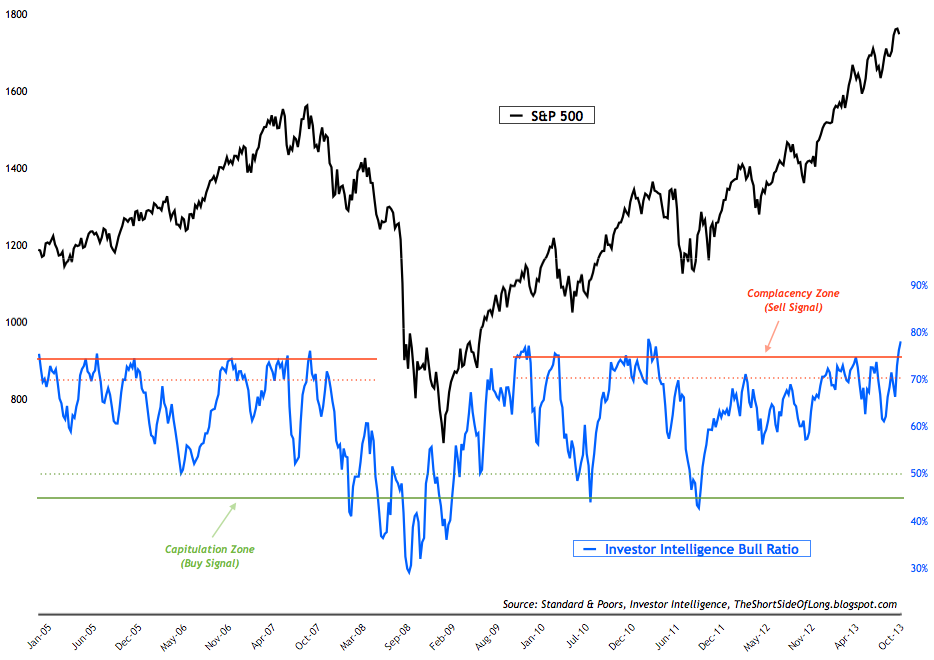
Investor Intelligence Bull Ratio
What happens after our next significant correction will tell us a lot about whether we are in a long term bull market.
What was I complaining about in 1987?
I wasn’t complaining about much other than the market was really going up too fast. In retrospect, it was too far, too fast and after October 1987, the market spent some time slowly rising back to its pre-crash levels. Later in the 1990s the market went parabolic again.
What was I complaining about in 1999?
In 1999 I was complaining about the crazy valuation of the stock market and the public’s heavy participation in the market. I was on my soapbox beginning with the 1998 Asia money crisis. That bubble was an easy call, just like the home price bubble in 2007.
What was I complaining about in 2007?
I had been complaining about over priced real estate. We were obviously in a real estate bubble and it had been in force for many years and was glaringly obvious in California. Presently in the USA, real estate has been recovering, but I can’t really say that its over-valued because it’s not obvious.
What am I complaining about today?
I’m complaining about the wave count with an ominous potential for a larger correction and to a lesser extent the possibility that the FED may be buying overpriced agency mortgage-backed securities with their monthly purchases. Lower future real estate values would cause lower values in the FED’s security portfolio.
Over valuation doesn’t seem to be a major point today based on forward earnings. Of course if a financial accident is upcoming and those earnings are in danger, any forward projection would be worthless. I don’t have a clue if an accident is on the horizon. But . . . I believe one or more are queuing up for the future. When they strike is probably dependent on the next slow down in the economy. An upward bound economy has a habit of keeping things in check for awhile.
Presently in some countries, real estate is highly over-valued and a bubble is definitely in force. Can foreign real estate revaluations affect us here??? In our interlocked world of trading and international banking, it certainly seems possible. Damaged foreign banks through failed real estate loans can affect international banks with exposures in the affected countries. Witness how the U.S. failing banks in 2008 contaminated the entire world.
London has been in a real estate bubble for some time. In October 2013, prices rose 10% (shades of 2005 in the USA). Most everyone is well aware of the bubble in China real estate as they build for consumption that doesn’t exist, or won’t occur for another decade.
Here is a chart of real estate prices throughout the world. There are a lot of U.S. cities on this list, but their price rises are rebounding towards the prior 2005 peak. Is that meaningful??????
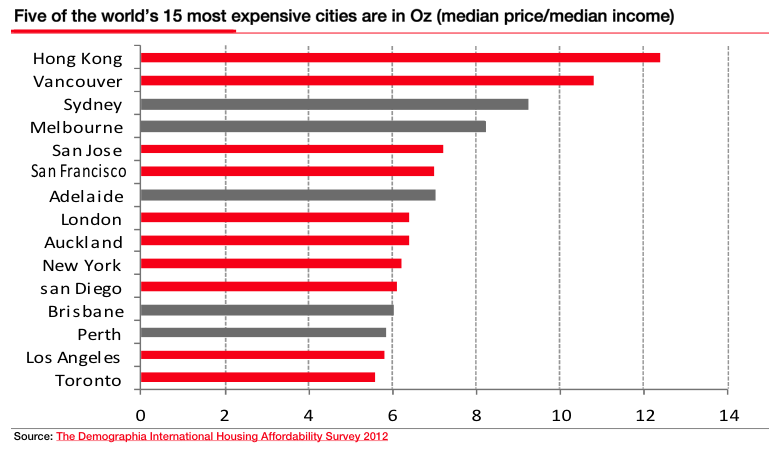
Most Expensive Cities
Or the affordability rating of housing by nation. I like this chart and find that it’s telling the best story.

Affordability by Nation
But real estate is not my expertise, so I wouldn’t get too excited about anything I say on this subject as I’m just tossing things against the wall to see what sticks.
—————————————————
- Click on any chart to enlarge it
- ES is SP 500 futures
- YM is DJ Industrial futures
- NQ is NASDAQ Composite futures
- All Rights Reserved © ™
—————————————————
- Leave me a comment just a few inches below, look for:

Leave a reply
- If you only see the following:

Comments
- Click on “Be the first to comment” and you’ll see:
Leave a reply
- I “try” to answer all questions.
—————————————————
This is a Wall St. trader that made some mistakes in the market this year, Maybe he’s trying to figure out how to rectify them. But he seems to have a bad attitude towards Wall St. You gotta admit your mistakes and move on, otherwise they will consume you.