 10/15/13 . . . by Bob Karrow
- If you don’t understand my unorthodox wave counting method,
Read Me First (corrected link)
- Otherwise continue on to see my charts at
“My Charts” at StockCharts.com
- “Follow” my tweets to stay current. My tweets are frequent and my blogs are infrequent.
- Following the recap of my recent Tweets, there will be more thoughts about today’s market.
—————————————————
I’ve had 36 Tweets since I last showed my tweets for the blog. Read these tweets from the bottom up to maintain the timeline as it unfolded.
Make sure and listen to the interview on Tweet #14
-
I watch junk bond ETFs because they are the canary in the coal mine. They tend to react early, showing a yet to be seen trend.
-
Junk bonds not in free fall
JNK
HIO – double topped early 2013 and started falliing
-
Volume higher than yesterday
DBV continues upward
BUT projection end?
-
Updated trendline from yesterday
Retracement levels
Projection lines
-
If DC is dumb enough to default??????? Worst case scenario is large step III begins (red letters) chart #10.1
-
We’ve seen this movie before, the hero saves the day but not until doom was assured!!! Jeff Saut today said:
-
Short term
Intermediate, old line limiting present peaks
Long
-
When a debt/budget deal is reached, market will rally quickly into a short term peak.
-
ADX indicates market getting extended and might take a breather 60 minute ADX
5 minute ADX
-
Russell 2000 (RUT) counts well, indicates a 5th step ahead, coupled with rising wedge indicates rough times coming
-
Rising wedges (diagonals) in the last step
2011
2013
-
Paraphrased from “Elliott Wave Principle: Key To Market Behavior” Ending diagonal triangles in the 3rd step, imply dramatic reversal ahead
-
Jeff Saut’s 1684 SPX was below the line for 3 days, then rocketed back. No VALID break has taken place even though spent 3 days below.
-
*****LISTEN TO THIS INTERVIEW*****
One of the few people that I listen to is Christine Lagarde. She pulls no punches, always tells like it is.
-
Dow -100 points tonight as Dem & Rep duke it out over budget diff. Eyeball to eyeball, waiting for the other to blink first. Nutty guys!
-
One of the Fibonacci fans I published yesterday. It’s still dead on target. We’ll see if it can maintain that.
-
Market reached Fibonacci retracement level. How long it rests could be revealing. Strong advances don’t wait long
-
-
Not quite 90% up day, volume was 92% but advance decline was 84% See my charts, #10.20 – VOLUME % – OVER/UNDER 90%
-
-
Upside Fibonacci projections, we’re close to lines presently – grey and blue lines, yellow is retracement
-
Example of Fibonacci projection. Valid projection will have multiple valid stopping points like this one did.
-
Comet ISON close to Mars presently & +10th magnitude Peak brightness could be –10 late Nov Moon has magnitude of –12
http://spaceweathergallery.com/indiv_upload.php?upload_id=87545 …
-
Today a comet is diving into sun & breaking up, look at 5 o’clock position in video. I have wide eclectic interests.
http://spaceweather.com/images2013/10oct13/sundiver_anim.gif?PHPSESSID=oht1enl2ok1tc5ul1tcac5kms4 …
-
Today’s Jeff Saut comments. His comments are written very early, about 5:30 AM EDT. Click date link for comments.
-
I’ve uploaded today’s Jeff Saut’s audio comments, taking forever to process. When I have a link from the blog library, I’ll post it.
-
Fibonacci fans I drew a couple of days ago. Resistance on the lines
-
The Russell 2000 usually counts well and it’s looking for one more peak. That would also hold true for the NASDAQ.
-
-
Apple is having problems with resistance around 492.
-
Possible trendline???? I’ve been busy this morning.
-
The ADX could pause for a breather here as it’s looking extended.
-
The rally began yesterday a couple hours after the market opened. We’re up 40 futures points since Wednesday.
-
-
@NatlParkService What happens if government shuts down on Oct 1. If I’m camped inside the park on Oct 1, will I be kicked out???? -
-
-
If we have a higher high, watch for a 5 count on the saw-tooth top. Otherwise we will have a 3 peak top completed.
-
“I’m watching for a “possible” last gasp rally that could provide a decent shorting opportunity.”
 Bob Karrow
 —————————————————
Fitch Puts US on “Rating Watch Negative”. No surprise there. Next up is Standard & Poors watch.
The market is certainly waiting for DC results. Since the market remains close to its highs, Mr. Market believes that the Hollywood drama . . . oops, I meant Washington drama will play out with salvation coming at the last possible minute. Whew!!! Saved at the last minute just like a 1930s movie serial.
Now if everything is resolved in a reasonable manner, all will be OK. But will it??? How will the world perceive us in the future?? Many may perceive a nation barely able to govern itself as not a Super Power.
So we obviously have 2 possible scenarios, default or no default. Default seems unlikely and irresponsible. It would carry SEVERE voter wrath for both the Dem. and Rep. I guess Tea Party constituents would be happy (???).
BUT it seems that neither side wants to blink. That type thinking could put us past the deadline for default. After the deadline the Treasury will obviously prioritize their payments to avoid a default on issues carrying the “full faith and credit of the United States”. Default on issues carrying the “full faith and credit of the United States” has the effect of a nuke in the credit markets. I want to make sure you realize that not every US debt has the “full faith and credit of the United States”.
If we default things would change forever, particularly on the world stage.
A default could cause us to fall into large step III down, which would be the final step in the megaphone bear market that began in 2000 (see chart below). That’s the worst case scenario.
There are other stock market scenarios resulting from default that wouldn’t be that severe. They would involve a significant correction, but not large step III bad. One scenario that carries the possibility of a continuation of the bull market would have a decline to the dotted red line (chart below), which is around 10,500. This level last occurred in Oct 2011. That would be about a 1/3 correction (Fibonacci number).
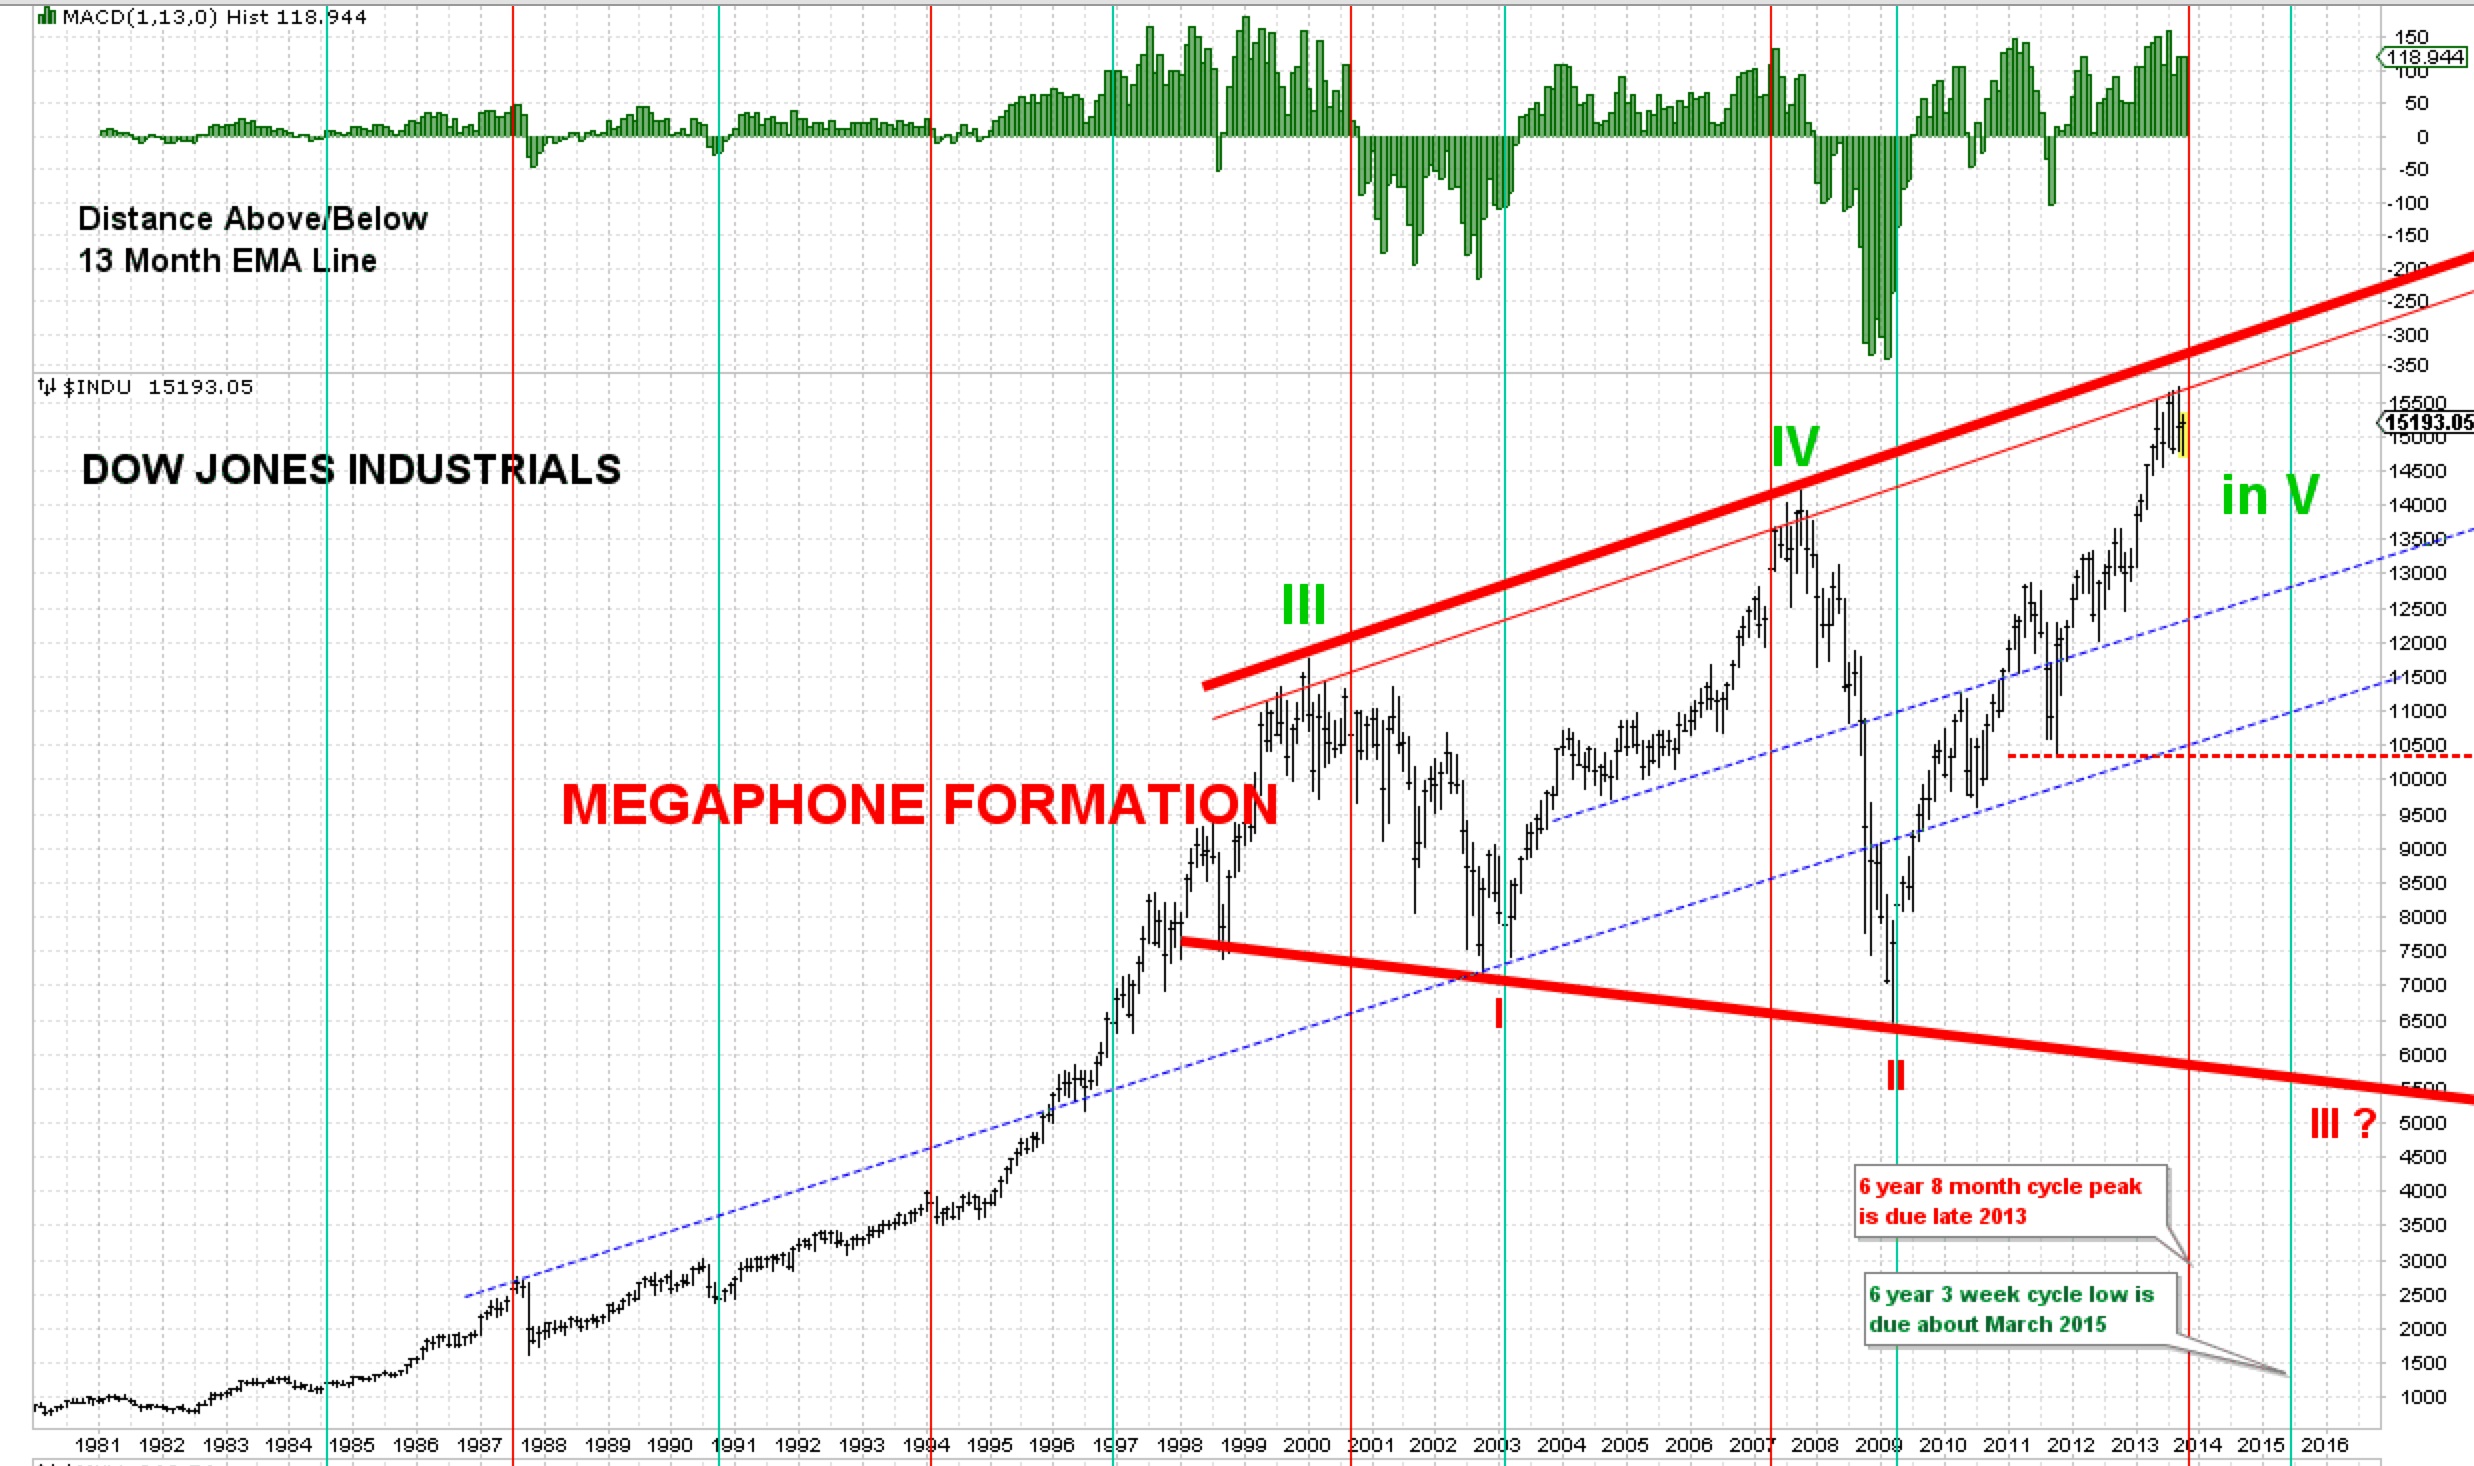
STEP III
Without default, we continue up into what “should” be the last step up. This is best case scenario. The problem is that at the conclusion of the next step, we should have a significant correction. One that would last for months, not weeks.
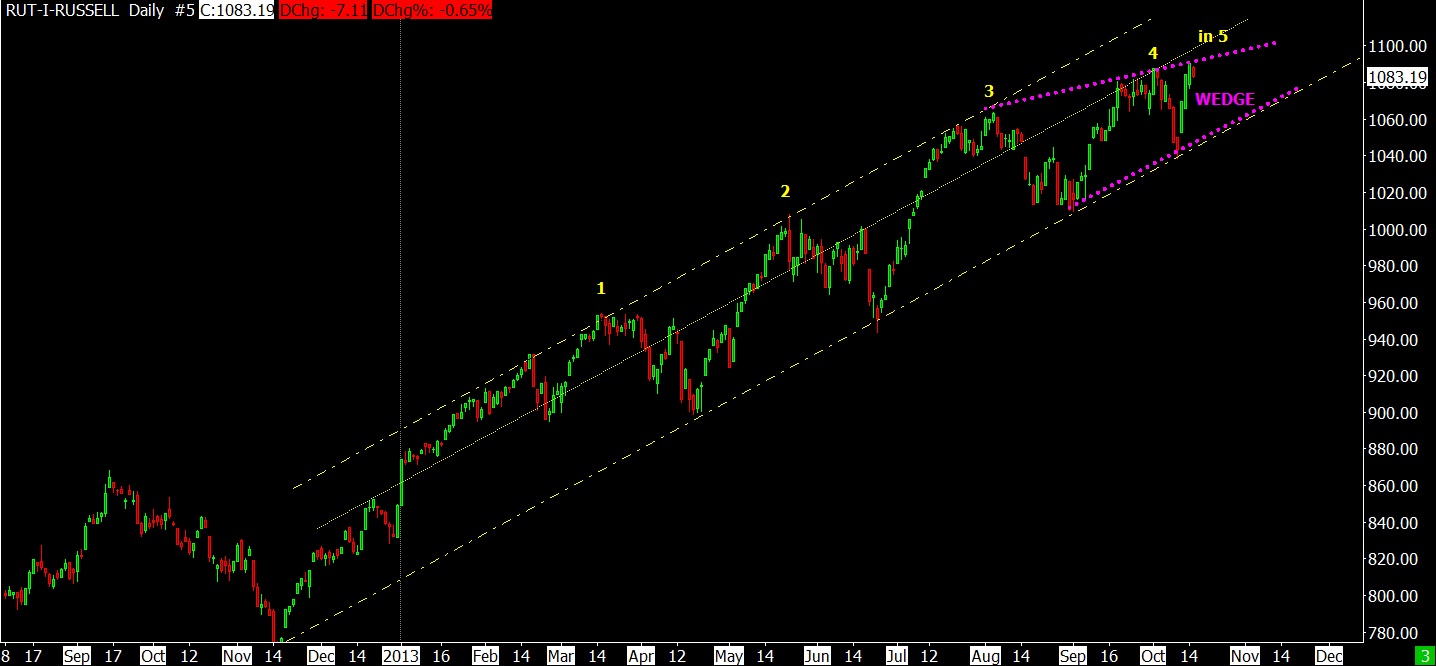
10-15-13 RUT DAILY BARS – STEP 5
CHICKEN LITTLE
I’m having the same problem that occurred in 2007, off by one step as I called a peak early creating an early false alarm. The present situation is running out of count possibilities and one of these days, I’ll have it right.
I am reasonably sure we are in the “area” of a peak. I have never wanted to wring the last drop out of a bull market and usually have become very cautious near the end. I become a scalper in the latter stages of a bull market. It was best said by Bernard Baruch, “I made money by selling too soon.” He was one of a handful of people that saved their Wall Street fortunes by selling prior to the October 1929 collapse.
We have a divergence between the weekly RSI and prices. This last occurred in 2011 and 2007.
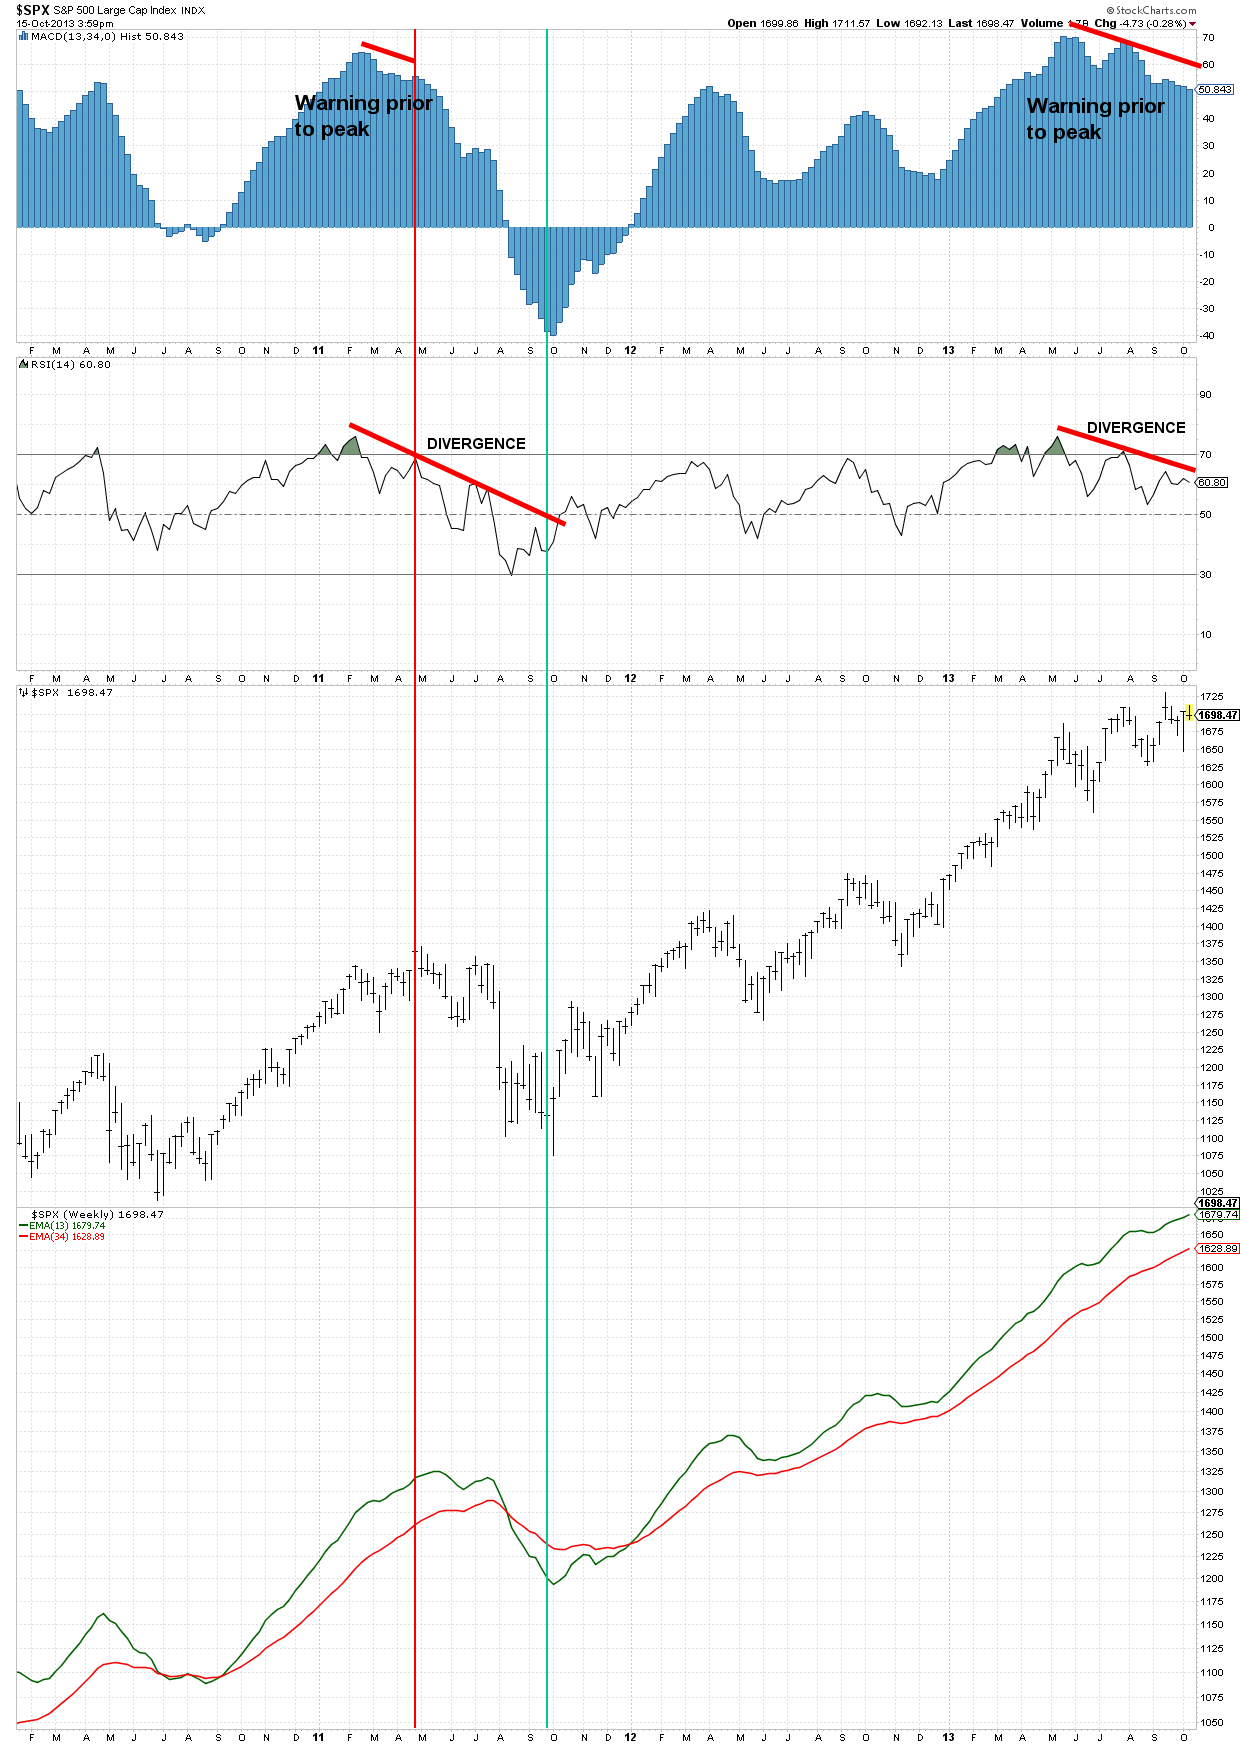
DIVERGENCE
The advance decline line has been limited on the upside since the May 22 peak.
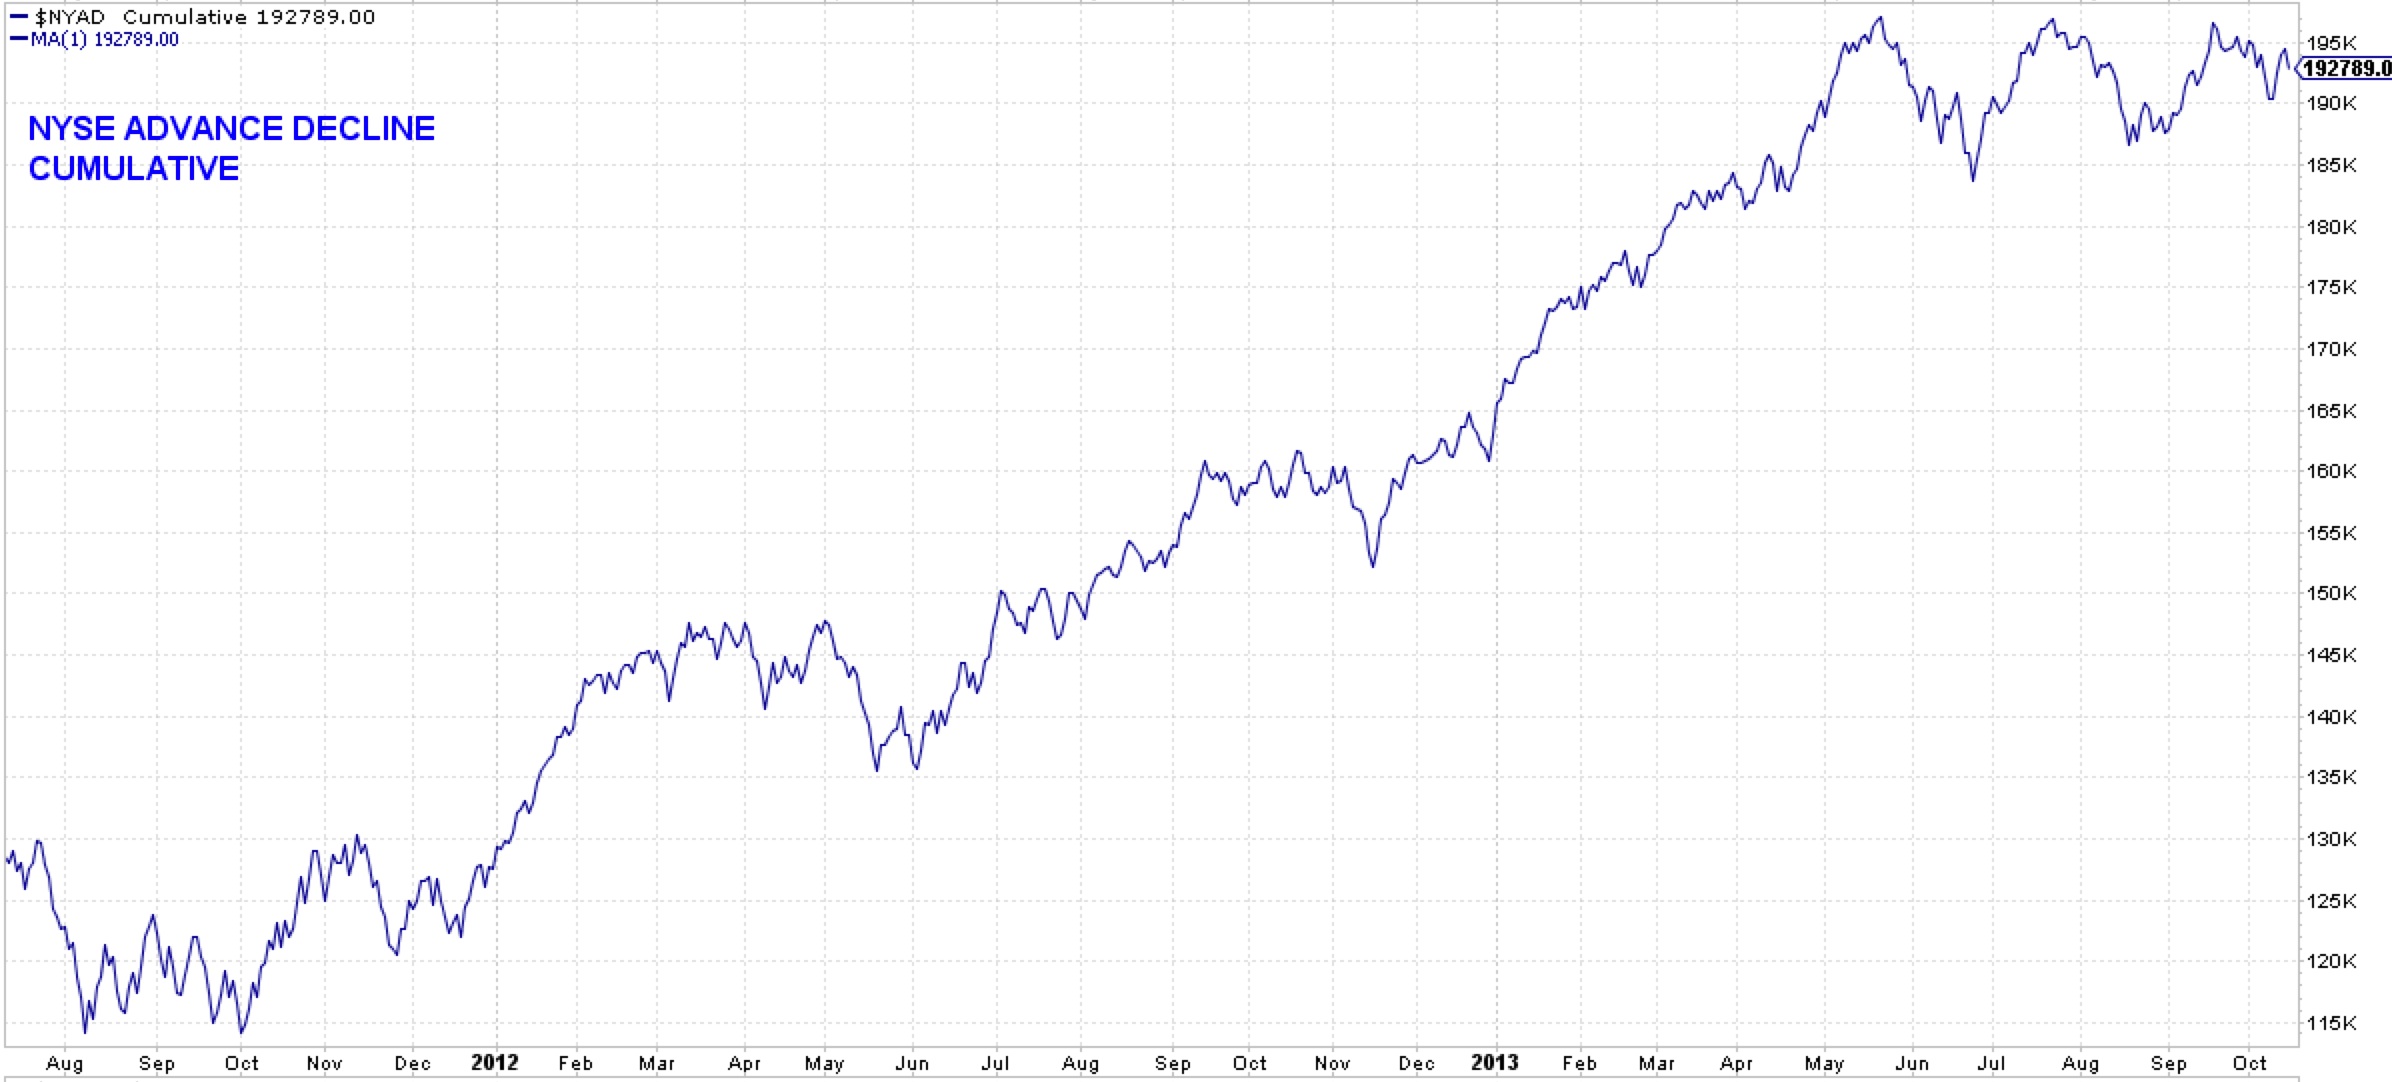
10-15-13 ADV DEC LINE – DAILY
Has the peak already taken place?
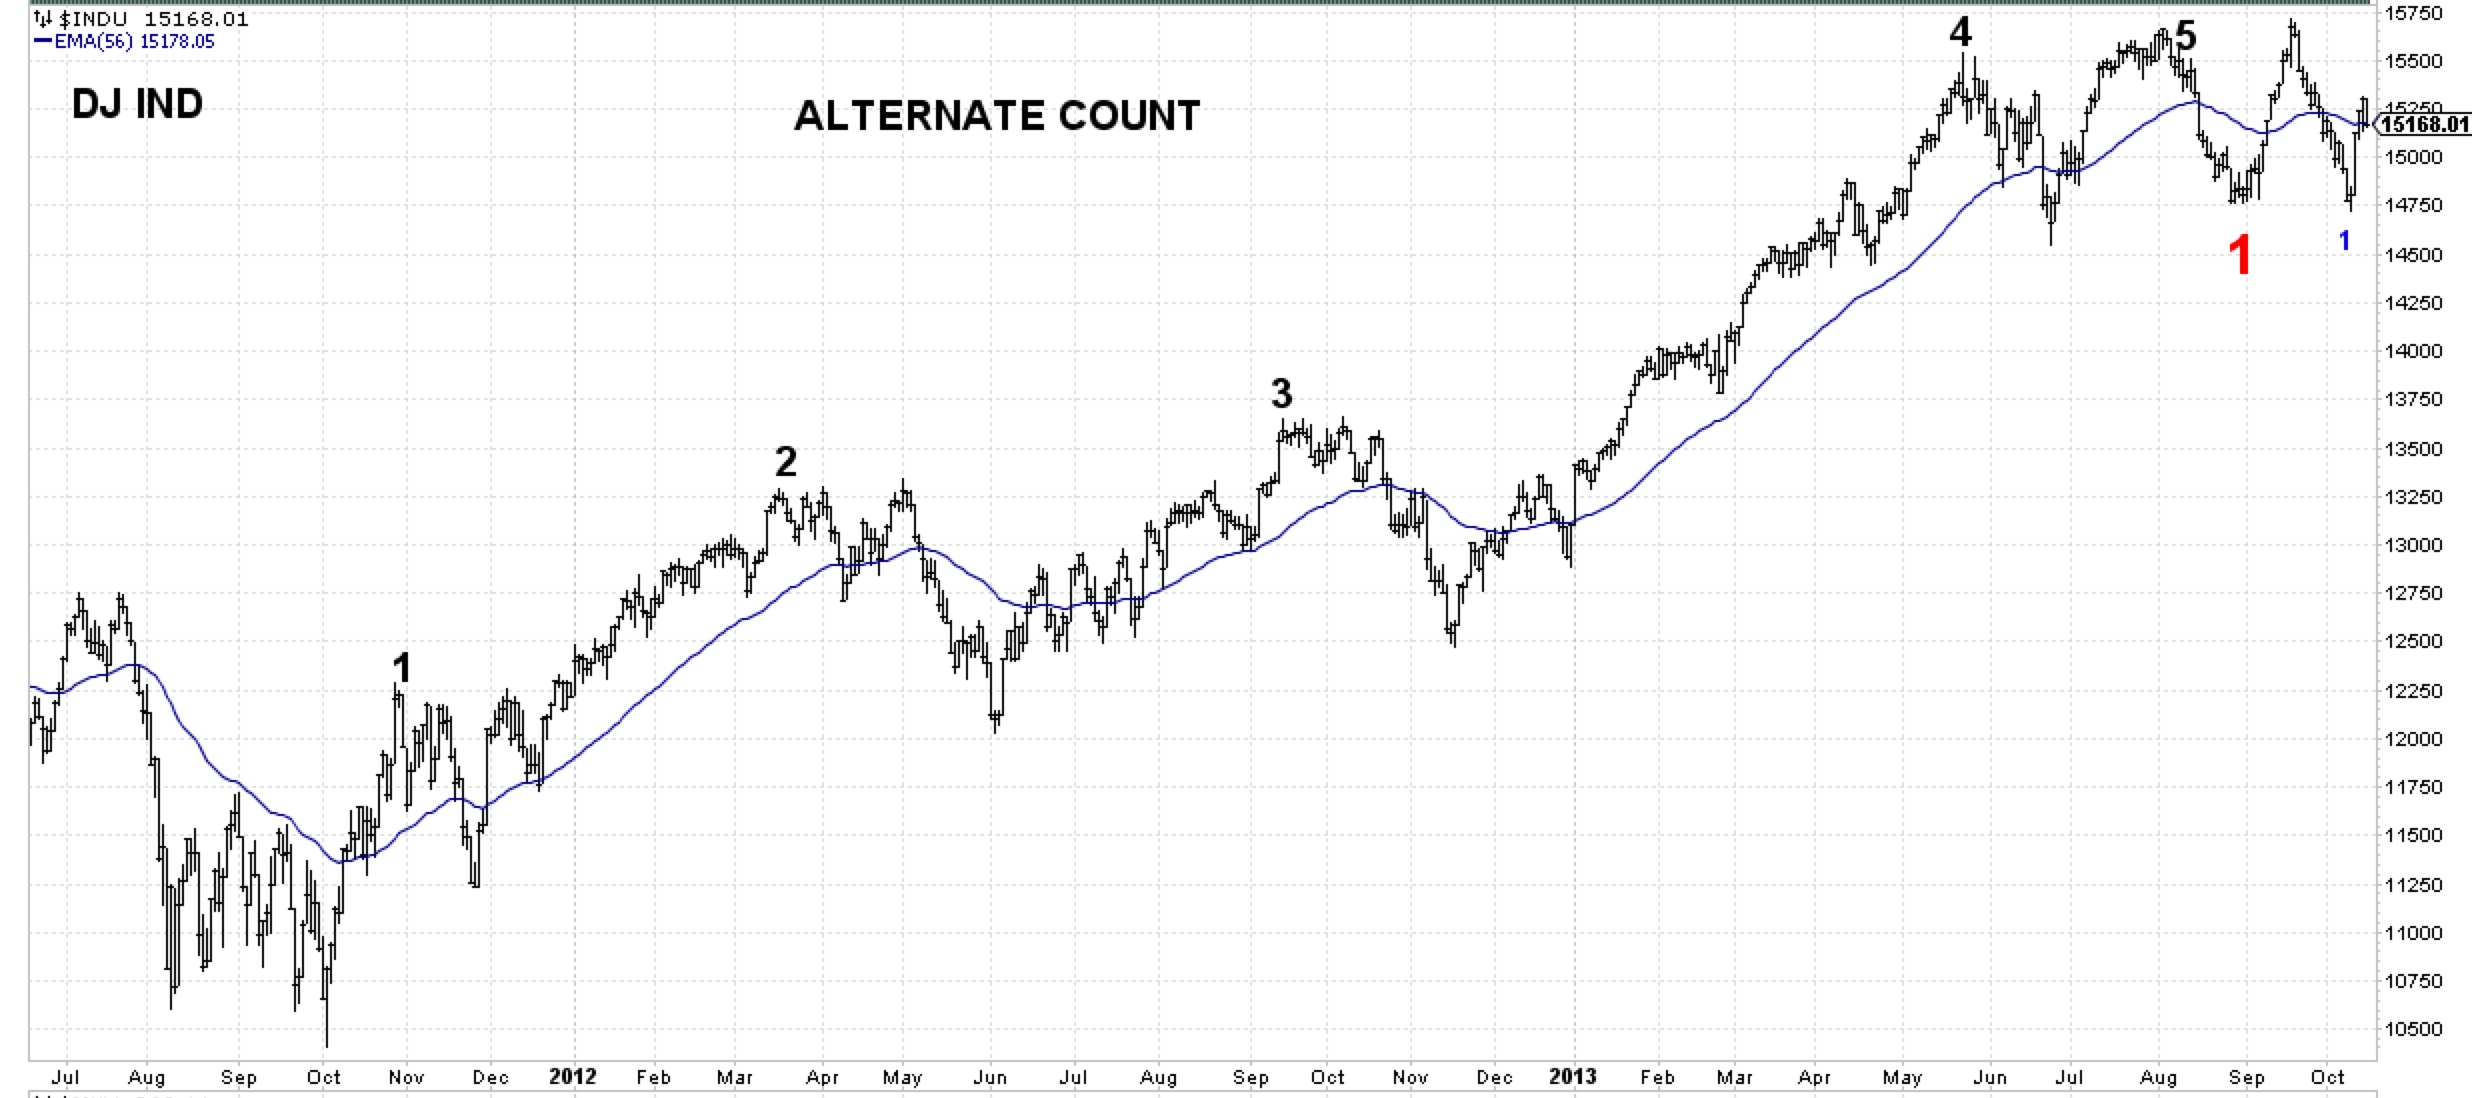
10-15-13 DJI DAILY BARS
Or a little more to go before the peak.
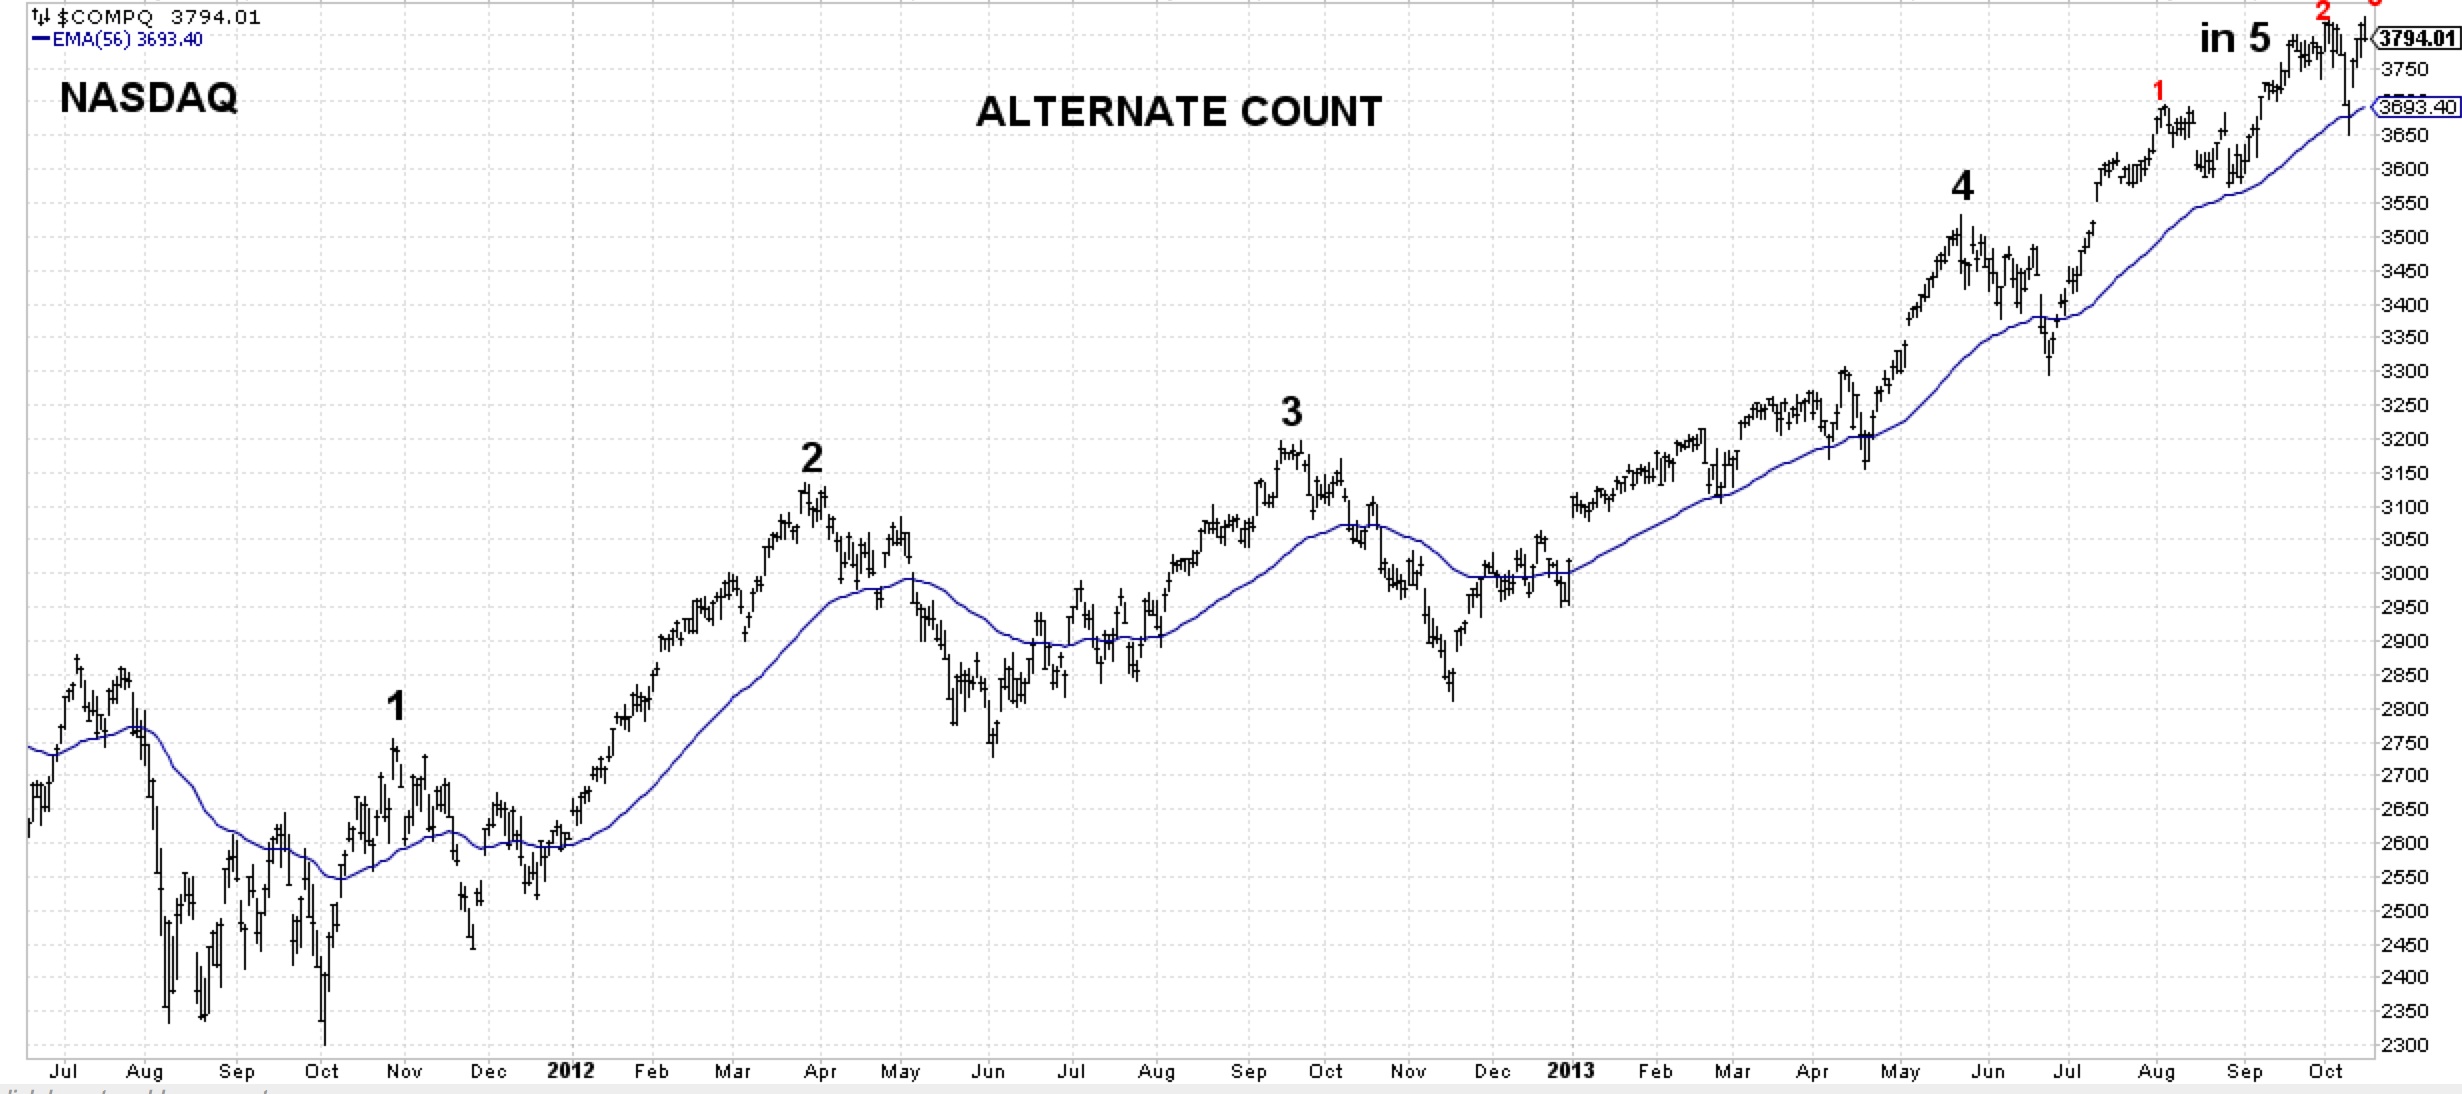
10-15-13 NASDAQ DAILY BARS
—————————————————
- Click on any chart to enlarge it
- ES is SP 500 futures
- YM is DJ Industrial futures
- NQ is NASDAQ Composite futures
Leave me a comment or question just a few inches below here. If it says “Comment”, click on the comment and you’ll see “Leave A Reply”.
All Rights Reserved © ™
