
MARKET MESSAGES
3/18/13 . . .
Today I’m looking at the long term wave counts, alternate wave counts, pitchforks and trend lines. The lines on these charts are prospective stopping points during longer term corrections. These charts should address any long term wave count confusion.
This first chart is a very long term pitchfork that shows “possible” limitations on the upside. Notice how nicely the lower line contained the 2007-2009 decline. Whether this pitchfork is valid or a crap shoot, it’s interesting and will remain so until prices make a significant break of the upper line.
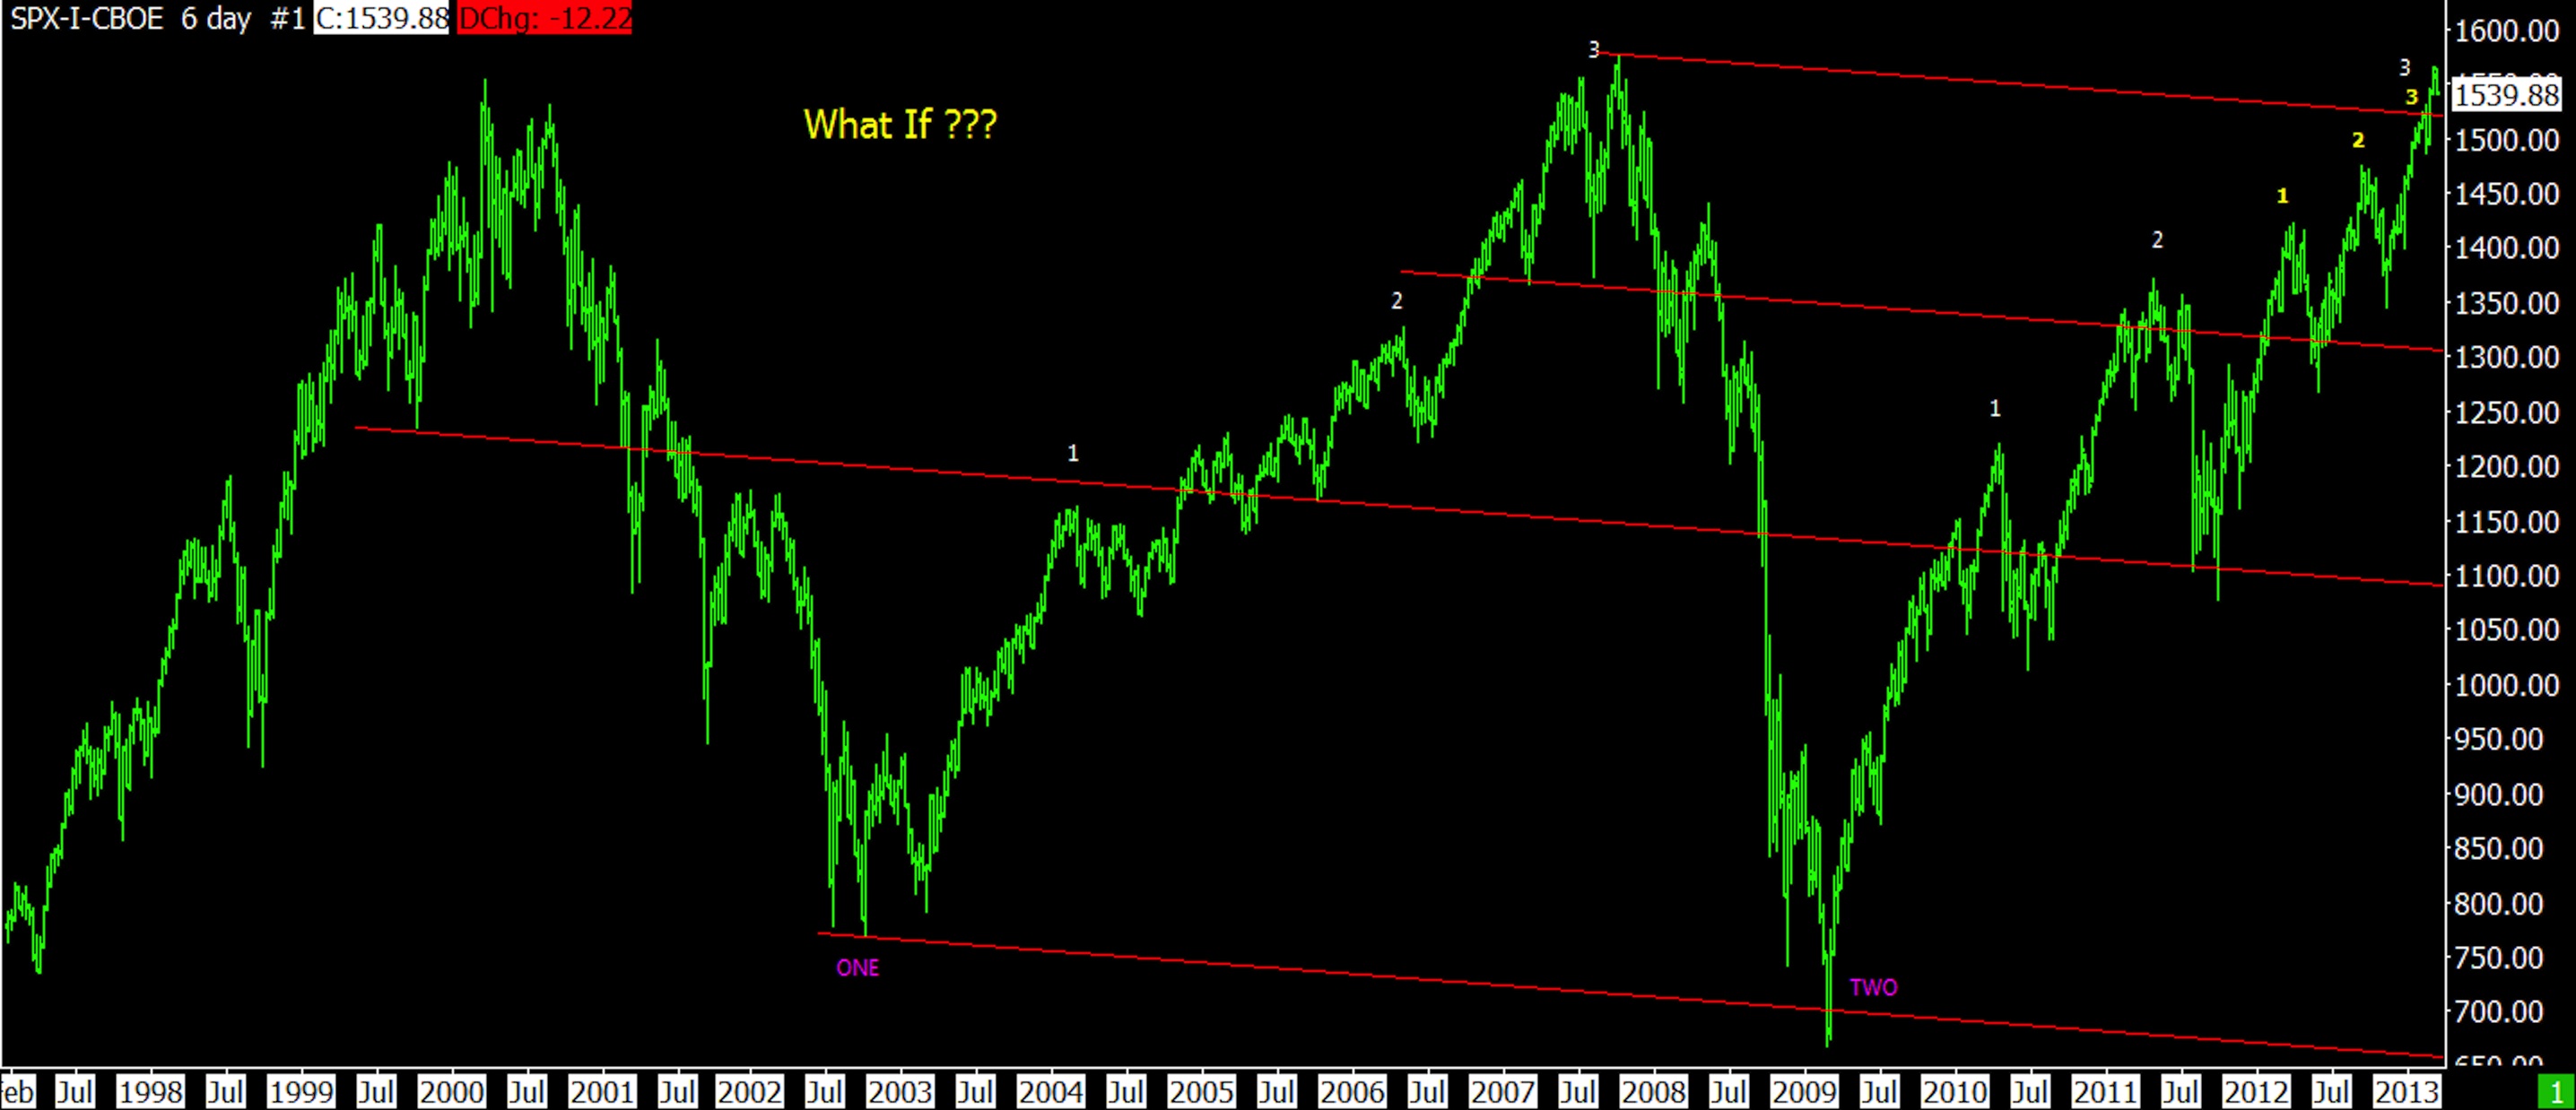
03-19-13 LONG TERM PITCHFORK
The next chart shows one possible wave count beginning in early 2012. I was intrigued with this wave count because of steps 4 and 5 during 2011. I was wondering at that time if 4 and 5 were part of a corrective process.
Notice the pitchfork drawn during 2012 and how the 2013 advance has hugged the lower line. Breaking this line should be a warning that the 2013 advance is finished.
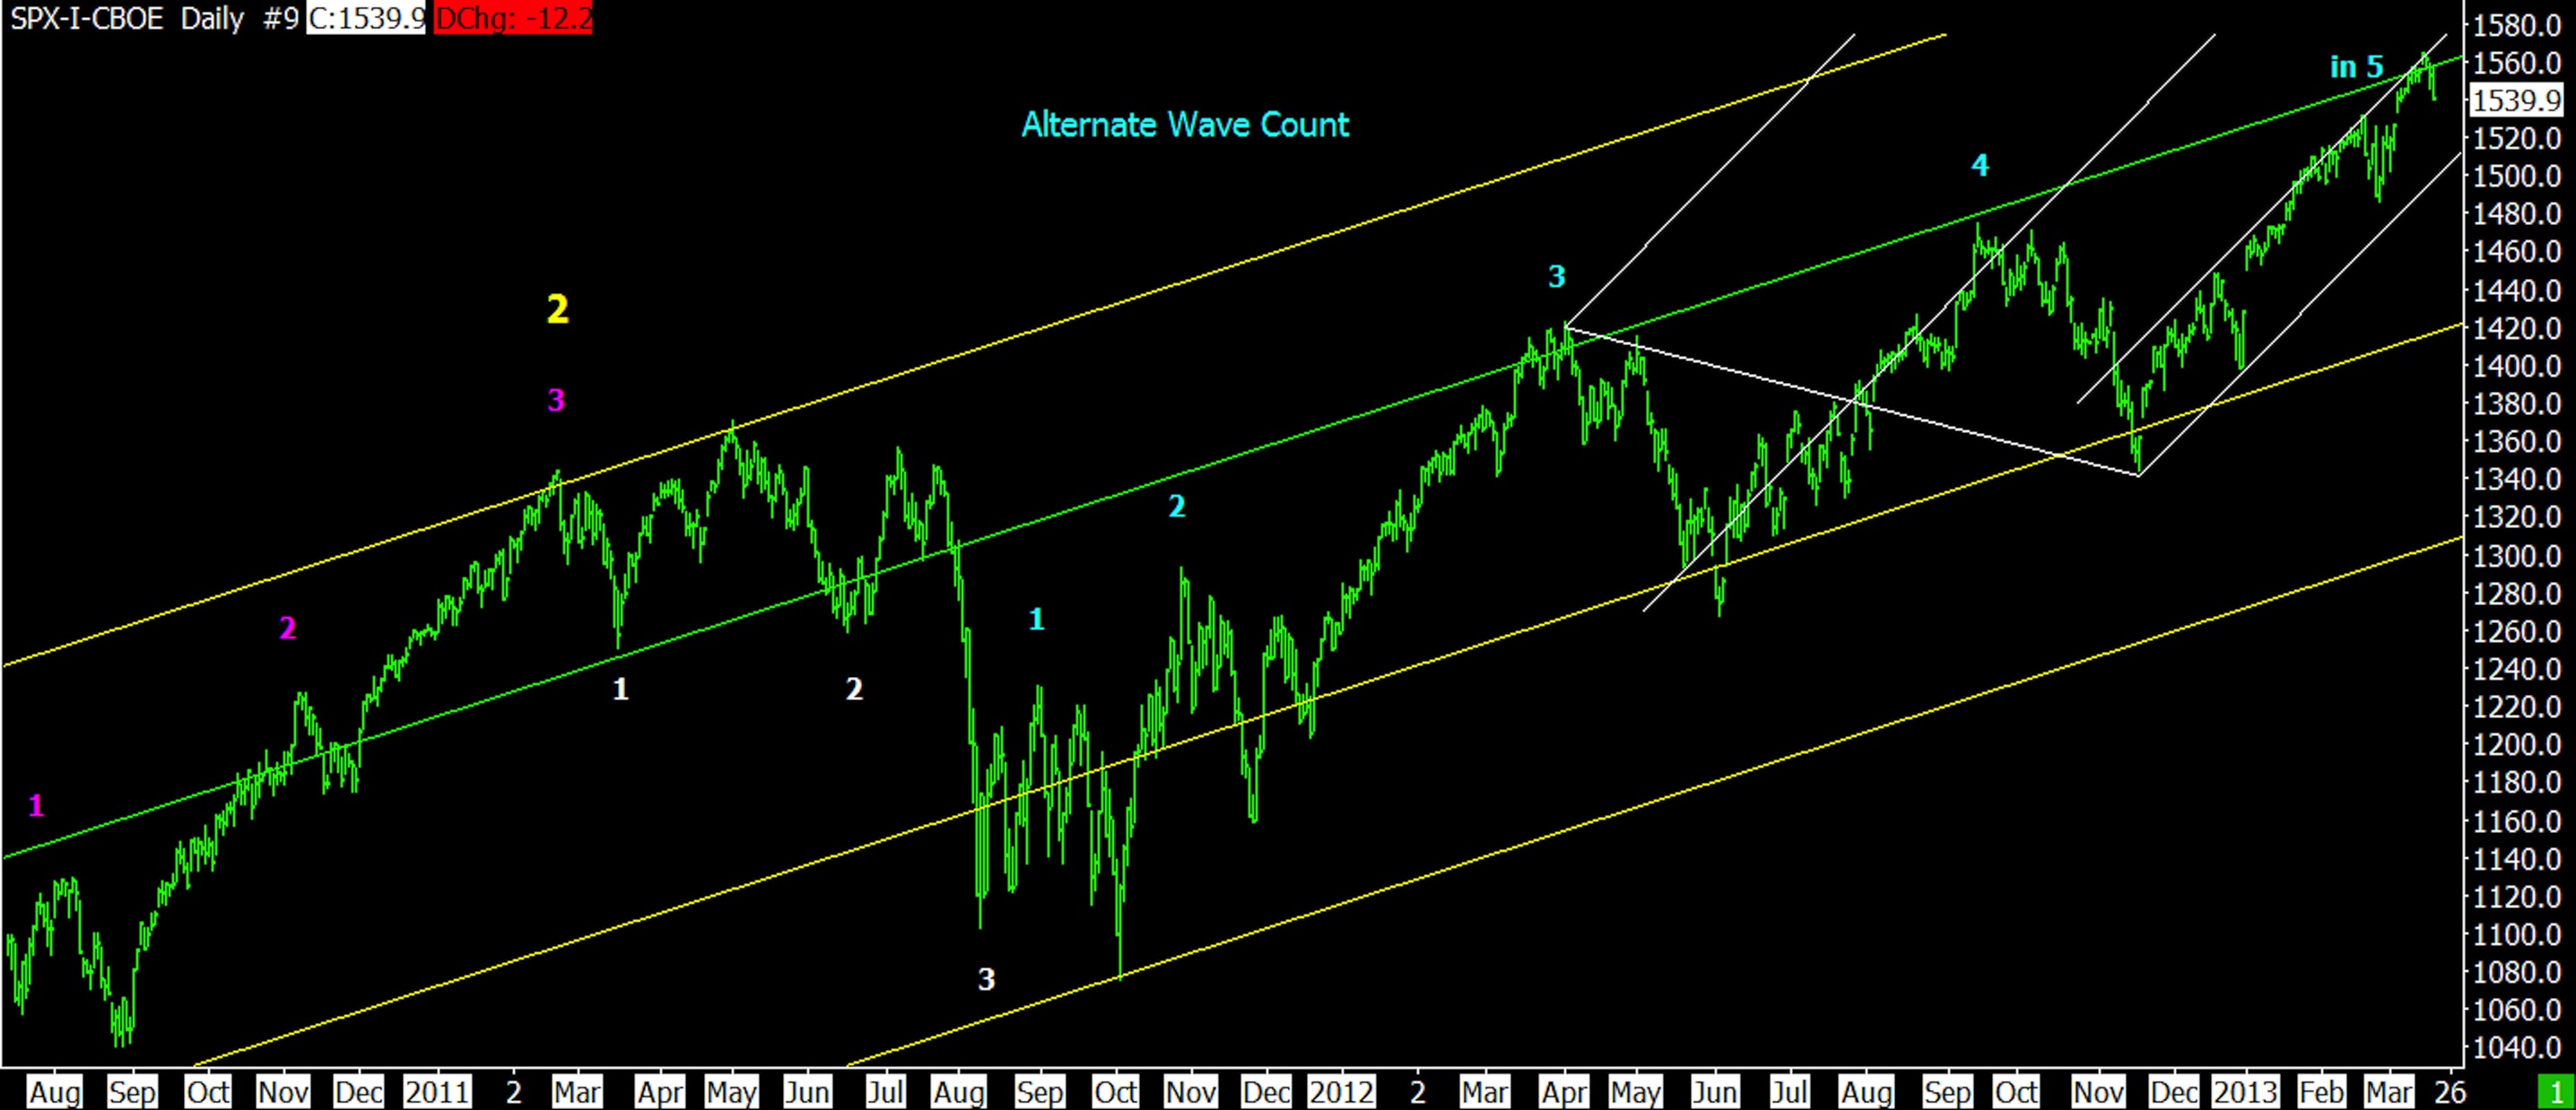
03-19-13 ALTERNATE WAVE COUNT
The following chart is the same as above only a longer term look at this possible alternate wave count. If this wave count is correct, we “could” be ending the bull market since March 2009. We’ll see how all of this works out.
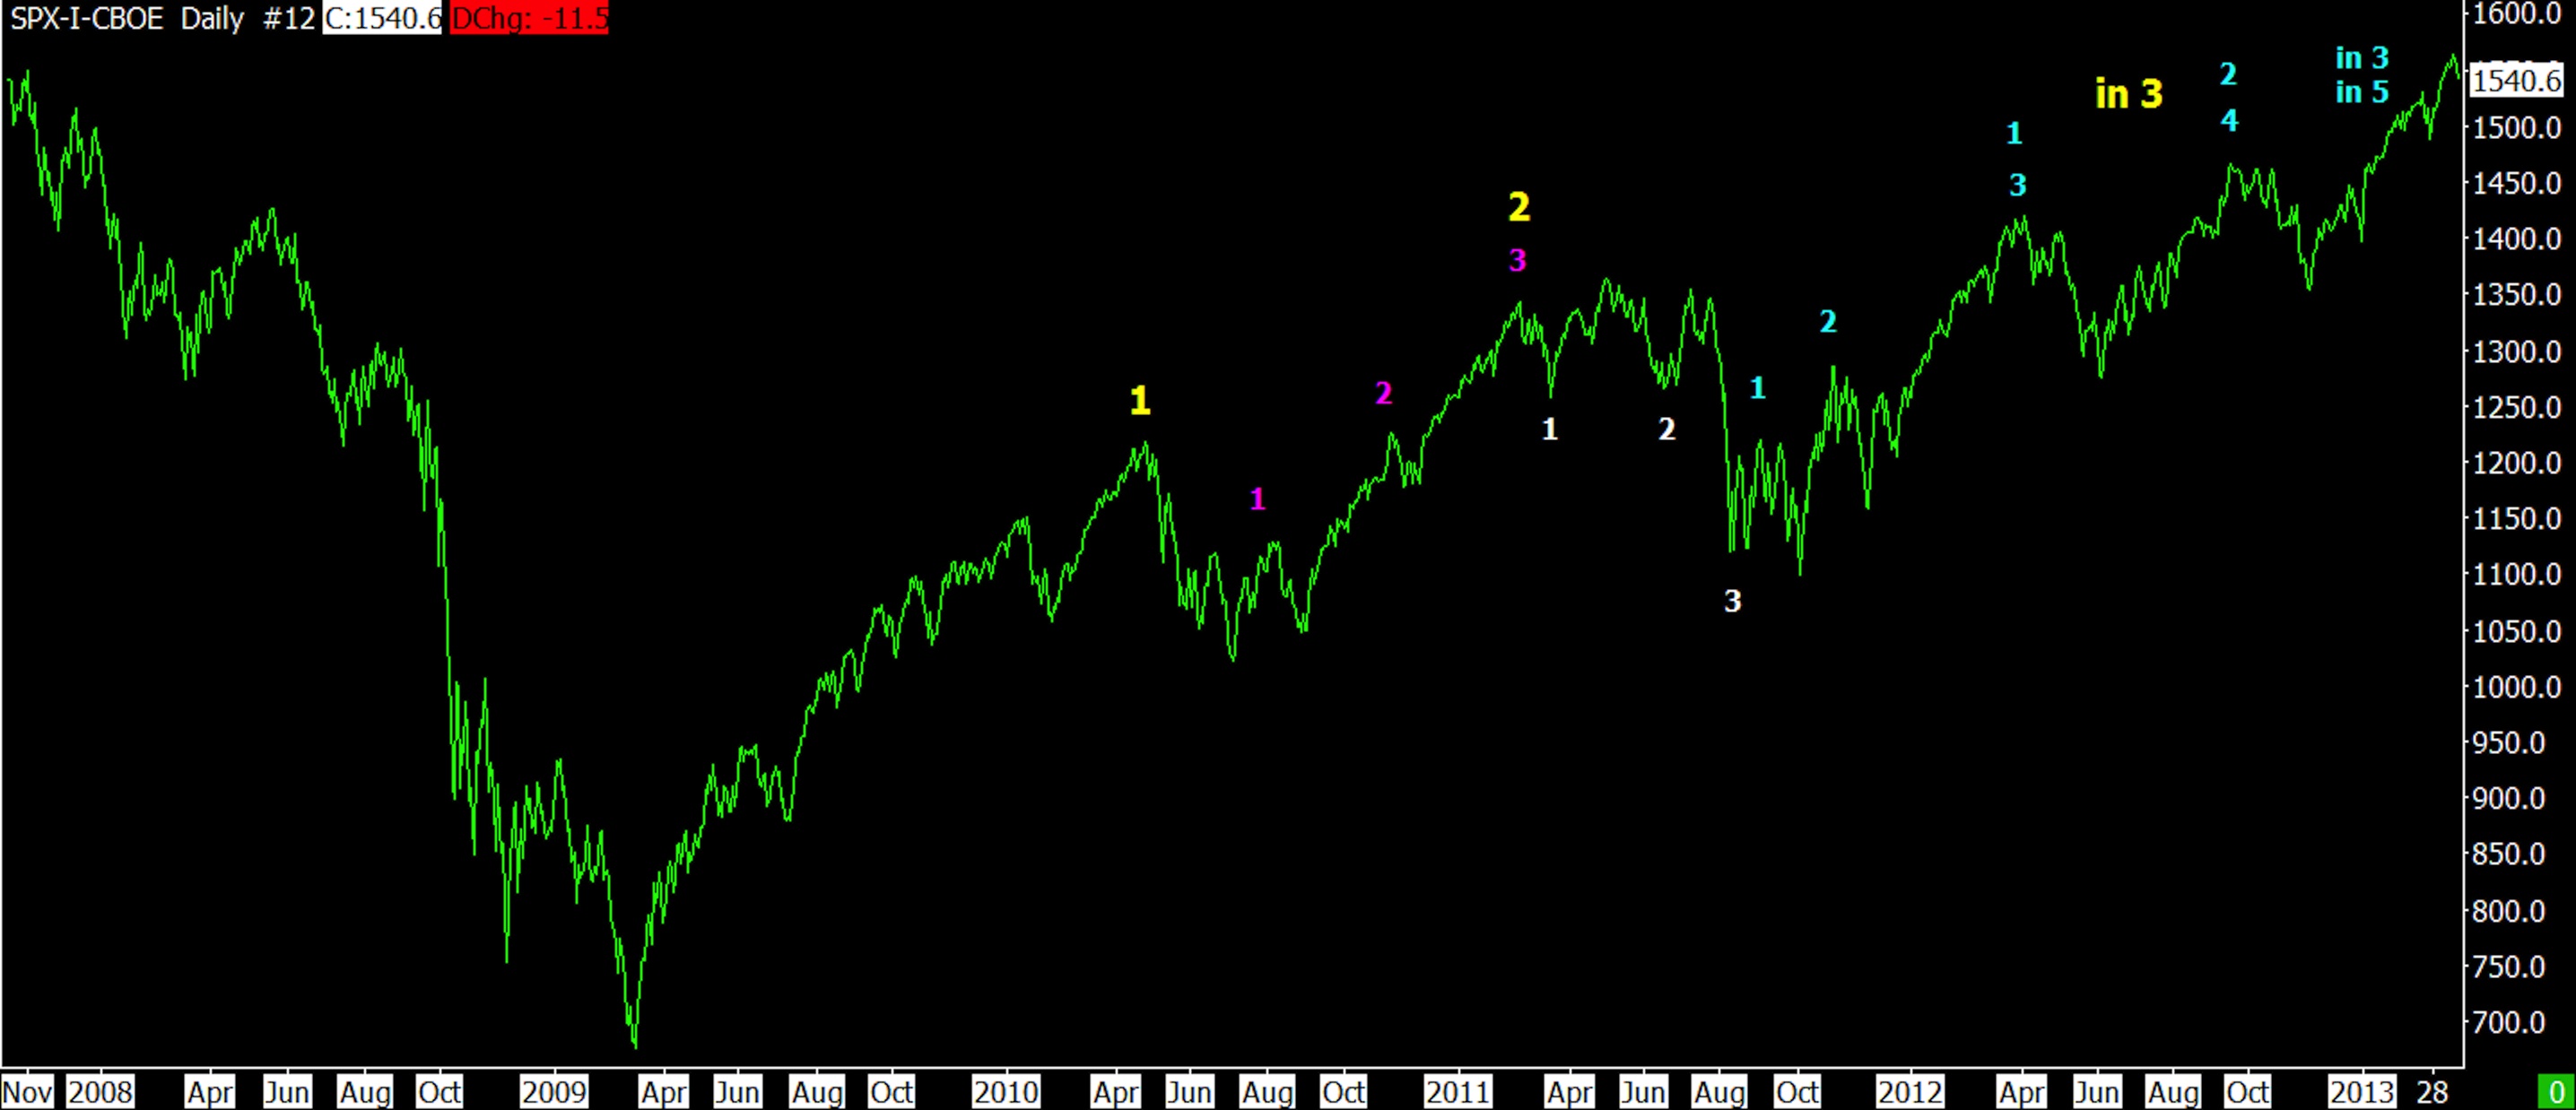
03-19-13 ALTERNATE WAVE COUNT LONG TERM
The following chart is the conventional wave count.
This count allows for another step upward, which I said was likely based on the history of the net high low figures (see prior blog update for details). It has a couple of interesting lines drawn. The steep yellow line is short term but the white line could be a “possible” stopping point for a larger correction. Other possible stopping points are the cyan and green lines. The cyan line allows for breaking below the October 2011 low, which would break the overall 2009 trend. The cyan or green lines are targets if we were to remain in a larger bull market move since 2009. Breaking below the March 2009 low would obviously signal large step 3 down. Large step 3 down will probably be dependent on financial “accidents” taking place (like 2008). Accidents on the horizon are many but which one will become a reality???

03-19-13 CONVENTIONAL WAVE COUNT
The next chart shows the Keltner trend lines for the SPX. In the past these lines have provided a good indication of the limits of the trend (both up or down). During February 2013 the market hugged the upper line, fell away in a correction in late February and then contacted the Keltner line again from March 11 – 15.
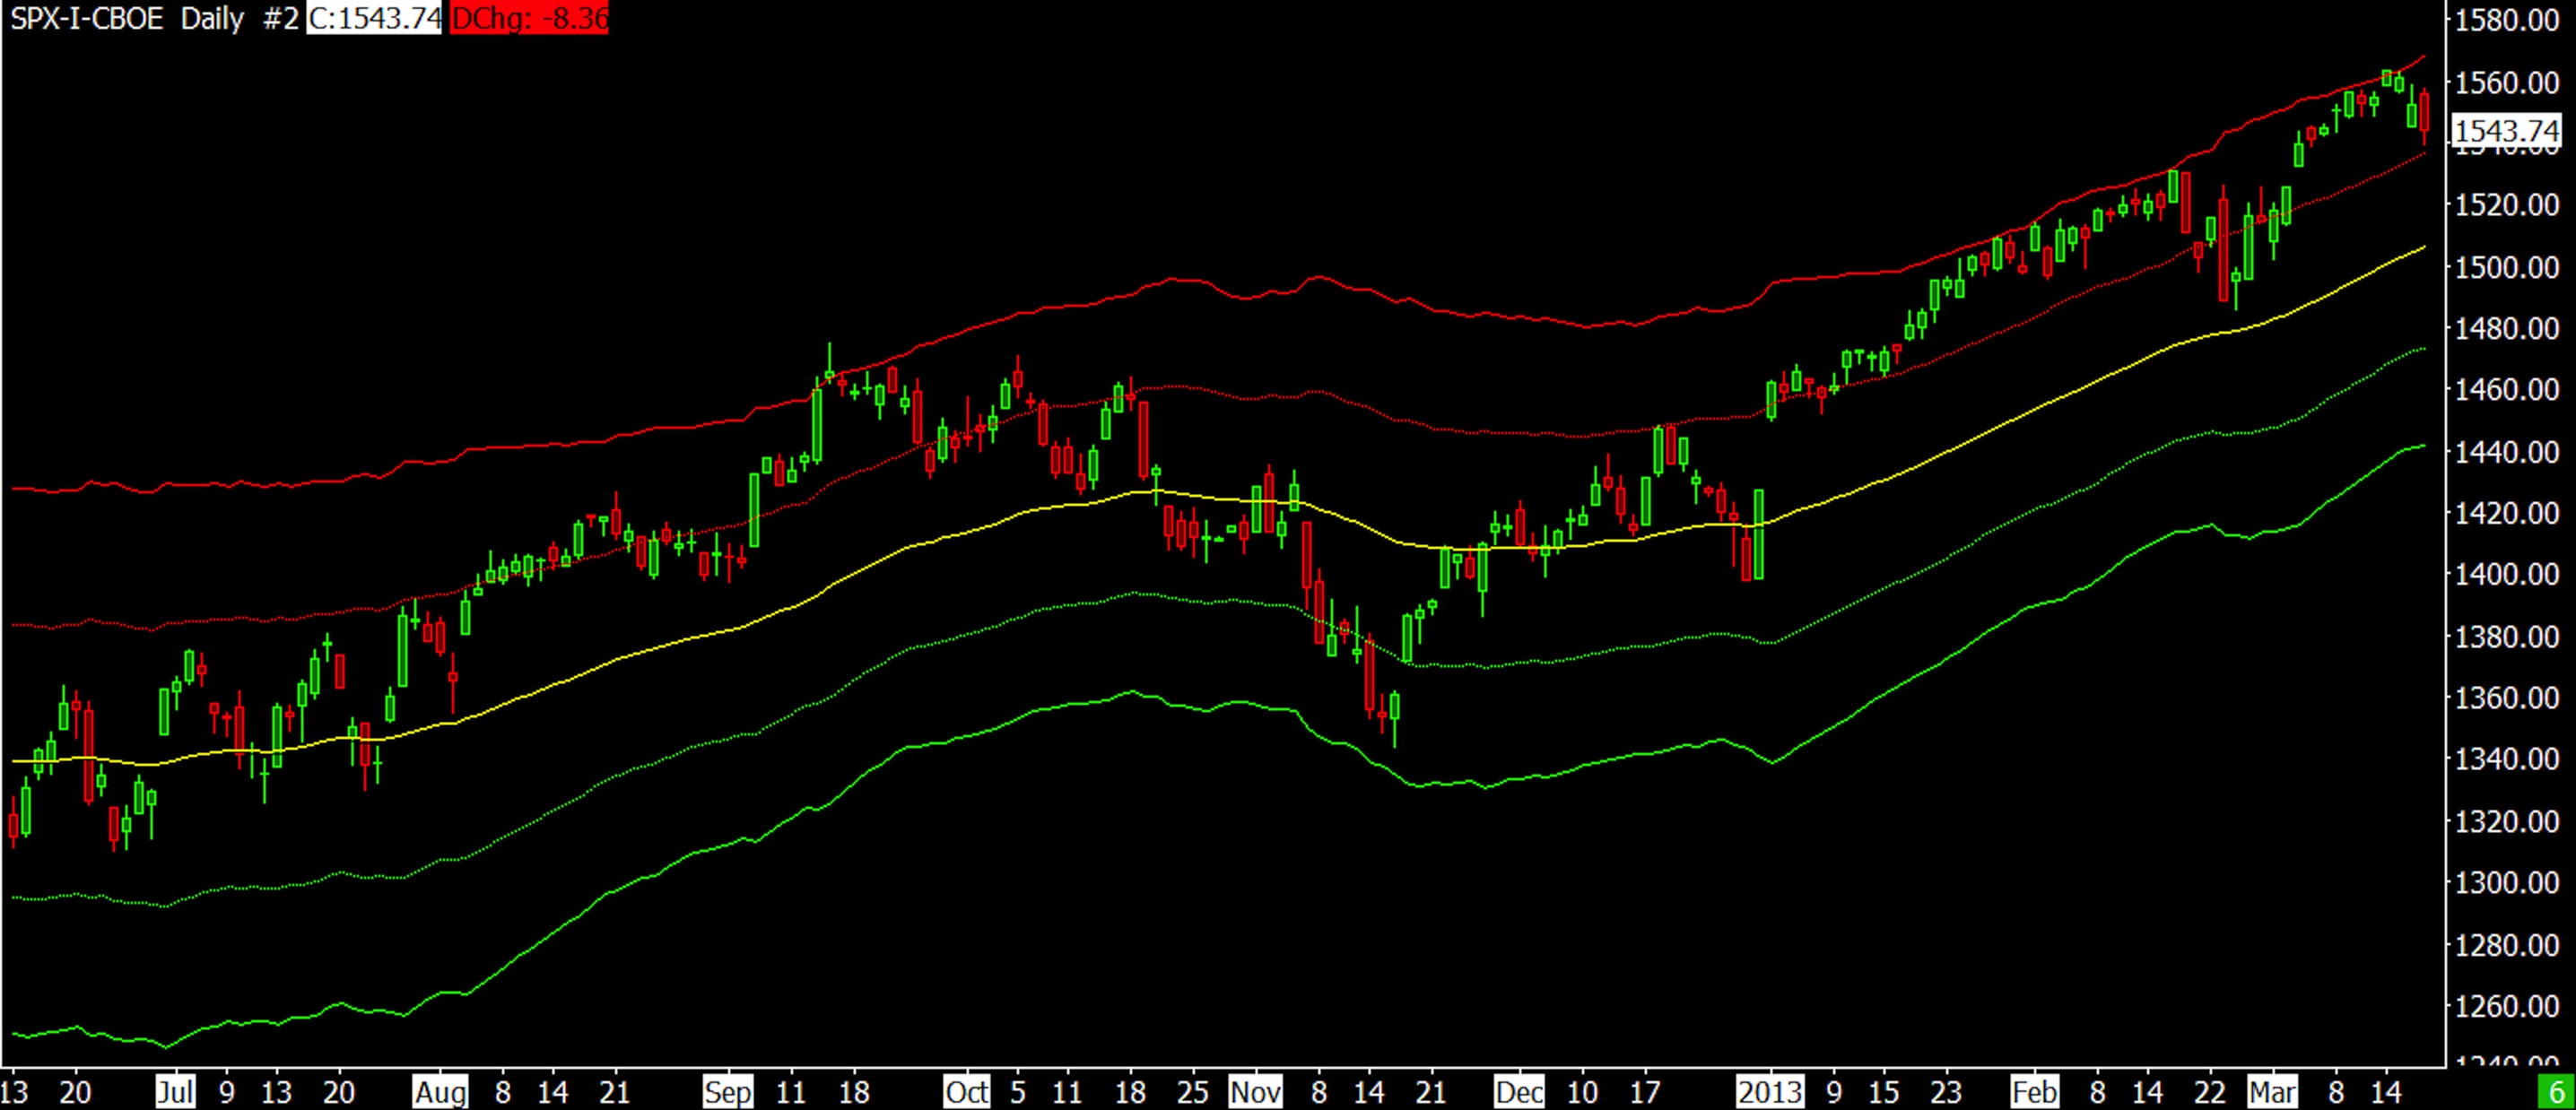
03-19-13 SPX KELTNER TREND
Next is the SPX daily chart with Keltner lines and wave count since November 2012. The break down from 3rd step is very muted to date and the market has presently contacted the red dashed mid-line. These mid-lines can be “possible” stopping points. We’ll see whether that is true presently, but the breaking of 3rd step is not definite according to this chart. We’ll see how this unfolds. Notice how close the SPX came to its all-time high on March 14th. It’s anti-climatic whether the SPX makes a new all-time high or not because many other indexes have already achieved highs above their 2007 peaks.
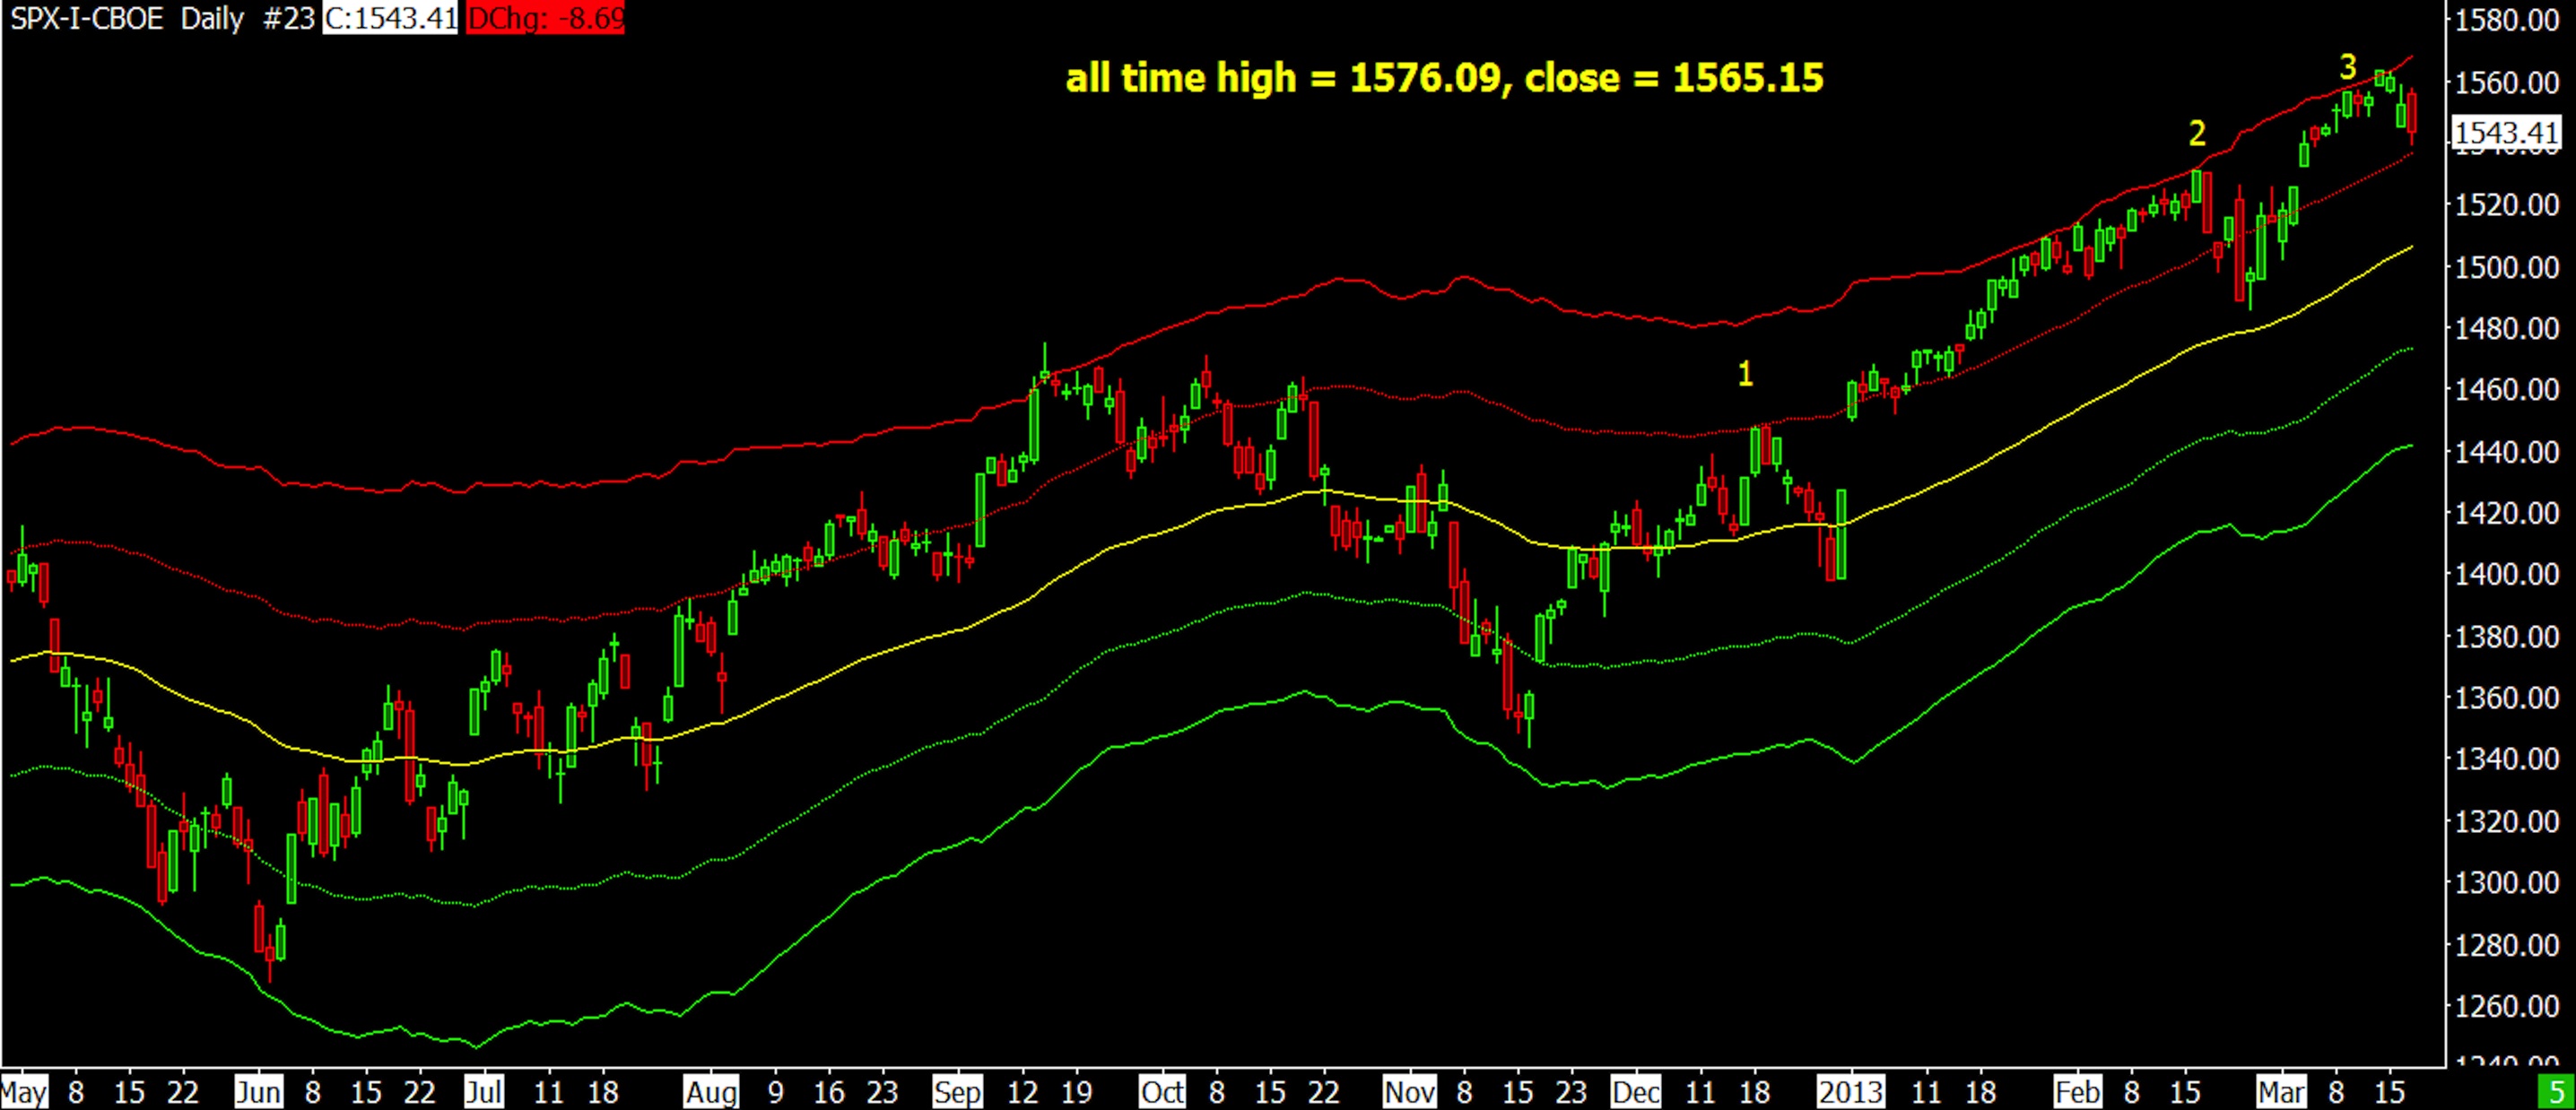
03-19-13 SPX KELTNER DAILY
The following chart is the NASDAQ Composite equal weight and shows a clear break of the 3rd step.
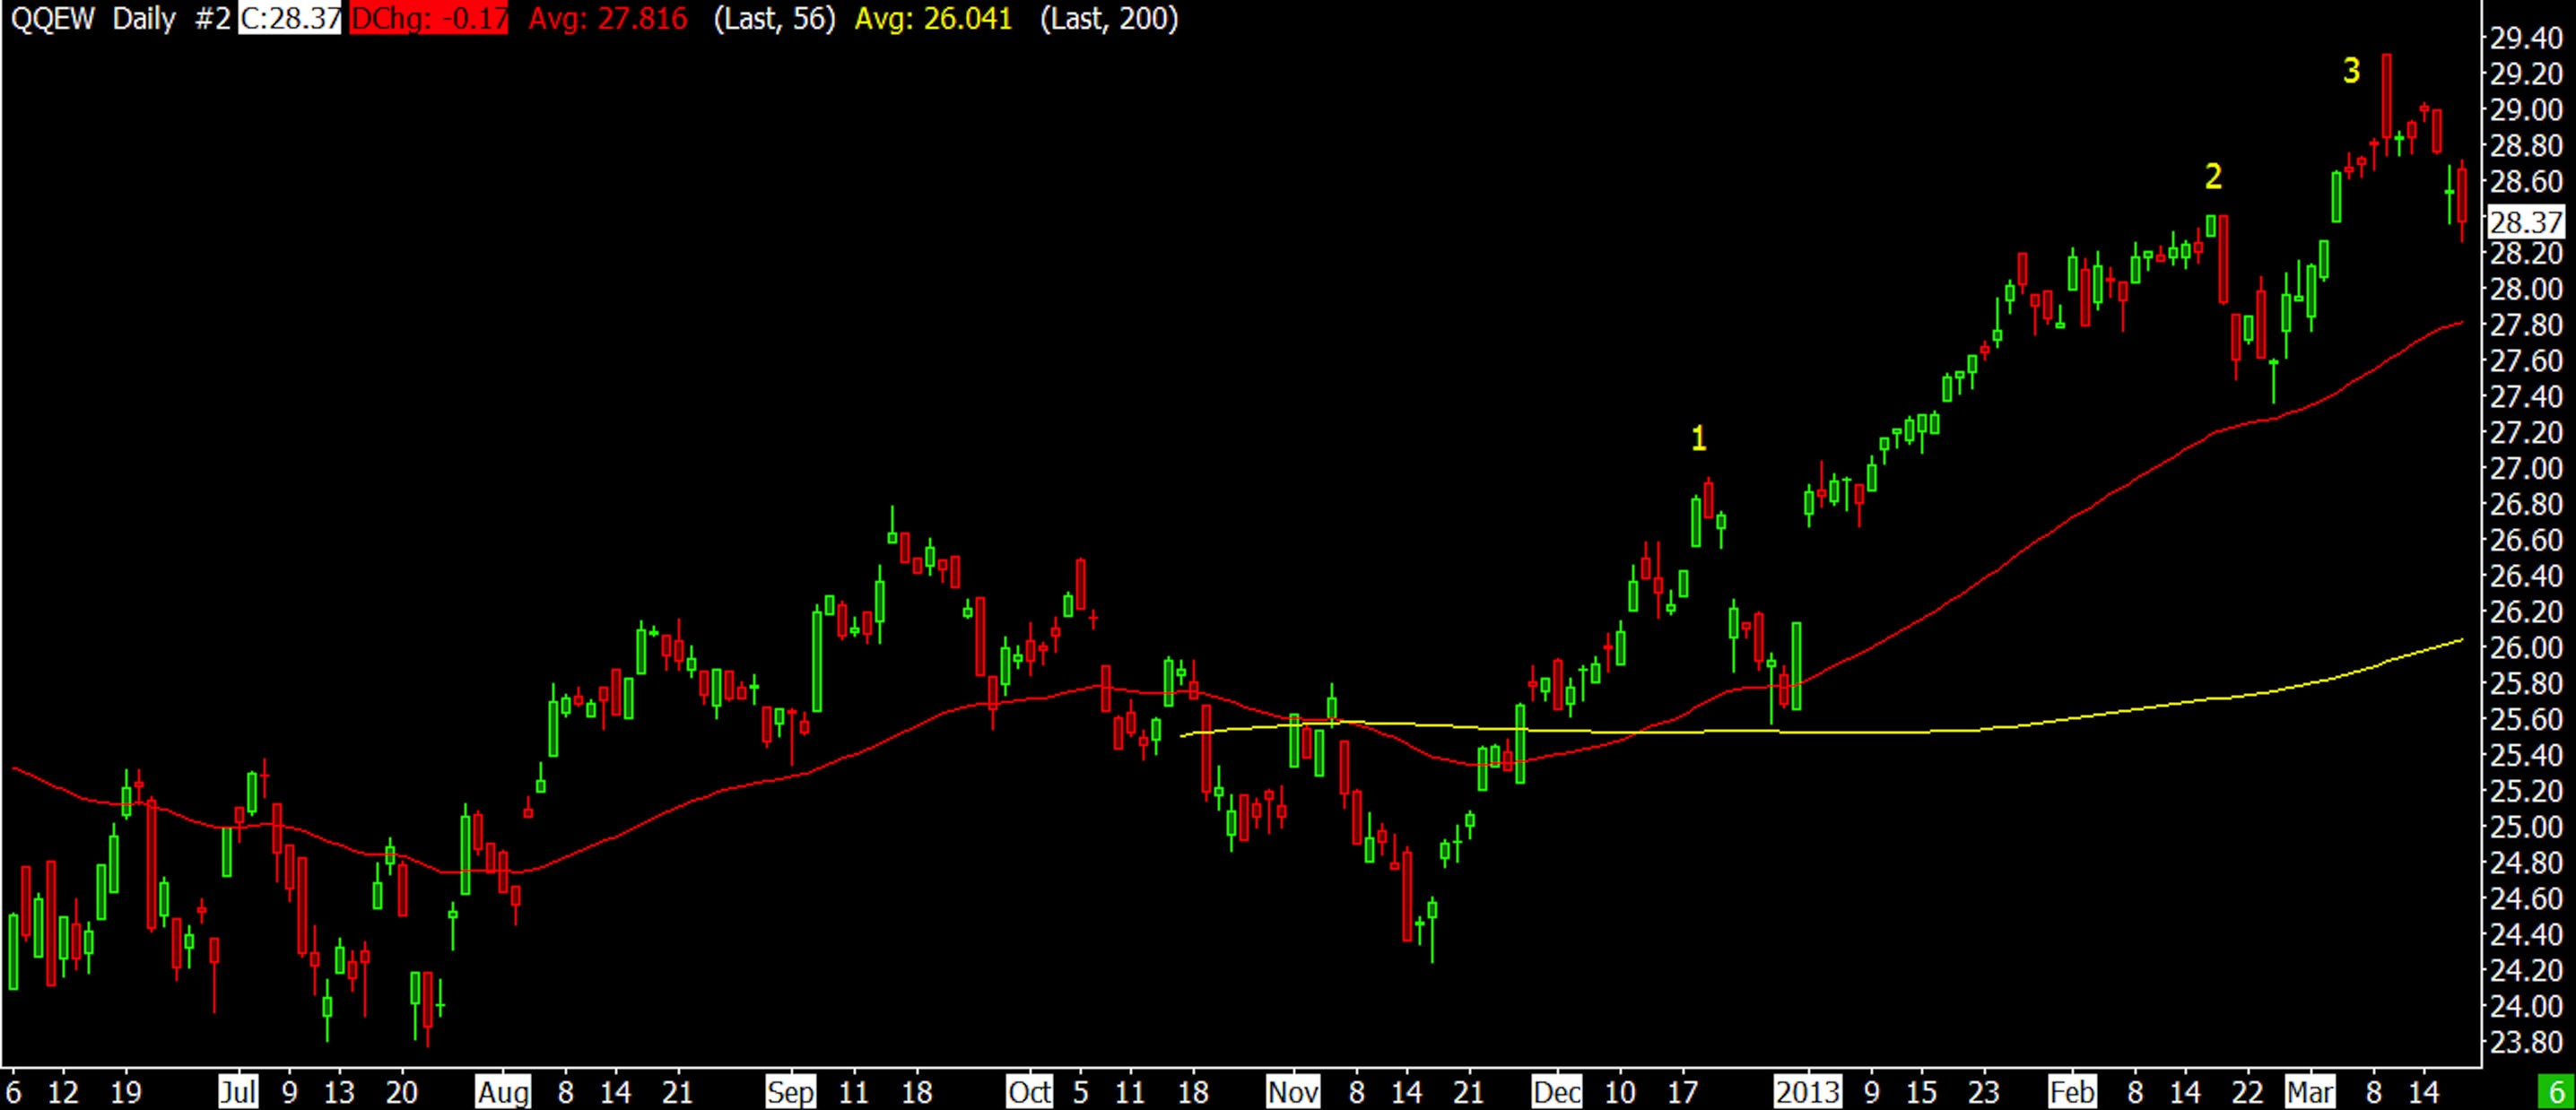
03-19-13 NADAQ COMPOSITE EQUAL WEIGHT DAILY
The SOX is often a leading index and it shows 3rd step is likely finished.
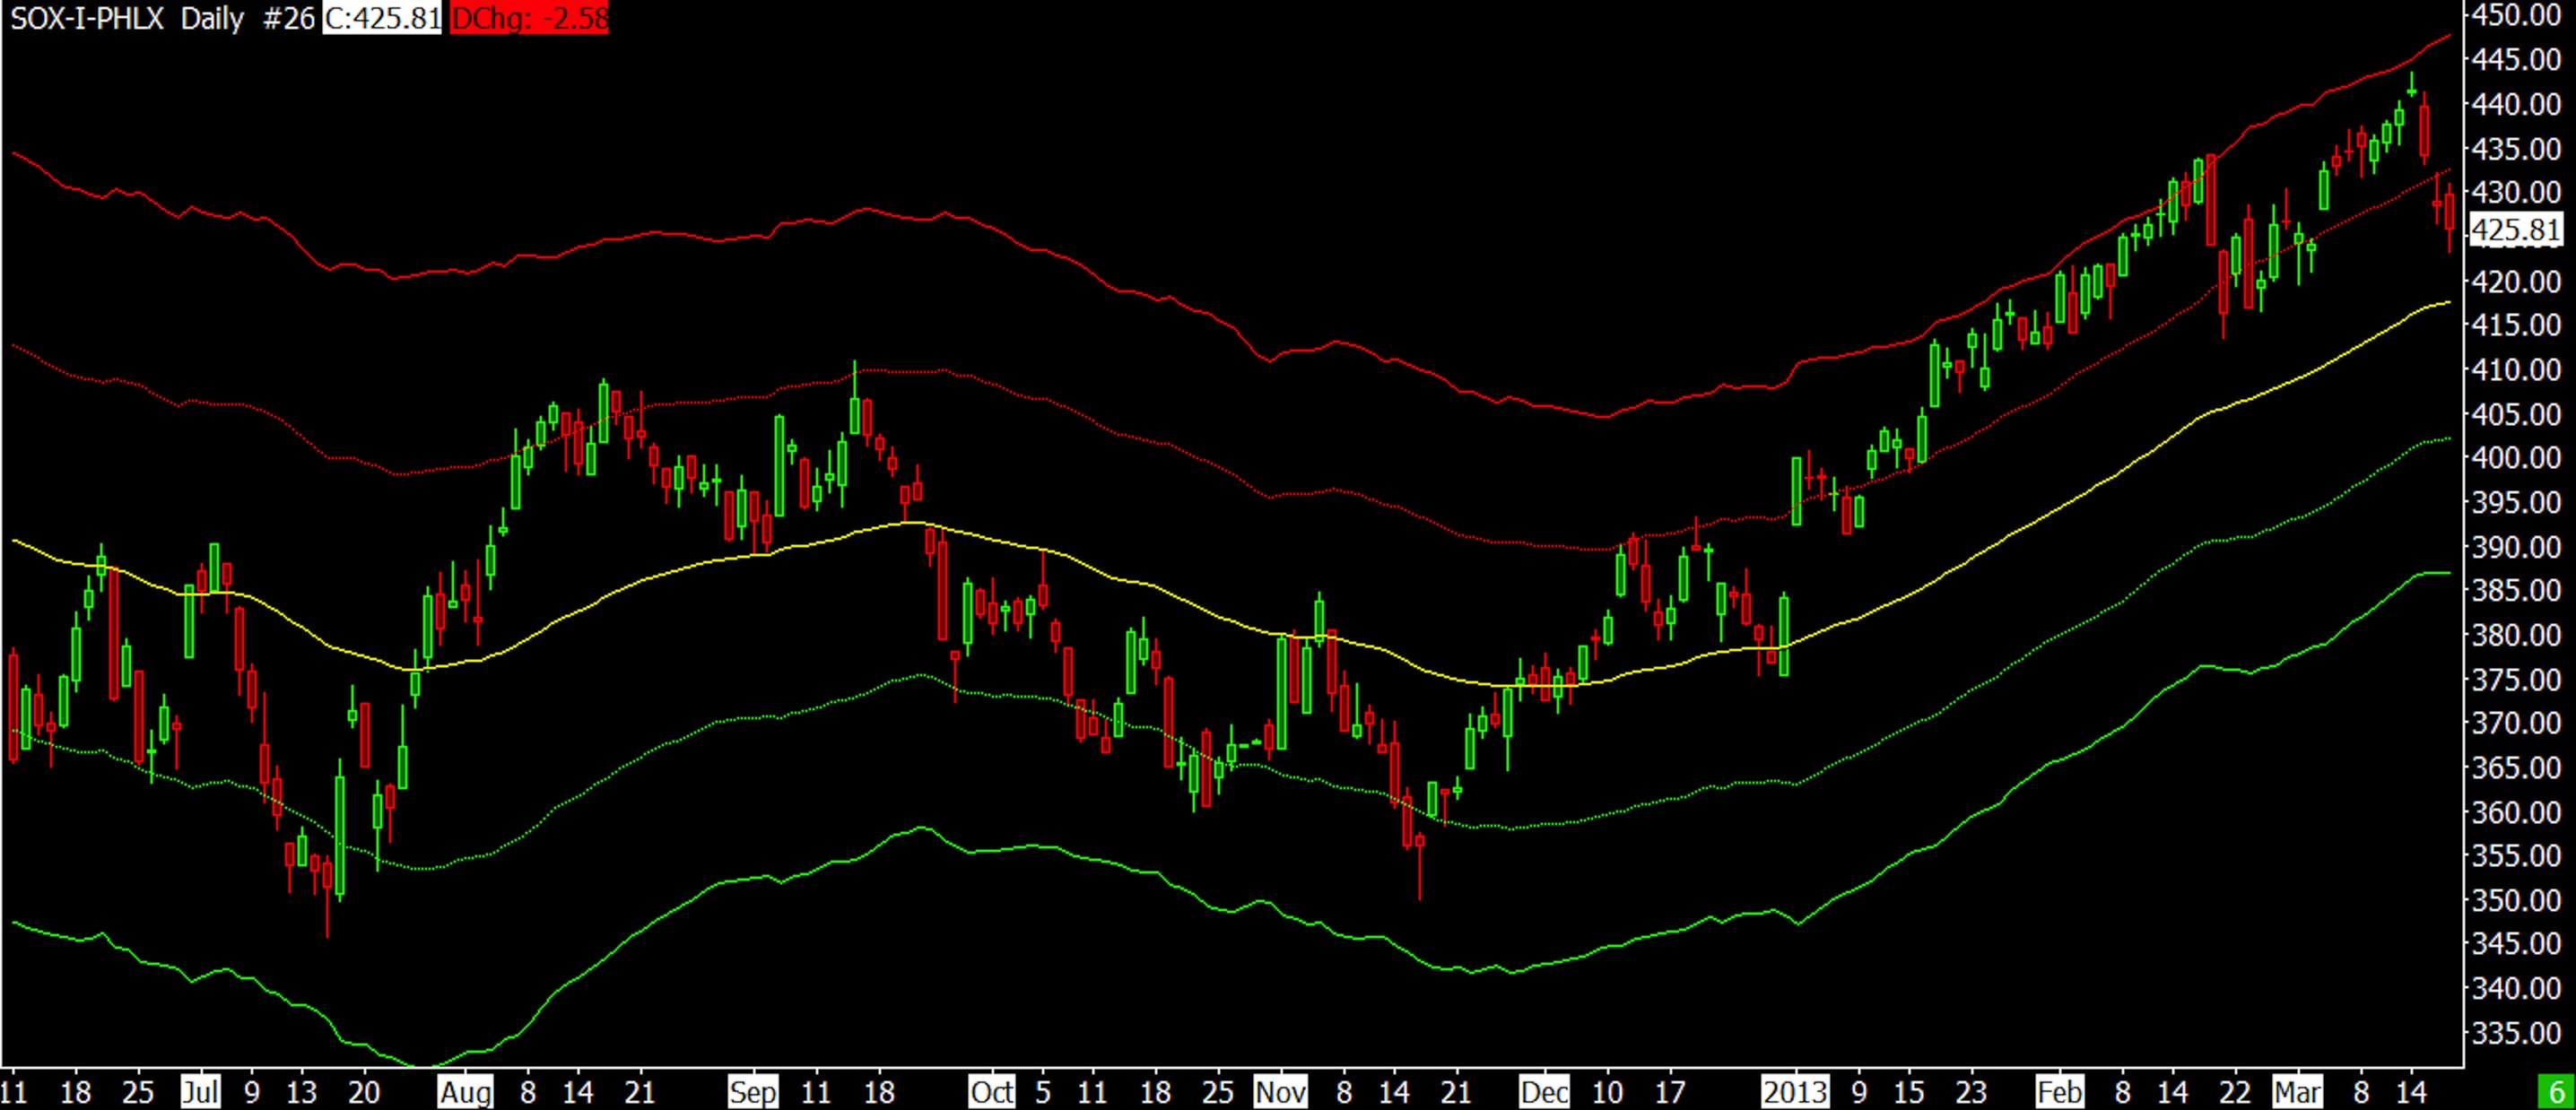
03-19-13 SOX DAILY
BUT the DJ Transports aren’t ready to decline.
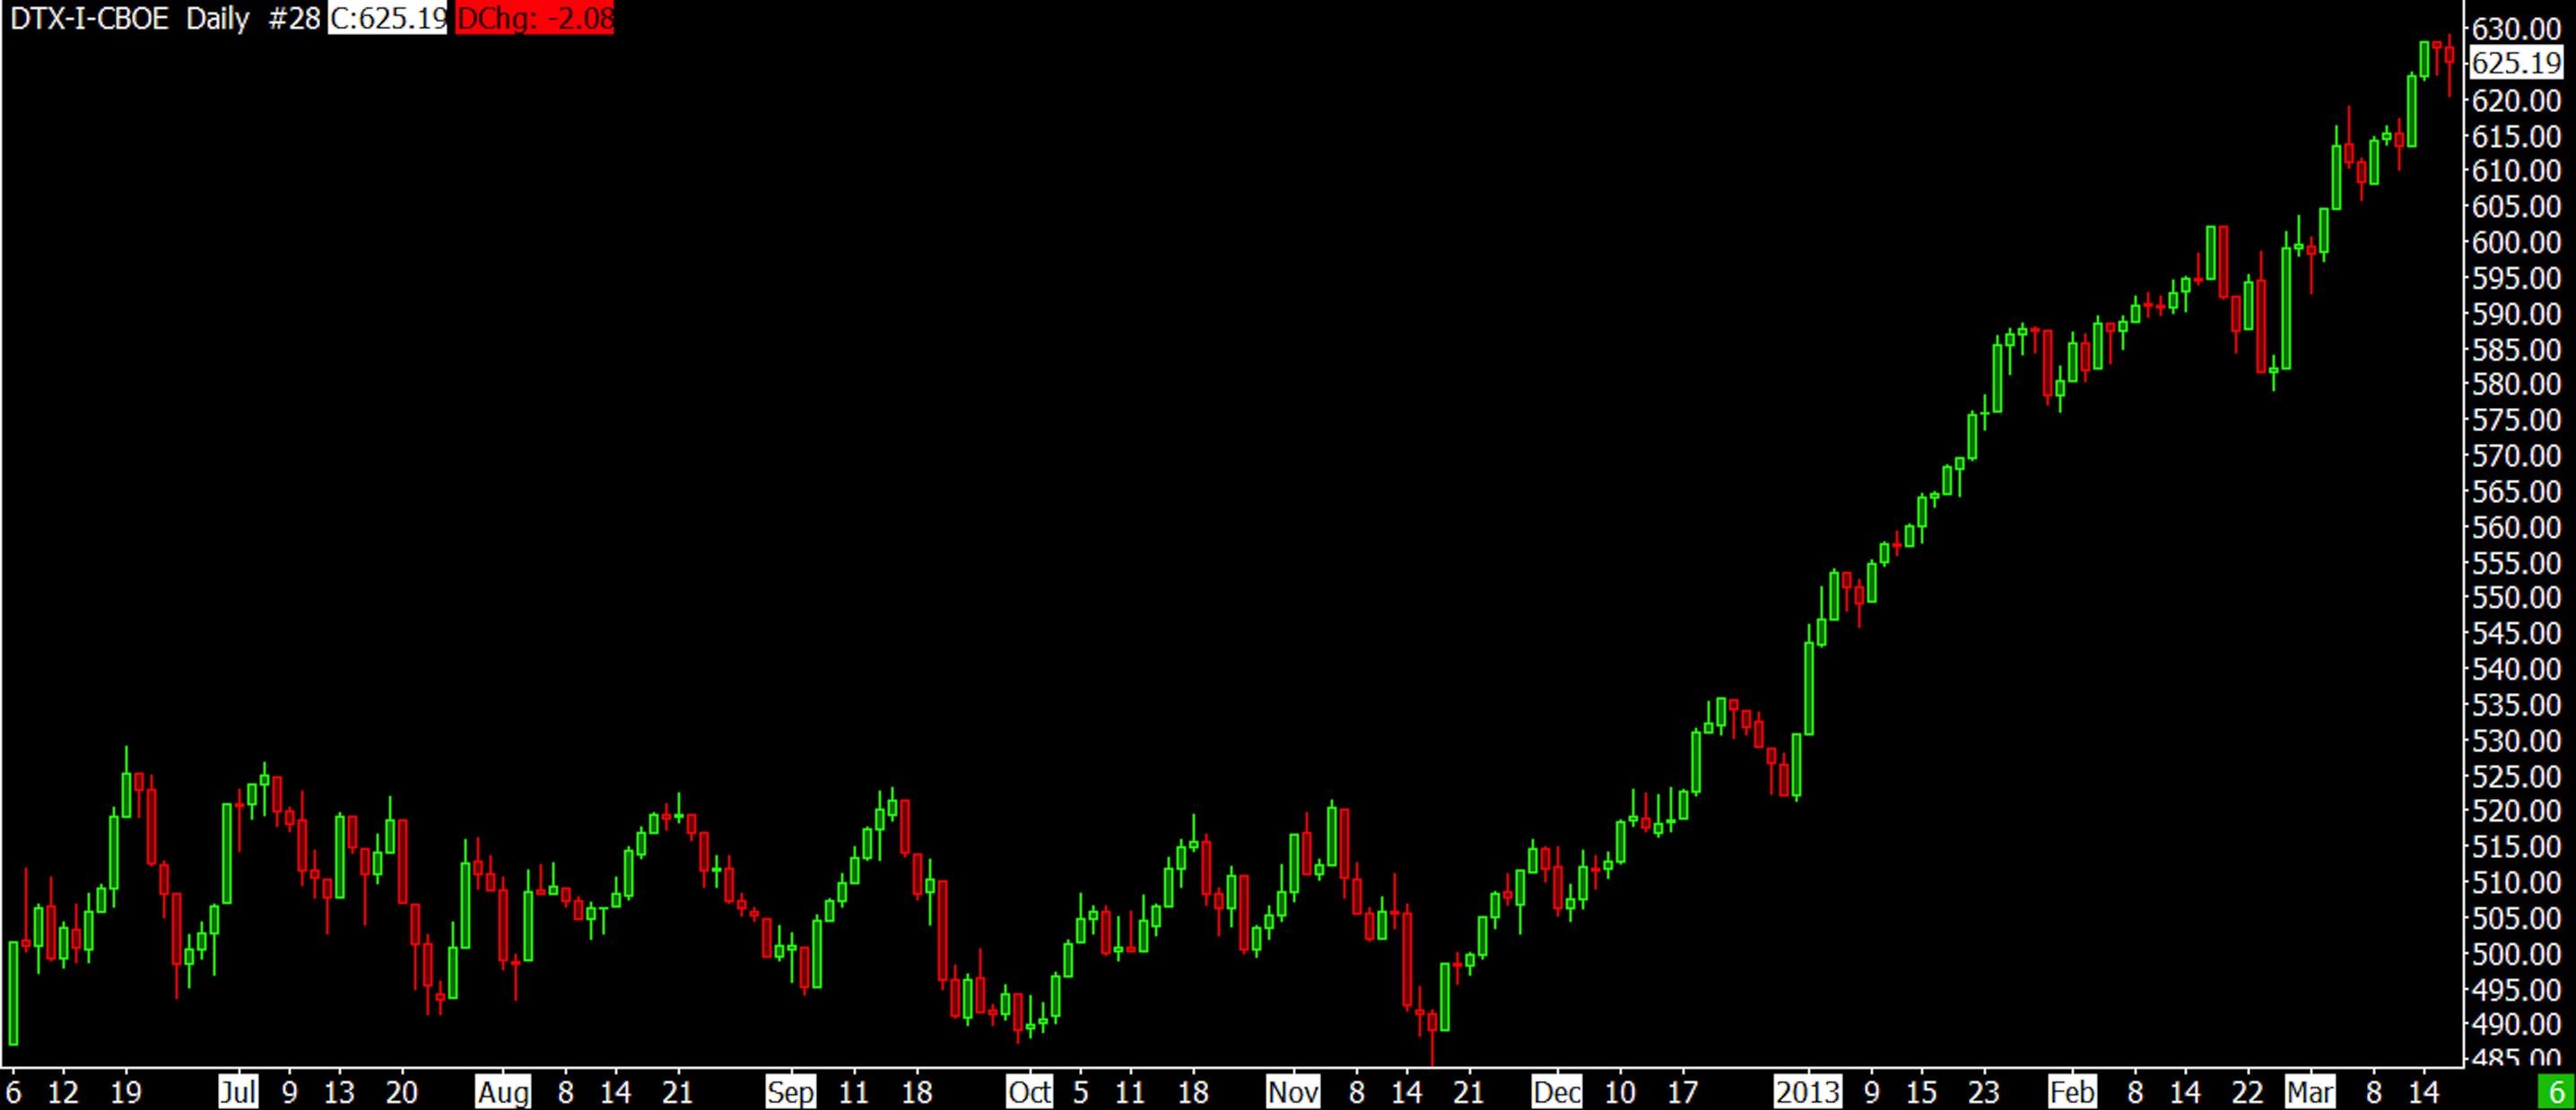
03-18-13 DJ TRANSPORTS
The following chart is the SPX with 15 minute bars. It apparently shows 2 steps up since late February 2013. The current decline has 3 steps down. Ideally the correction would be finished and we would rally into the 3rd step up. Whether we rally into 3rd step or not, we “should” have more rally here before further decline. What does transpire will tell us a lot about what the market has up its sleeve.
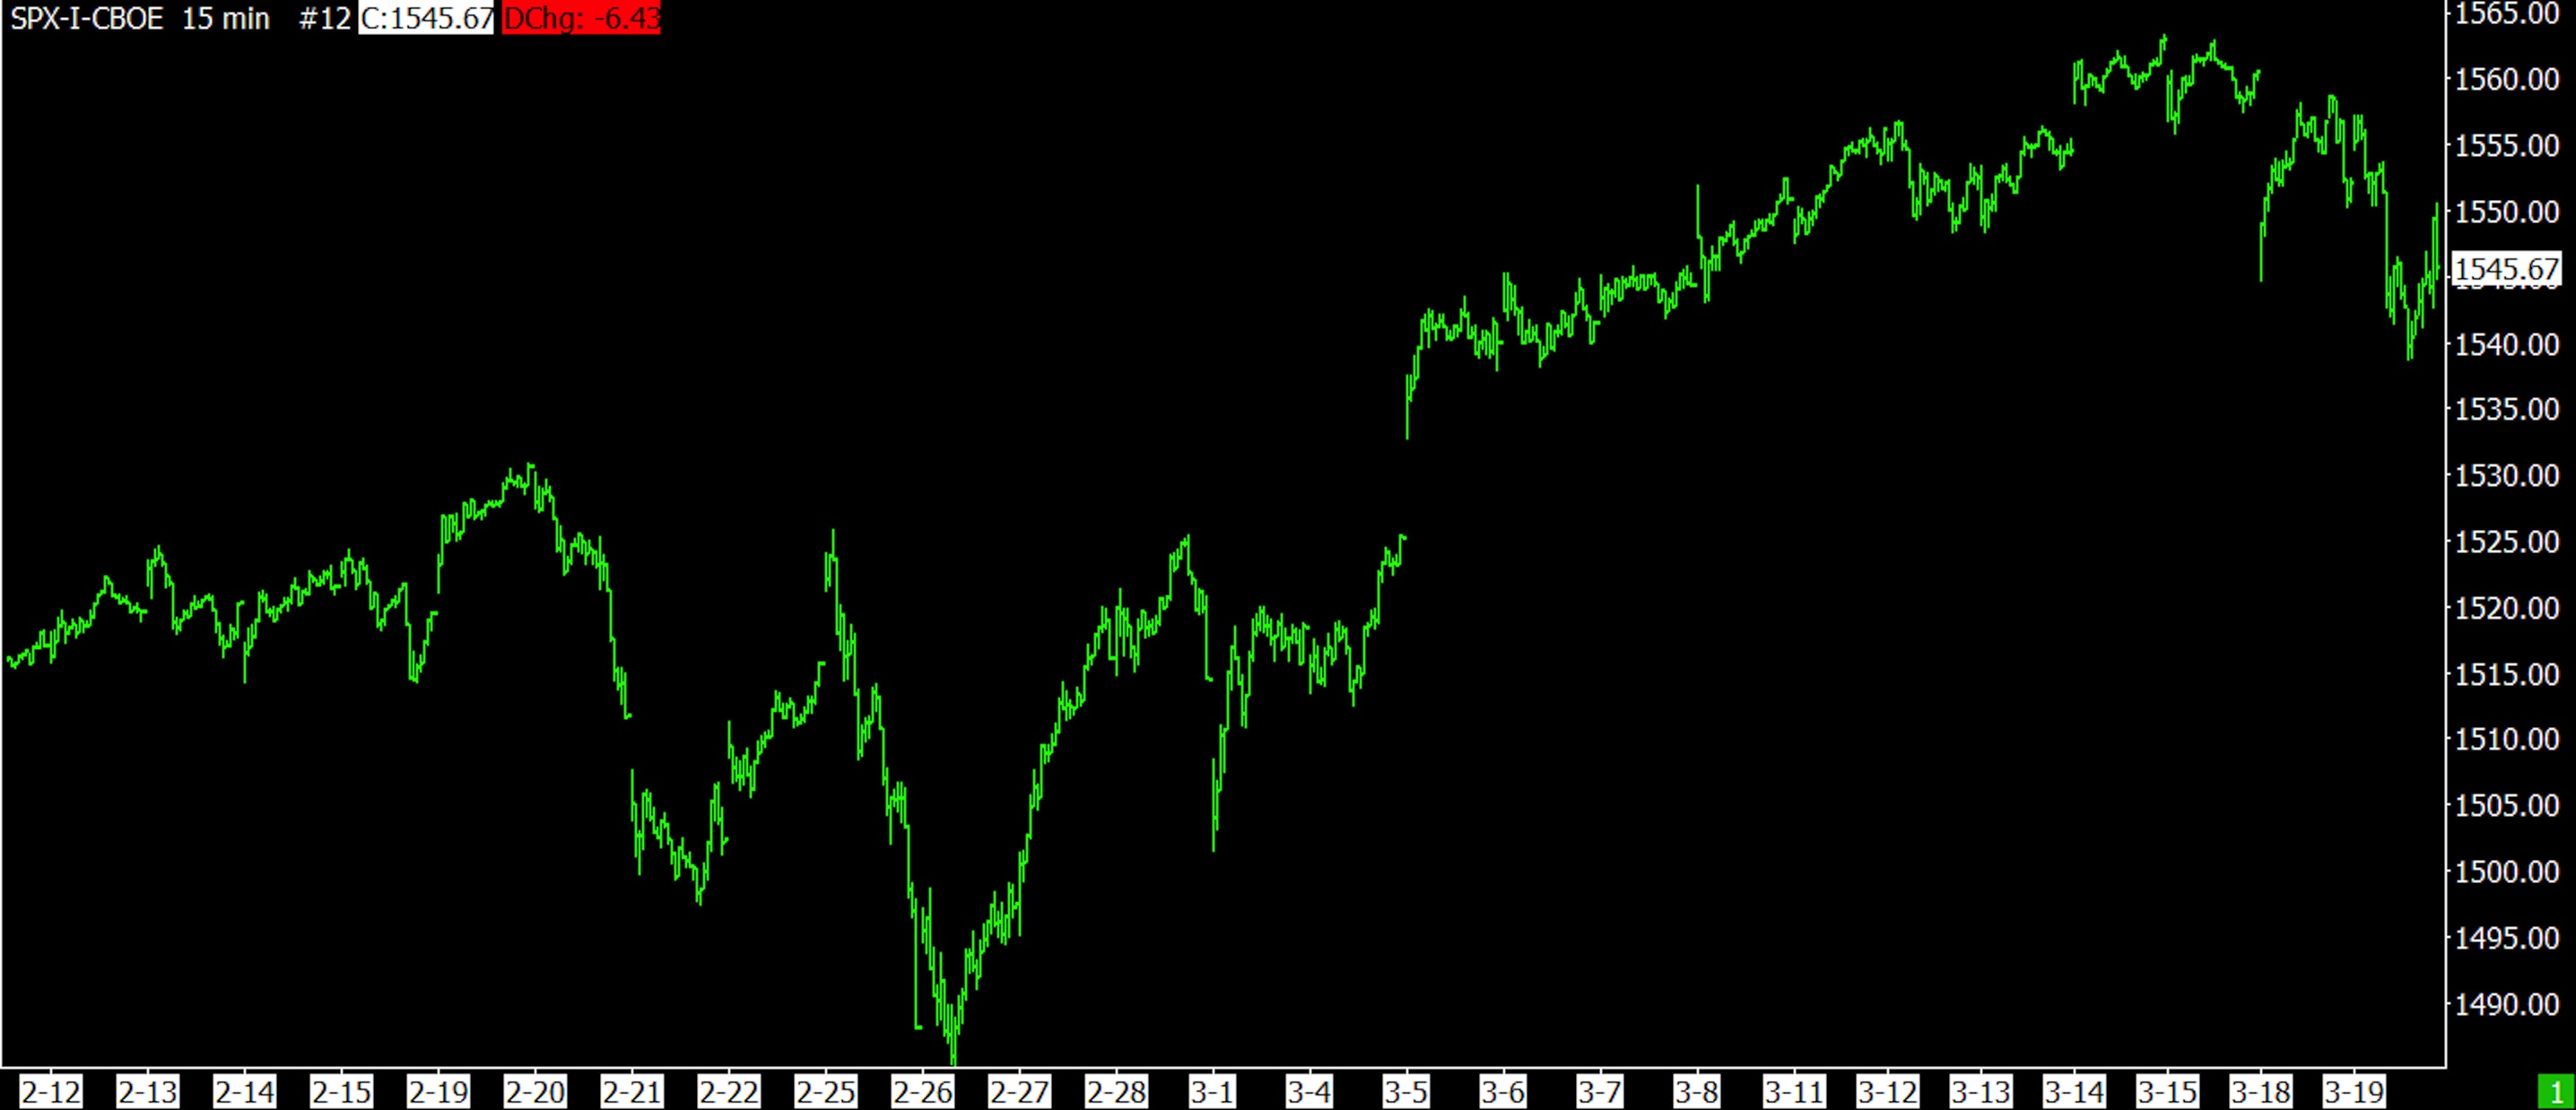
03-19-13 SPX 15 MINUTE BARS
Looking at the next chart, which was created at the Tuesday close, shows the possibility of one more small step down. If this last step ends near or above the prior low, the stage could be set for further rally (step 3 ???). If we don’t have the last step down, would that mean that we have resumed the 2 step down corrections???? Either that or a miscount of the steps.
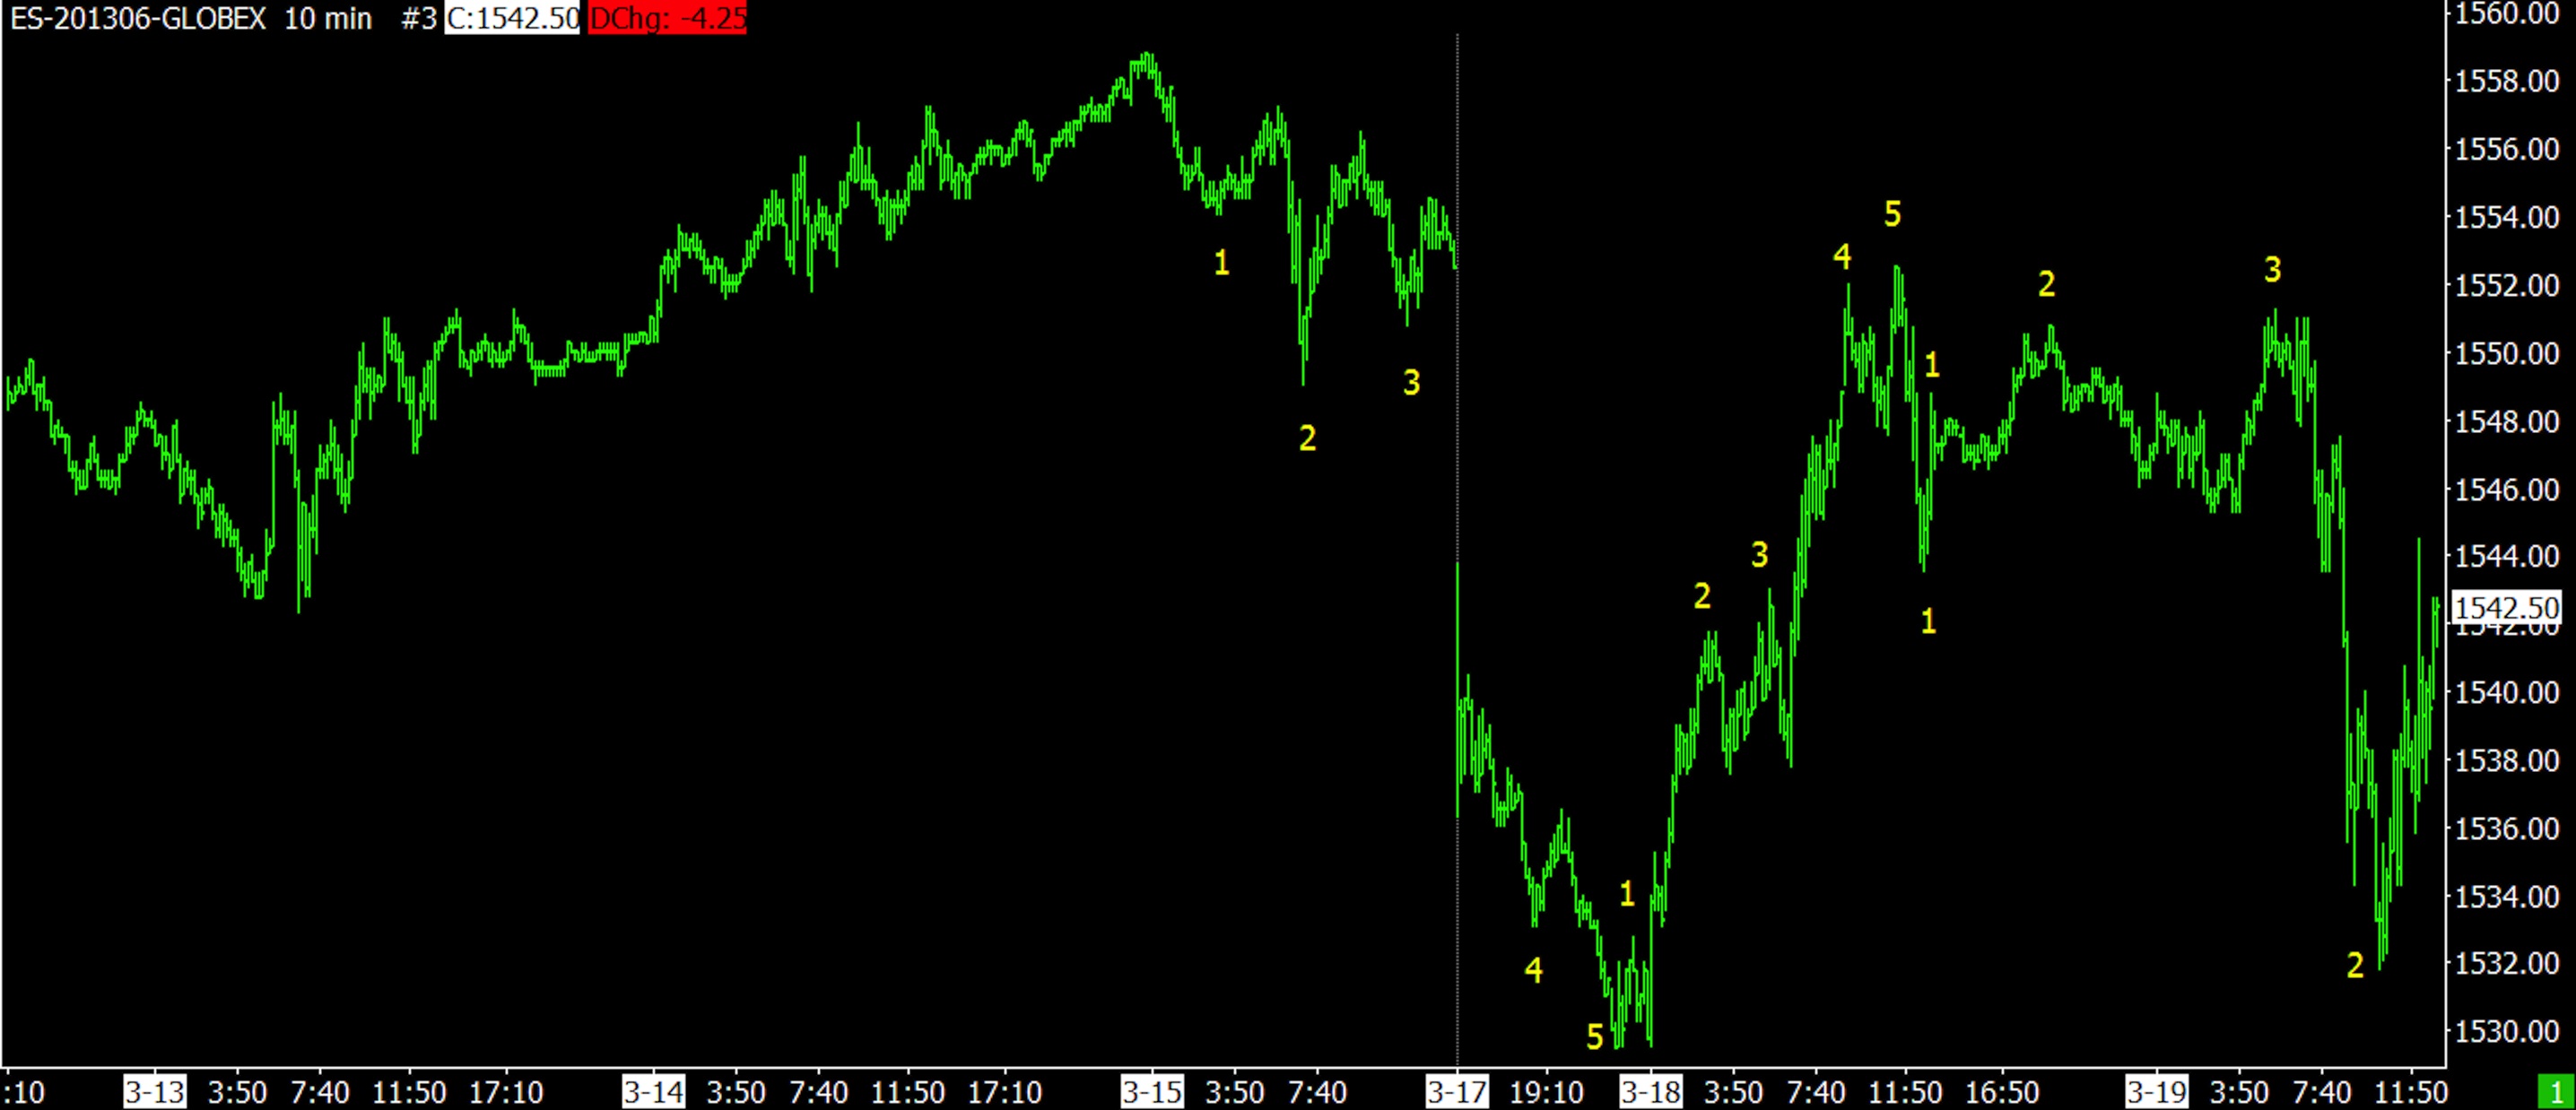
03-19-13 SPX 10 MIN BARS AT TUE CLOSE
Anytime you want to see an updated version of one of these charts, just let me know. Leave a comment indicating the date and name of the chart. Without name and date, I might not know which chart you want to see.
It’s nice to see from some of the comments that a few of you really get this method of wave counting. You will become the future torchbearers.
There are more secrets to reveal. One is a an unemotional method of displaying an index. Indexes are prone to wild displays of euphoria with gaps up or down. Long ago I wanted to chart an index without all the attitude. It’s possible and it only takes a little thought to see the way how. I have charted the DJ Industrials back to the early 1930s using this method (that was a LOT of work). This method often leads a life of its own, but I believe it shows underlying pressure on the market. Depending on the index it can be predictive for bull market peaks.
- ————————————————————————————————
- Click on any picture or chart to enlarge it
All Rights Reserved © ™
