 06/30/14 . . . by Bob Karrow
- My charts were completely revamped during the month of June and minor alteration are still underway. If you haven’t seen them recently, make sure and take a look. My charts consist of all the items that Paul Desmond warned about in his paper, “THE WARNING SIGNS OF MAJOR MARKET TOPS”.
WAVE COUNTS
- If you aren’t familiar with my unorthodox wave counting method, there is a simple explanation at the beginning of the glossary. The glossary also contains lots of other details (explanations) that don’t appear in the blog.
TWEETS
T-THEORY ®
- A lot of visitors to my blog are looking for information on T-Theory ®. The below link will take you to the index of all of Terry’s comments during the period Dec 2003 to June 2011. There are a considerable amount of charts and audio material from Terry Laundry in this section.
- If you are looking for the ability to make your own predictions using T-THEORY ®, I would highly recommend Terry’s encyclopedia on T-THEORY ®
- Order the T Theory® Encyclopedia from Paula at this link
—————————————————————————————
- SSI INDICATORS
The following section is devoted to my super secret indicator and what’s been happening lately with the indictor. But first a little history on the indicator.
- 1939 to present – Dow Jones Industrials

DJI Price – 1939 To 06:27:14
- 1939 to present – DJ Industrials SSI

DJI SSI – 1939 TO Present
The left edge of the above two charts shows the final bottom of the bear market that began in 1929. 3rd step down ended in June 1942 with the WW II Battle of Midway (Midway Island June 7, 1942). Check the history of this battle if you aren’t familiar with it because it’s very interesting. This single battle made Wall Street believe that the war in the Pacific against Japan was going to be won by the USA. This assumption was based on the fact that Japan lost 4 aircraft carriers in the battle of Midway and the US lost only 1 carrier (this happened 6 months after Pearl Harbor) and Japan’s ability to replace carriers could never keep up with the US factories.
The middle period of the chart where the SSI is going down was 1965 to 1974. This period was marked by 3 price declines ending in late 1974. This period was a full fledged bear market, which was confirmed by the SSI.
The chart of the SSI shows that since 1974, we have been in one very long continuous bull market. It has been interrupted only by small corrections in the SSI. The SSI shows no ongoing or lengthy bear markets occurring since 1974, minor corrections yes, but no bear markets.. Now the price chart since 1974 tells an entirely different story. It shows 2 very significant bear markets since 2000. Both of these bear markets are simply blips in the SSI’s long term up since 1974. The SSI can lead an independent life from prices and this is a good example of that process.
How long can the rise continue in the SSI? 1982 to 2000 is 18 years. 2000 was a significant event because it was the peak of euphoria in the market. Adding 18 to 2000 is 2018. 2018 is a possibility for the ending of the bull market that began in 1982. So for now, 2018 is a theoretical end point of the bull market that began in 1982. The emphasis is on theoretical.
An interesting comment about the 36 year cycle is that 1965 minus 36 equals 1929. Interesting. 1965 plus 36 equals 2001. Kinda missed that one by one year, but that’s close enough for government work.
One possible explanation for the aberrant SSI behavior is that since 1982, the SSI may undergo 5 steps up before rolling over into a visible bear market. Presently, it looks like we are in the 4th step up.
Looking at the bull market from 1942 to 1965, you can see that period had 5 steps up to 1965. So there is historical precedent for the SSI bull market having 5 steps up.
Looking at the 1974 bottom, you can see the first 2 steps up were orphans as the 3rd step (beginning in 1982) left them far behind. This is a perfect example of where step 1 and 2 are simply recovery moves and the dynamics of the bull market don’t manifest itself until step 3. This appears to be what happened on a smaller scale in the bull market since March 2009.
The big question remaining presently is what happens when the FEDs remove all QE from the economy. Twice since 2009, this was attempted, but the market stumbled badly each time. We’re on target for no more QE later this year or early next year. What will happen then????
Next is the current view of the price charts and the SSI.1 and SSI.2 for the DJ Industrials, Transportations and Utilities. This chart shows most of 3rd step up, which began in June 2011.
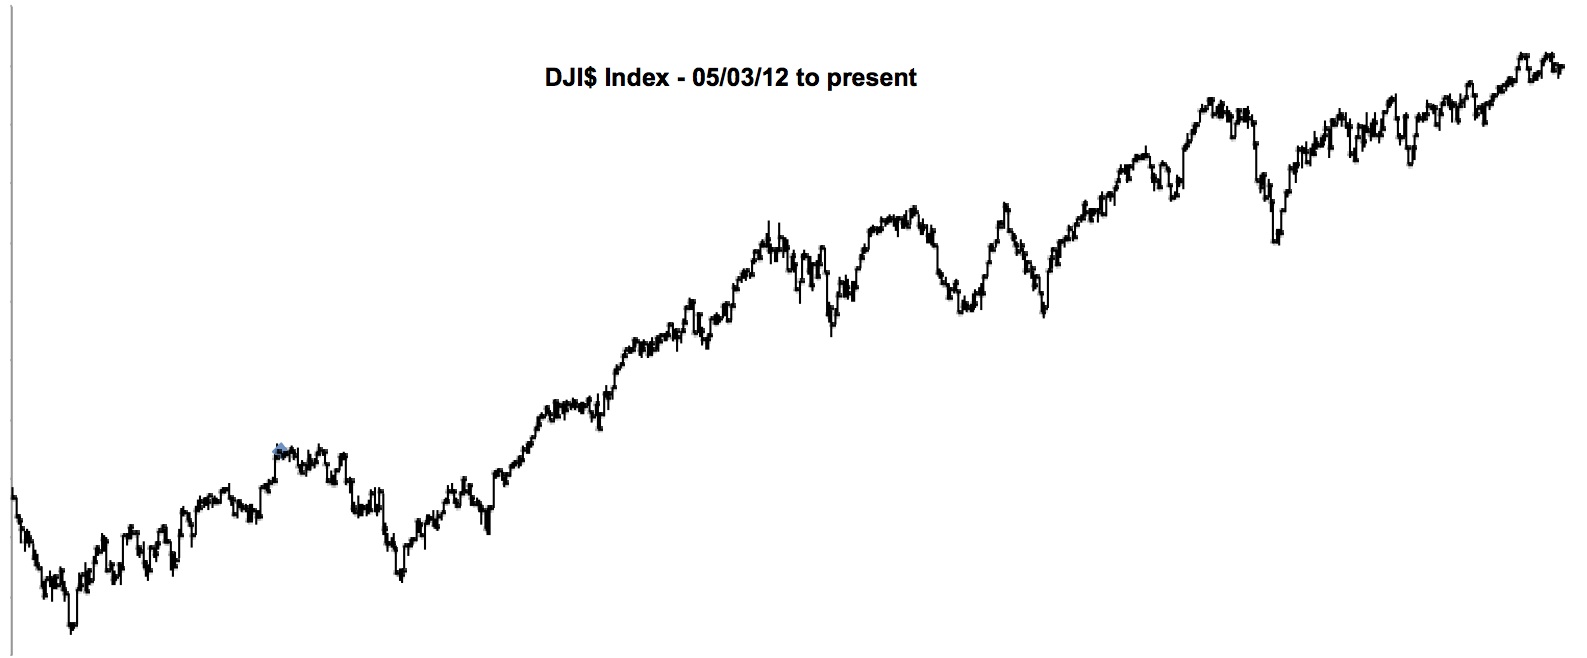
DJI$ Index – 05:03:12 to 06:28:14
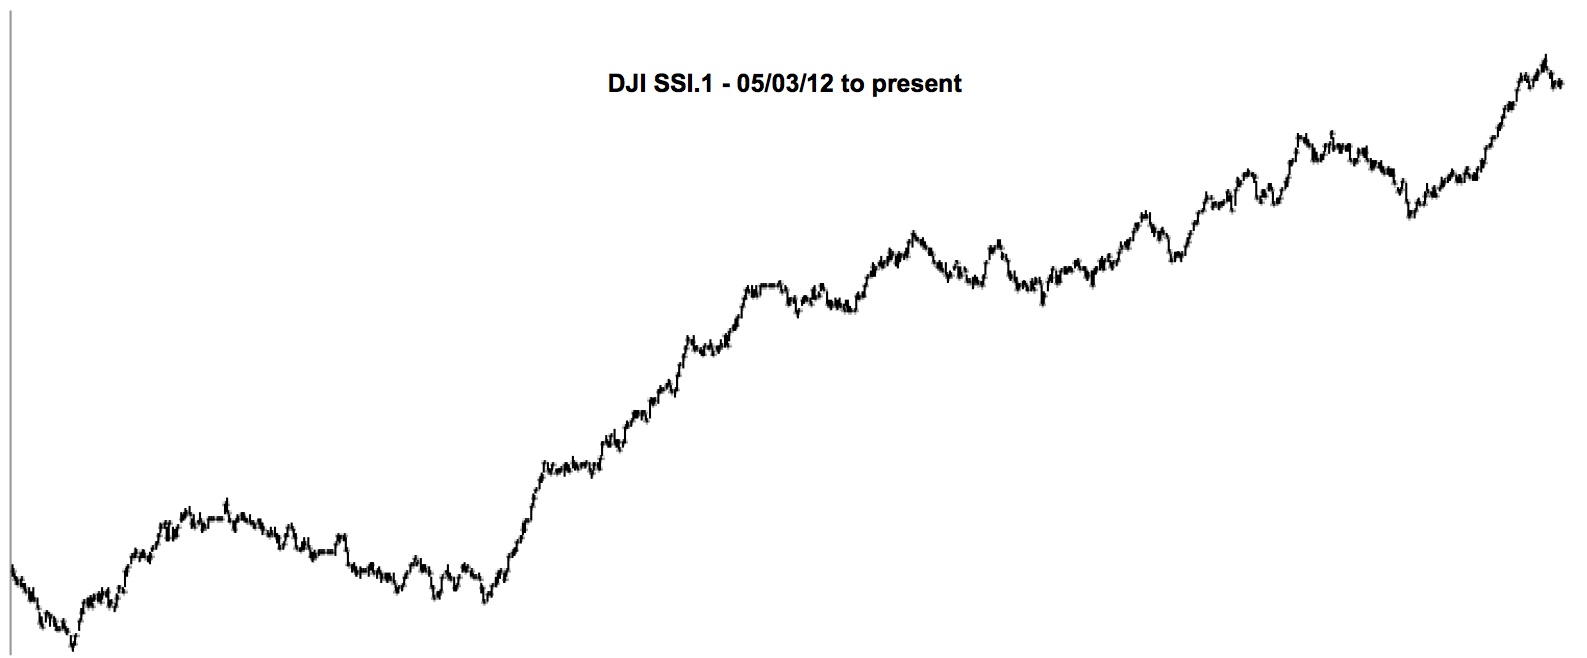
DJI SSI.1 – 05:03:12 to 06:28:14
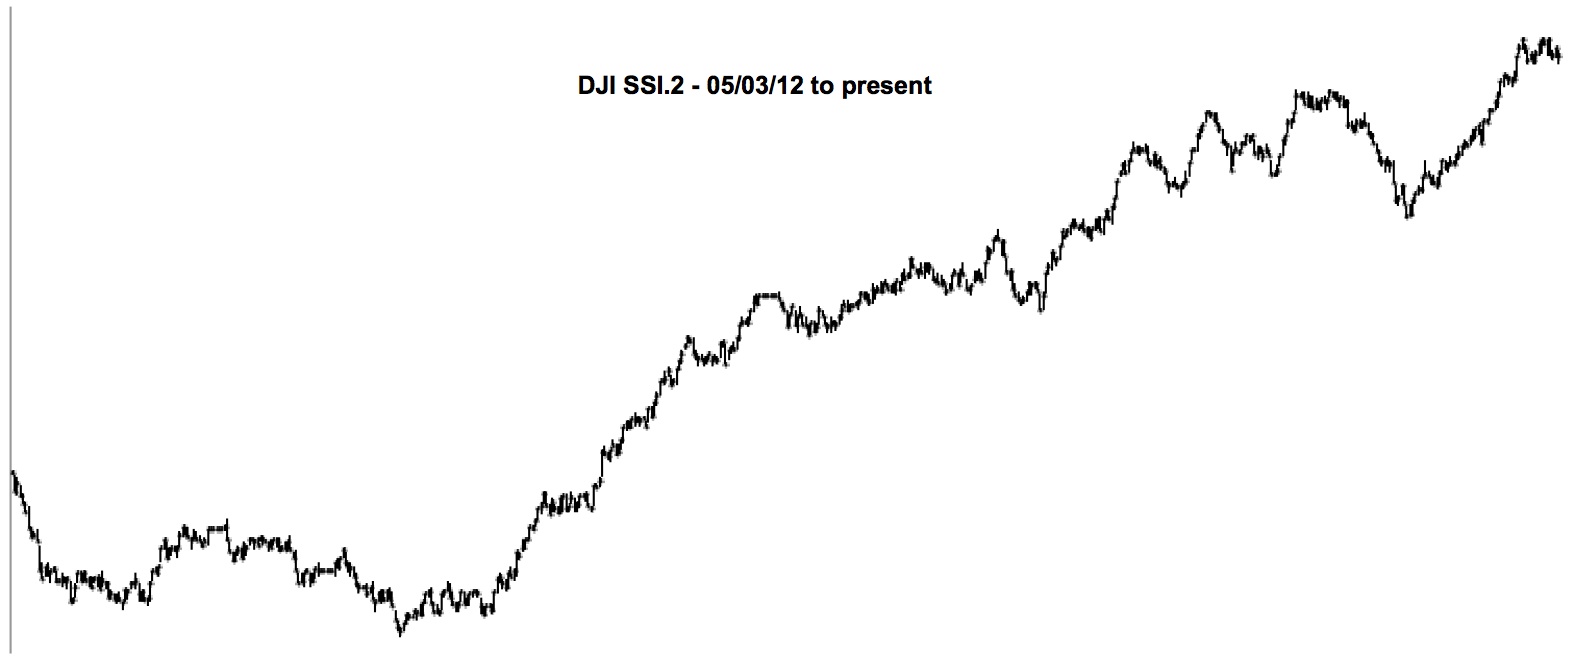
DJI SSI.2 – 05:03:12 to 06:28:14
There is a brief hesitation presently in both DJ IND SSI’s. It’s not meaningful until the hesitation lasts a significant period of time.
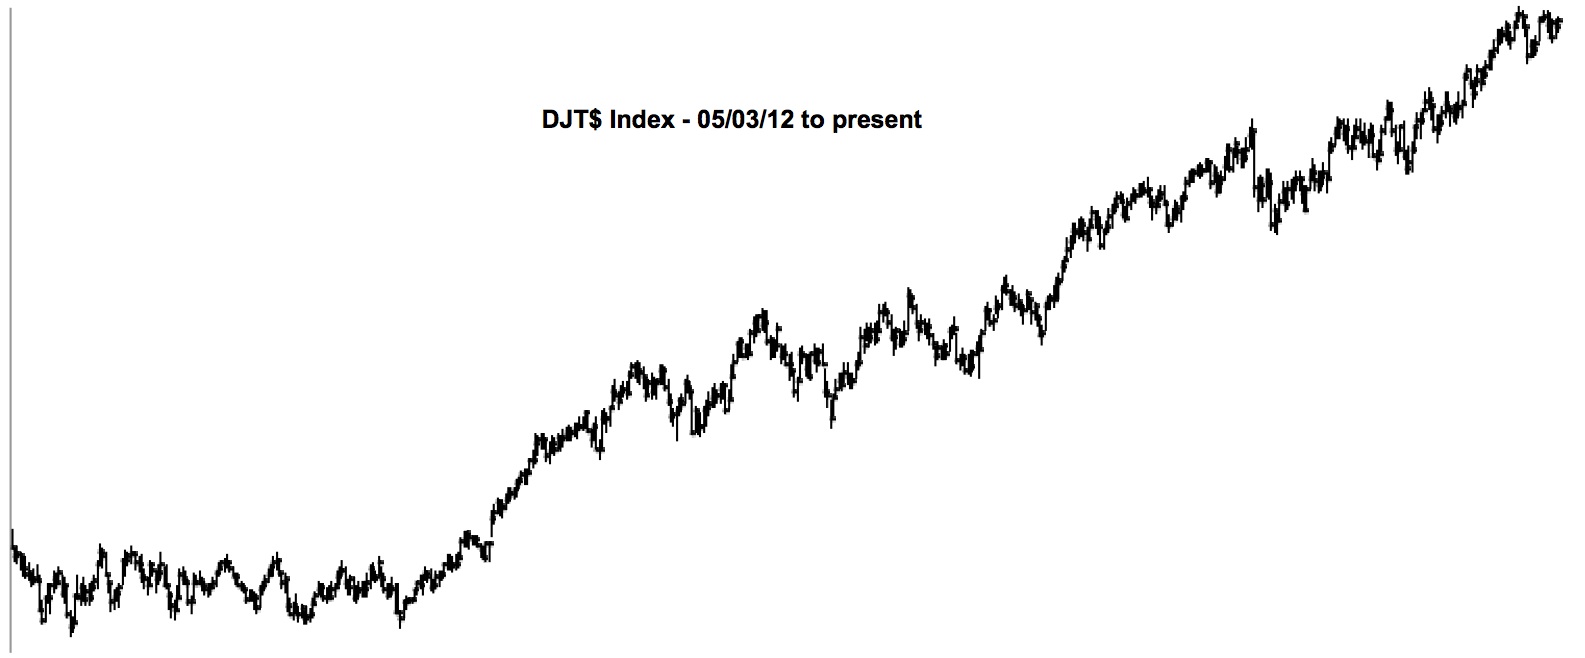
DJT$ Index – 05:03:12 to 06:28:14
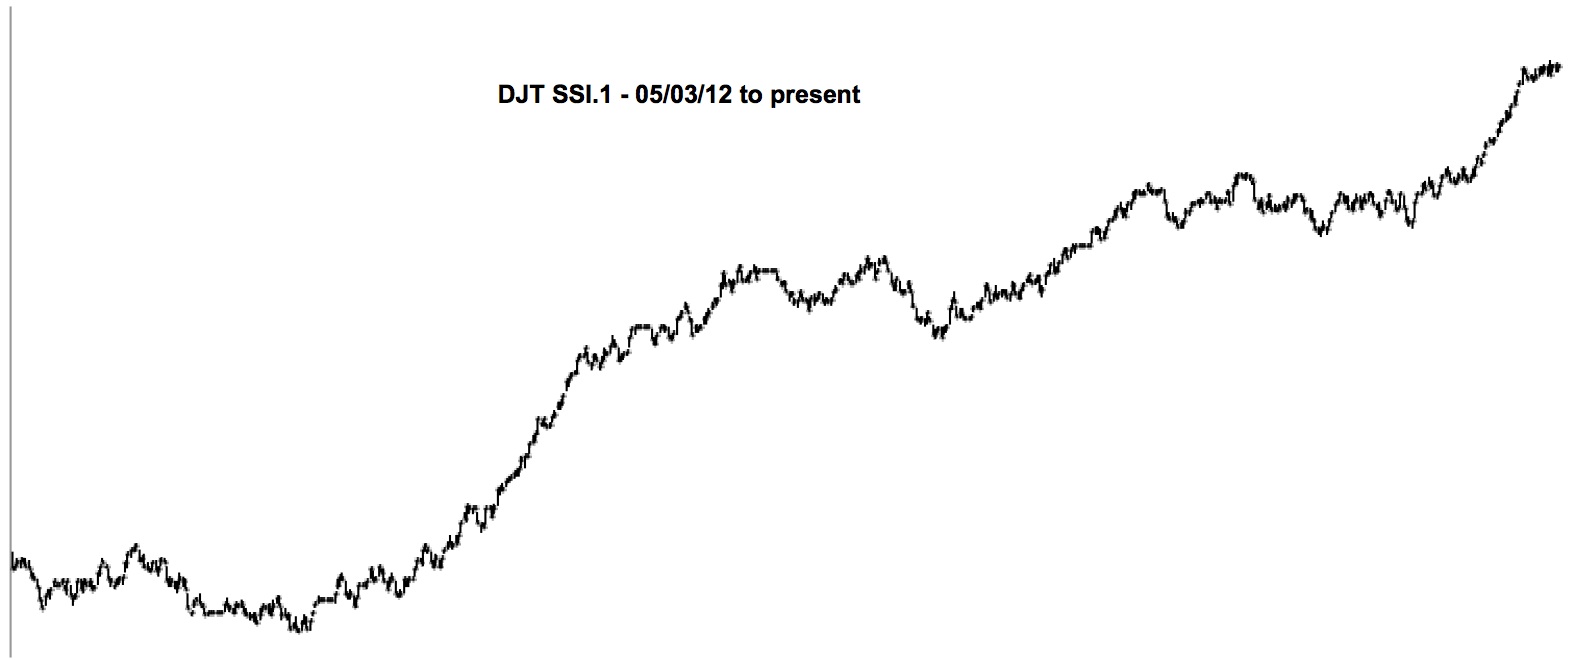
DJT SSI.1 – 05:03:12 to 06:28:14
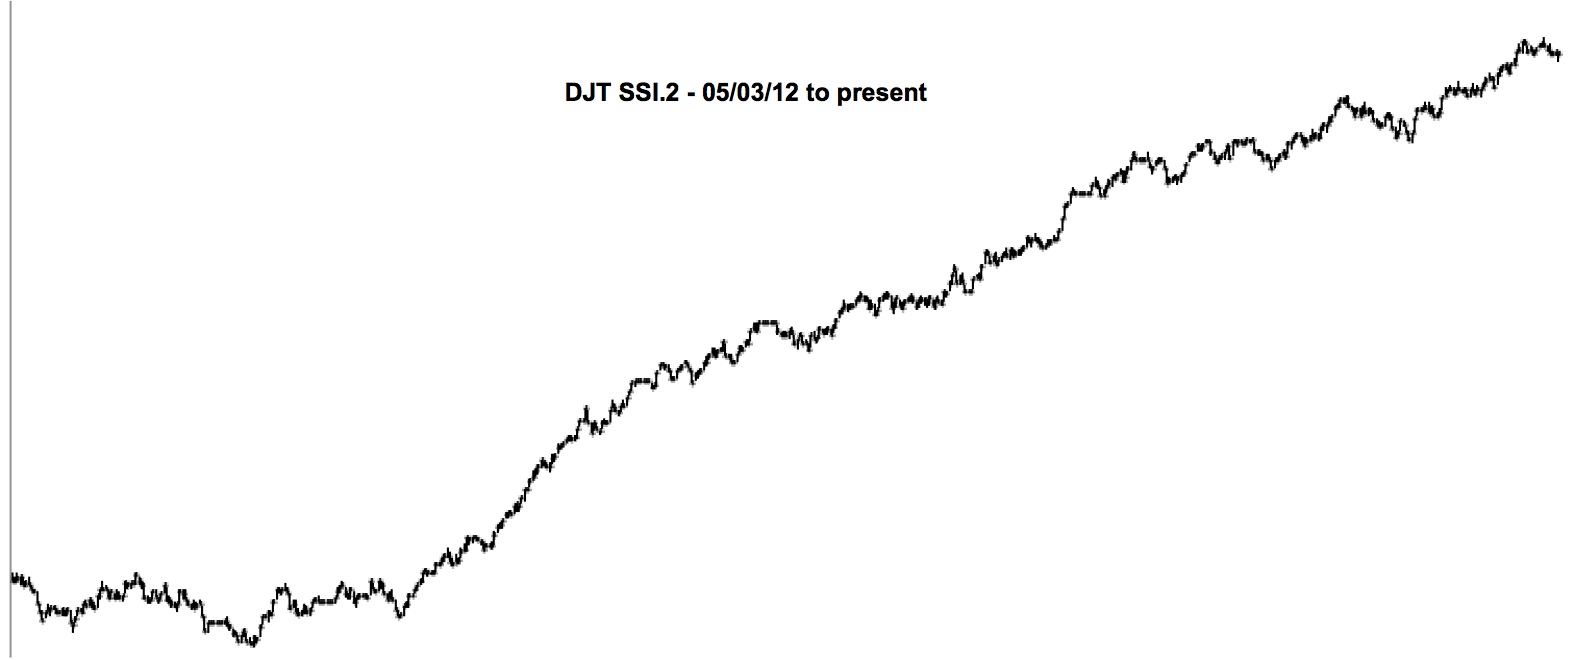
DJT SSI.2 – 05:03:12 to 06:28:14
DJ Trn SSI.2 has a brief hesitation presently, looking similar to the SSI of Industrials.
Overall, the DJI and DJT show nothing much to worry about in the SSI.
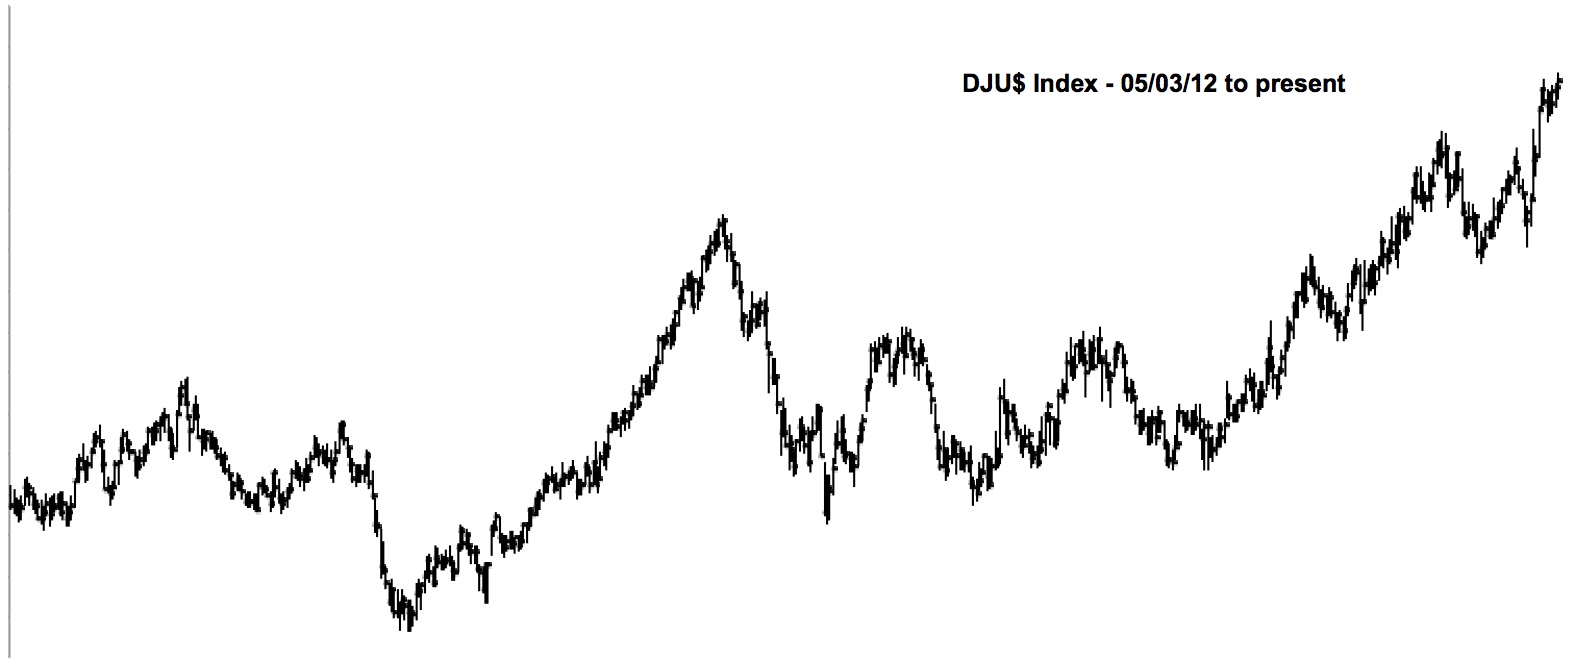
DJU$ Index – 05:03:12 to 06:28:14
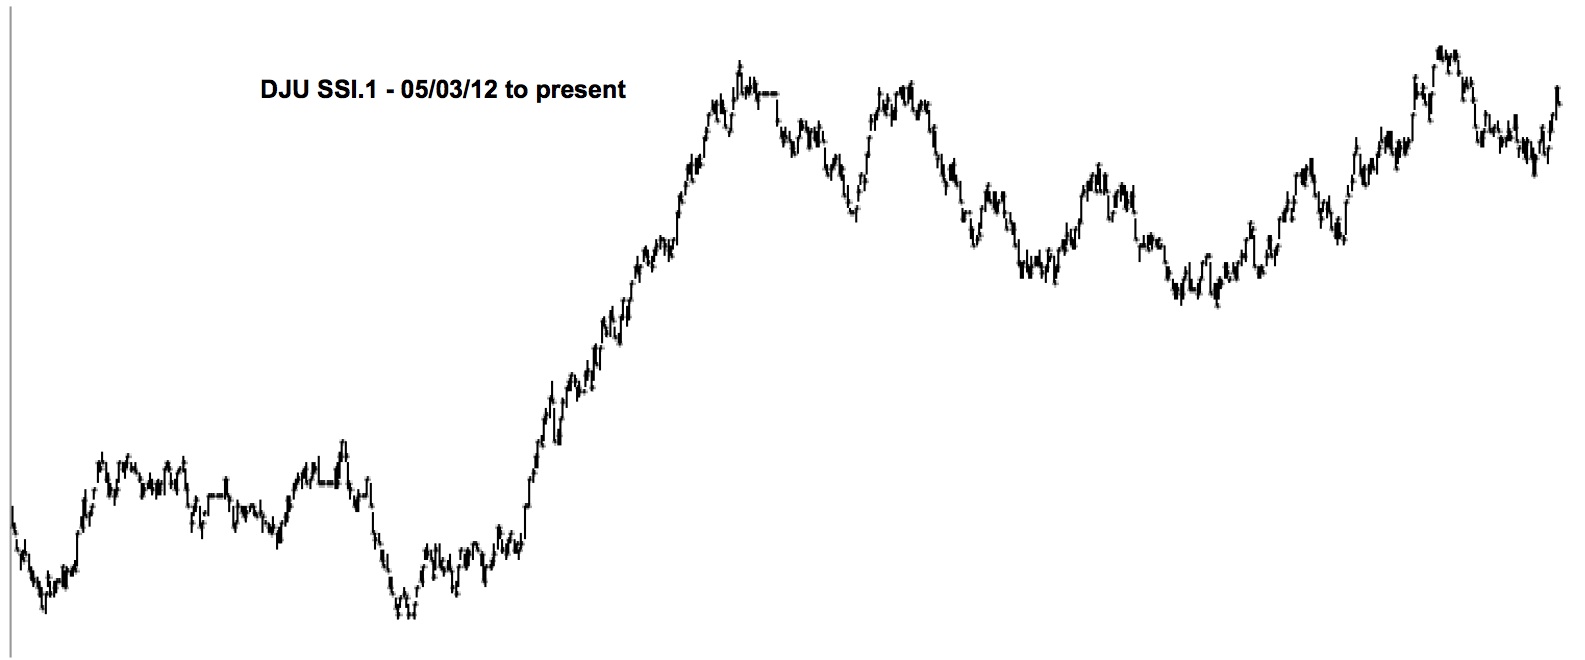
DJU SSI.1 – 05:03:12 to 06:28:14

DJU SSI.2 – 05:03:12 to 06:28:14
The DJ Utilities tell a different story presently. SSI.2 is declining while the DJ Utl prices are rising. SSI.1 is unwilling to confirm the new price high in the utilities. So there is some trouble brewing in the utilities.
I think before we have a major correction like 2008 we should see a decline in one of the SSI’s for Ind or Trn. Presently that isn’t in the immediate future. I would expect to see more volatile corrections as we approach the end of this bull market. Look at February 2007 and July 2007 and you will see what I would expect. The only kicker is that in 1929 we never had any volatility warnings, we failed to make a new high for several months prior to the market break, but there were no volatile correction preceding Oct 1929. So there is precedent for lack of volatility prior to a market peak, but it’s not the historical norm.
This doesn’t mean we can’t experience a 10% correction along the way towards a market top.
—————————————————————————————
- HURST CYCLES
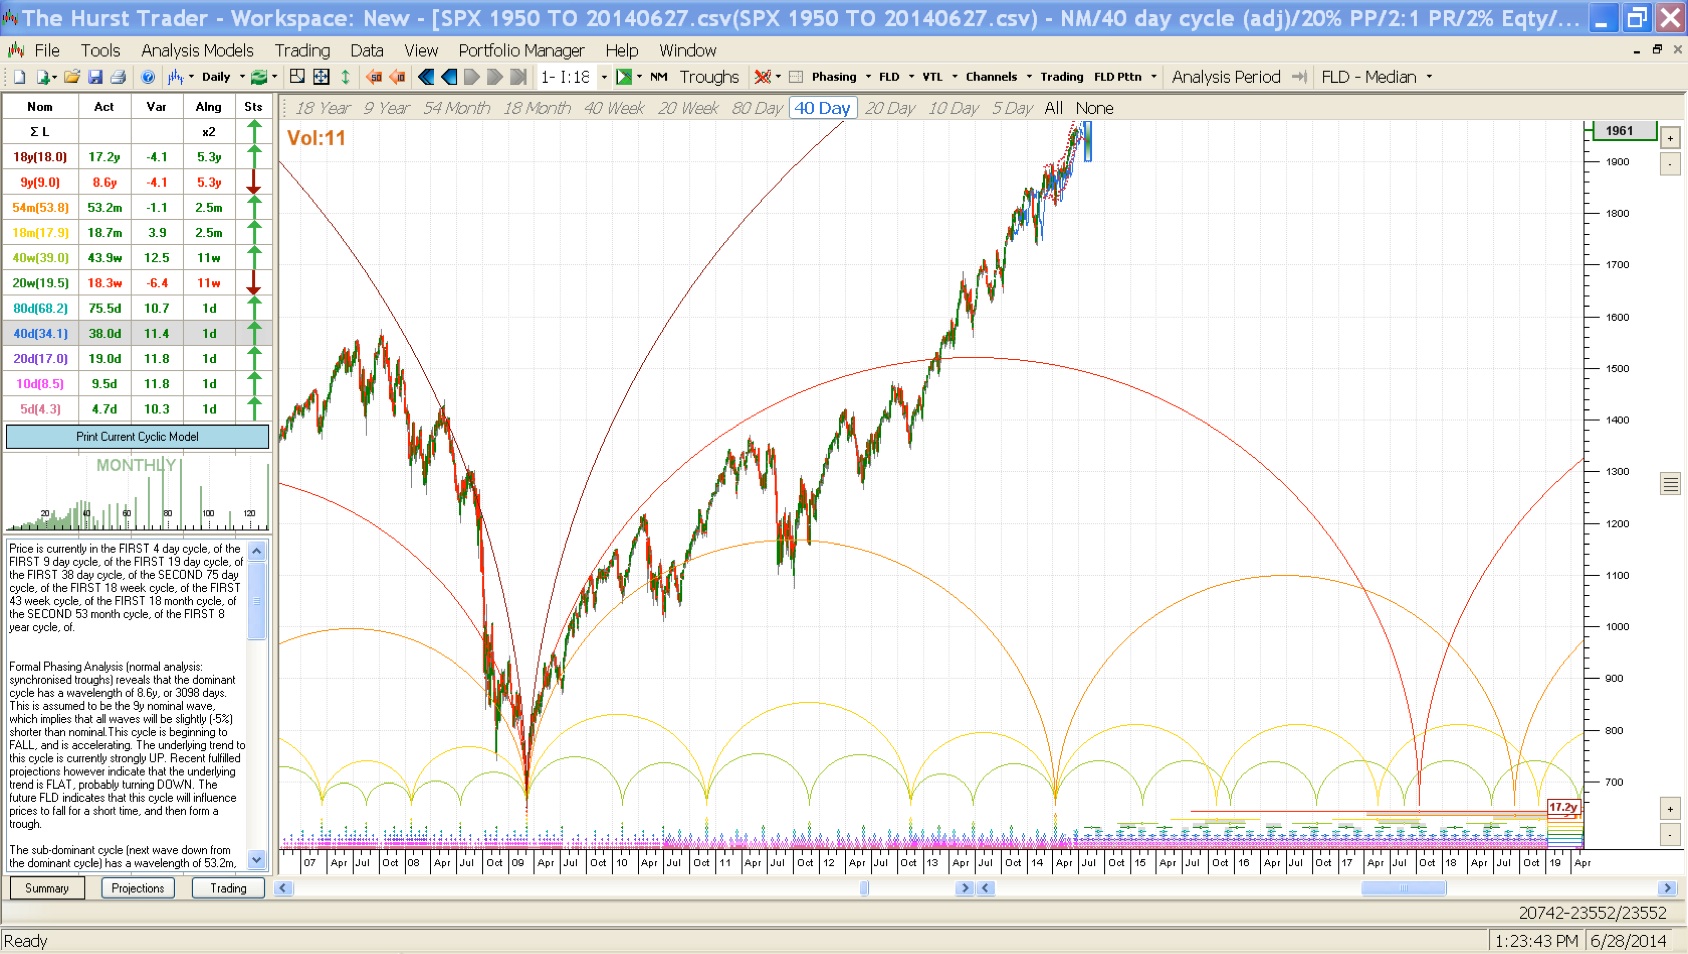
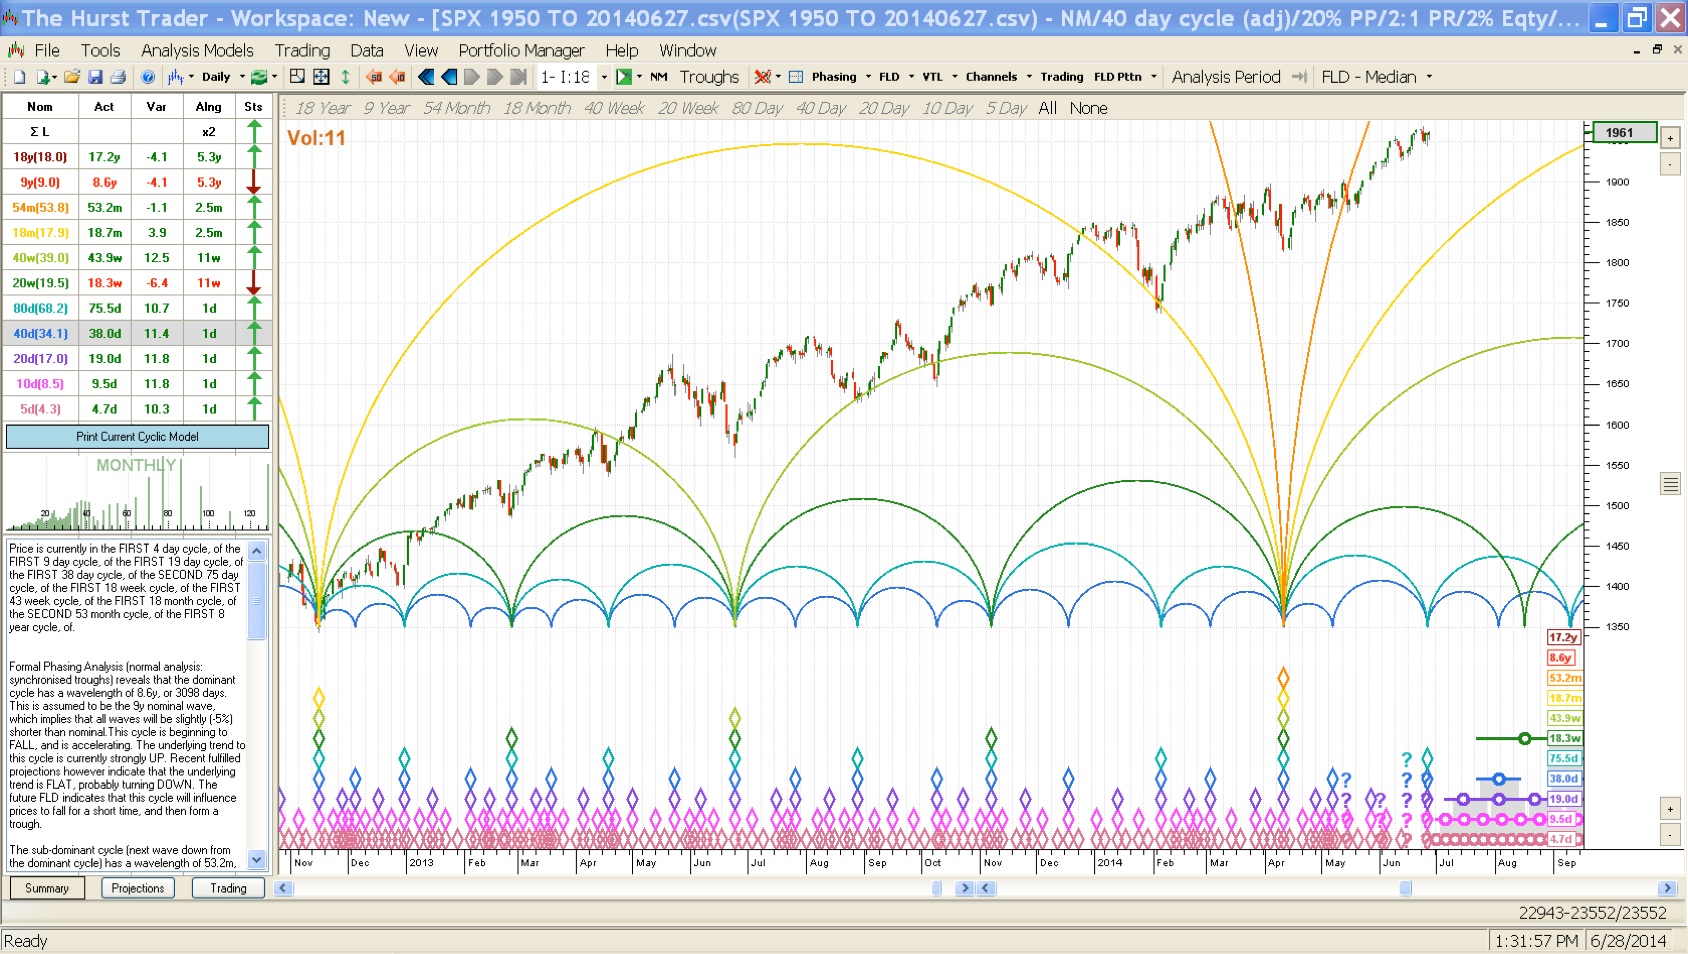
I haven’t reviewed the Hurst cycles since late last year. At that time, I was expecting a significant cyclic bottom to occur in the first half of 2014. A bottom did occur, but it didn’t look anything like I was expecting.
When a larger cycle is exerting a strong influence on shorter cycles. the shorter cycle bottom can become almost invisible. This appears to be what happened to the cyclic low I was expecting in late 2013 and early 2014.
In the second chart below is the cycle low as it occurred in April 2014. The largest of these cycles was a 54 month cycle and that is a large cycle that is unmistakable when it occurs. It usually makes a big bang. But it apparently did occur with a minor bottom and little fanfare.
You have to realize that these charts are a result of a computer program and it puts cycle bottoms that best matches its programing. Usually the software doesn’t make any error that I would bother to mention, but if I had been placing the cyclic bottom, I would have put it in Oct 2013. This is close to where my first estimate of where the bottom would occur. The reason why I would place the cyclic bottom in Oct 2013 is that Oct concluded a 3 step decline. It doesn’t show well in the SP 500 chart, but the DJ Industrials chart does show it better. See the 2nd chart below.

THT 2012 to 2014 on 06-27-14
In the following chart there is a 3 step decline that began in May 2013 and concluded in early October 2013. It was almost a megaphone formation with higher highs and lower lows. Oct 2013 seems like a much better place to put the cyclic bottom for the 54 month cycle low as there was a more significant correction taking place at that time. It wasn’t much of a correction, but it did occupy a longer span of time than the April 2014 decline.
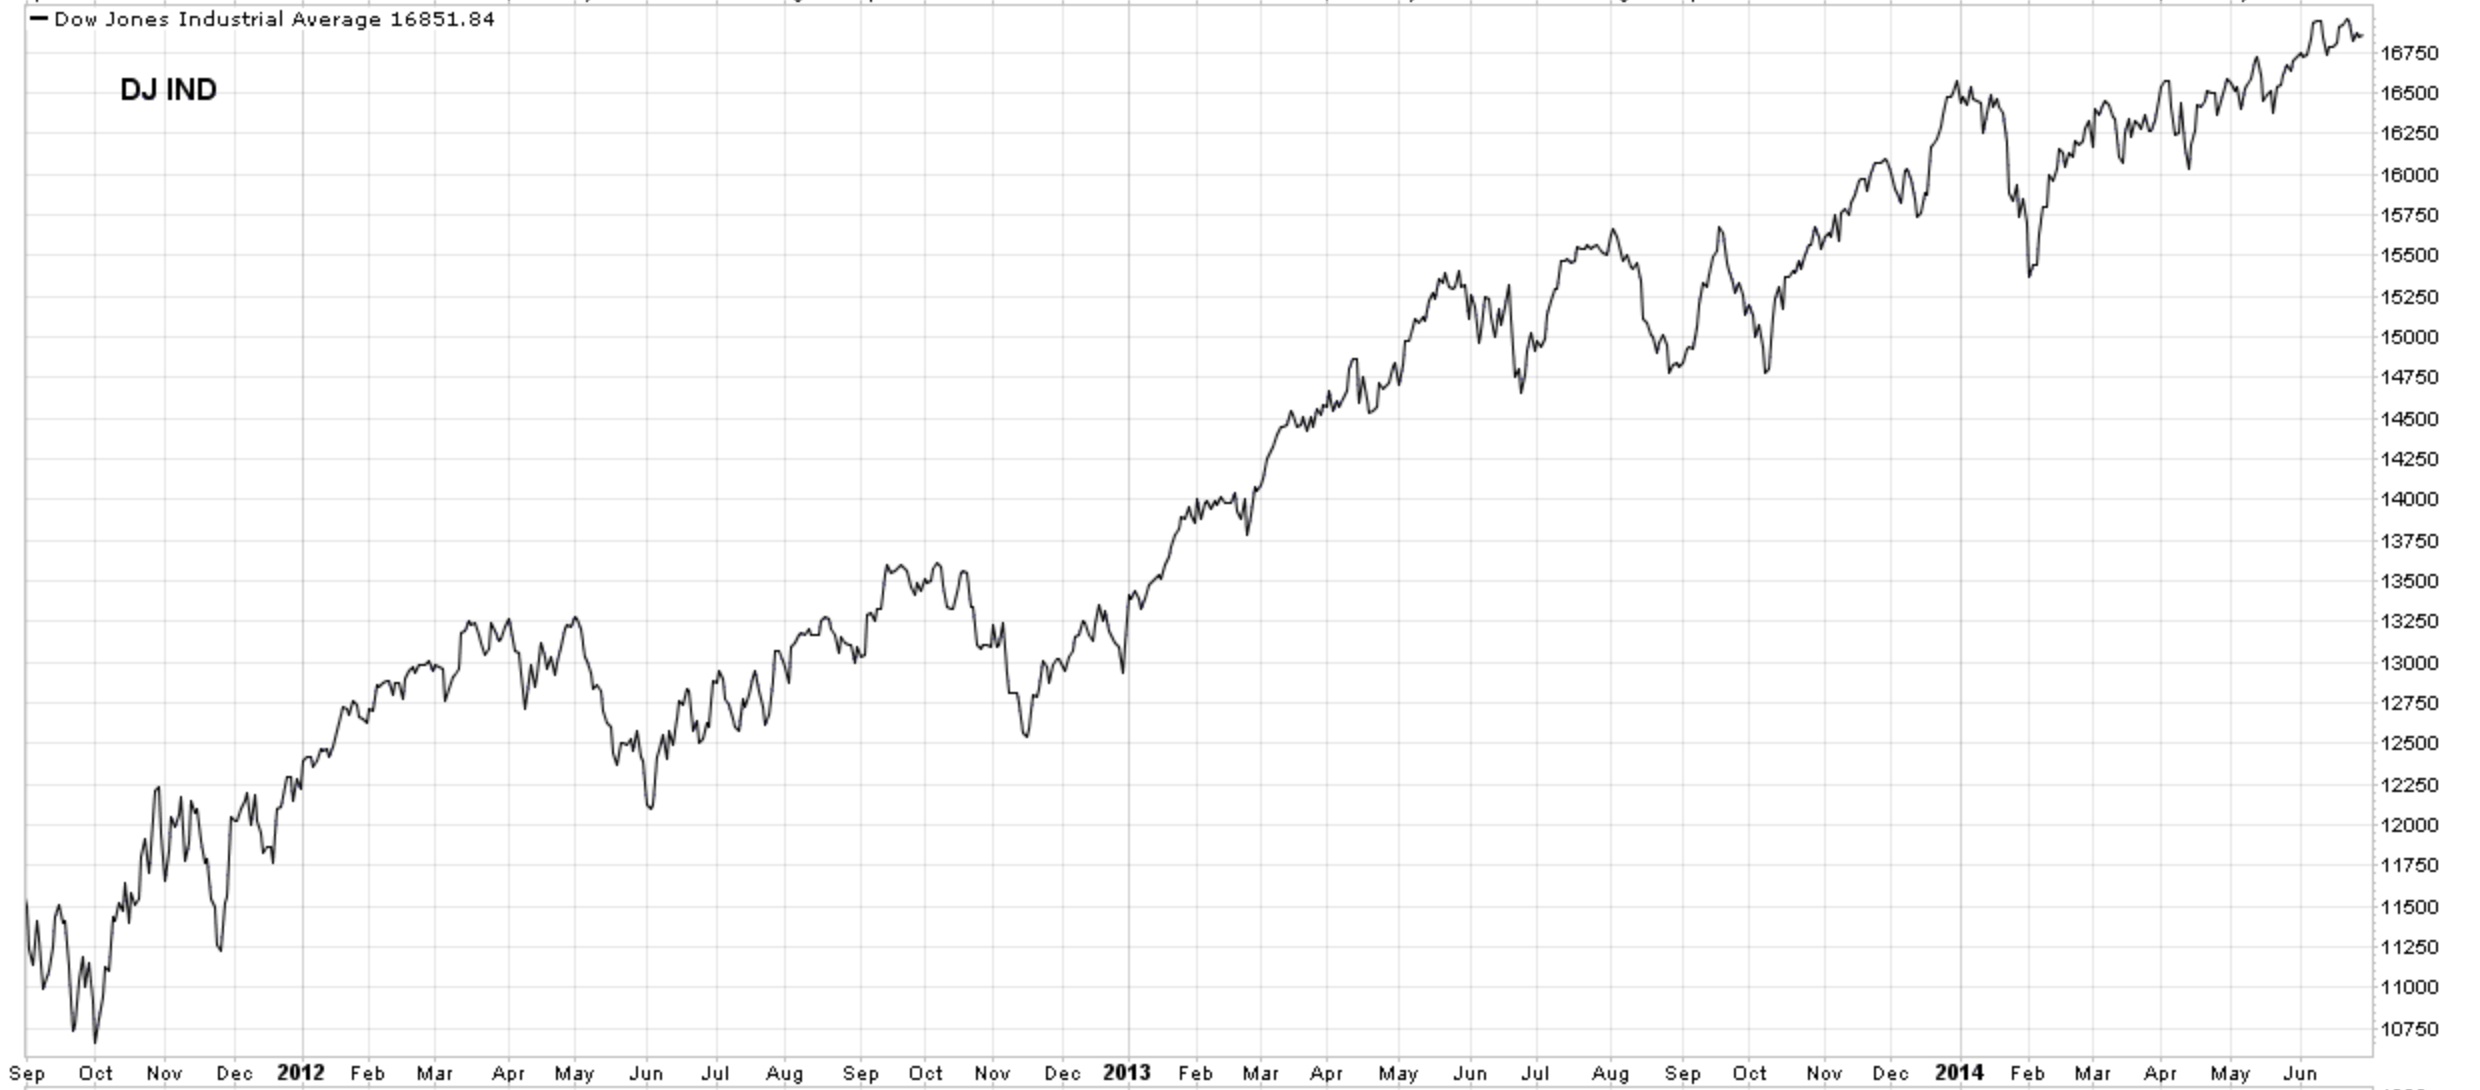
DJI 06-27-14
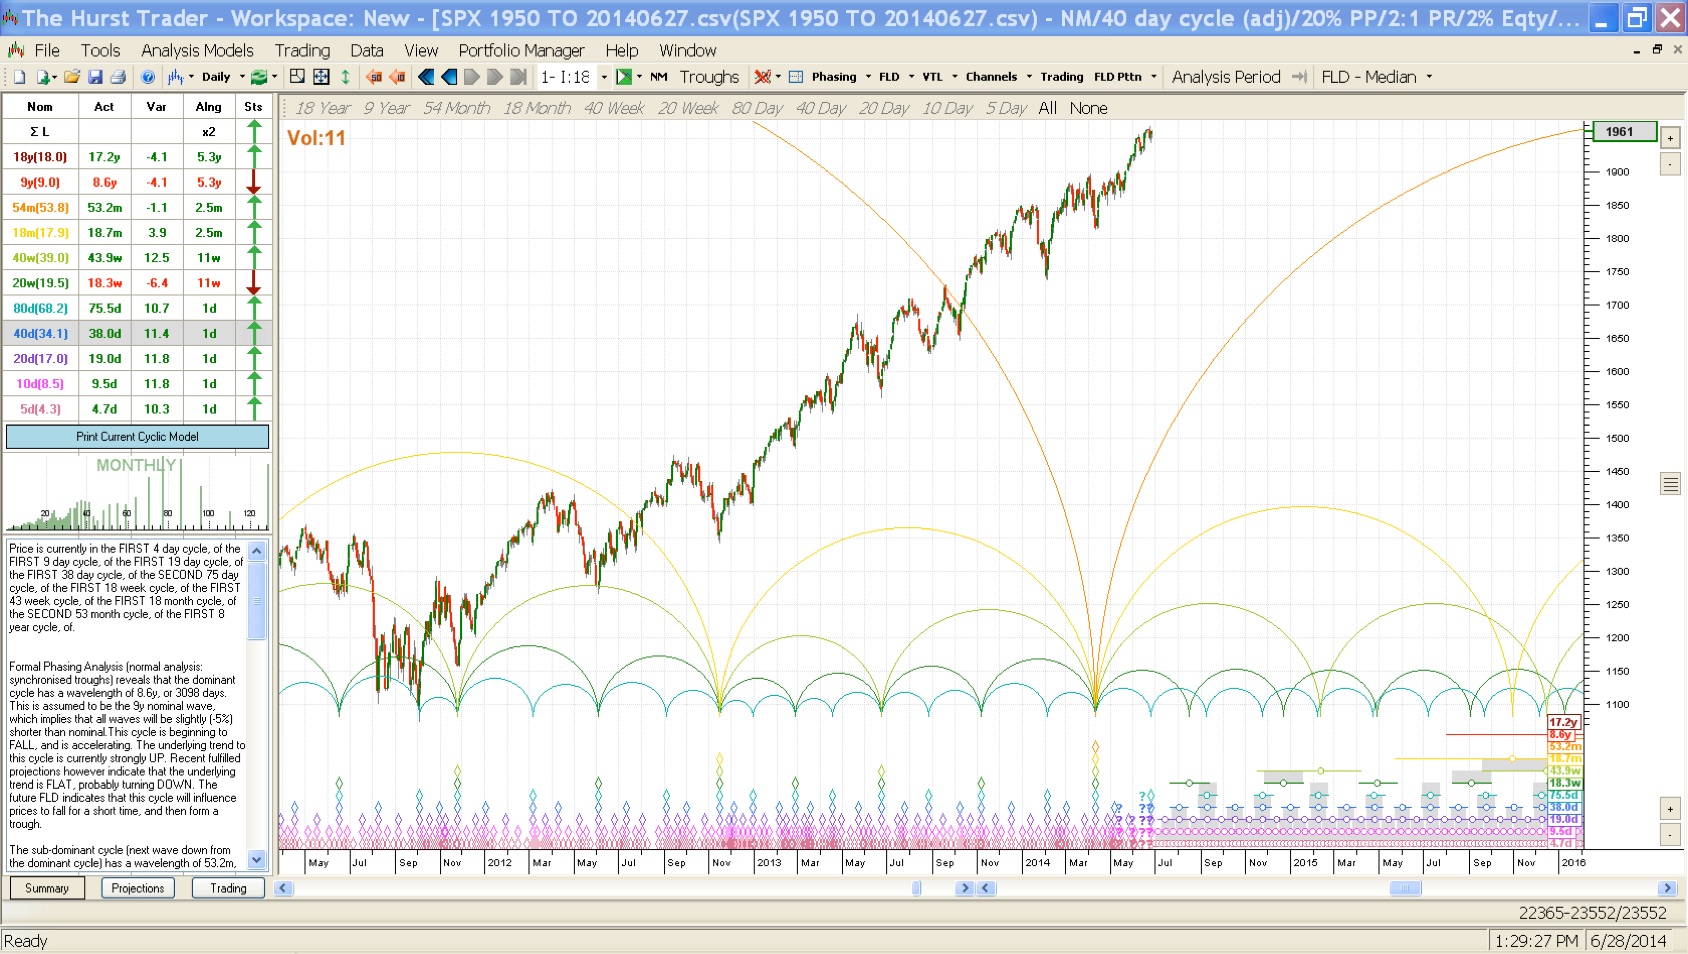
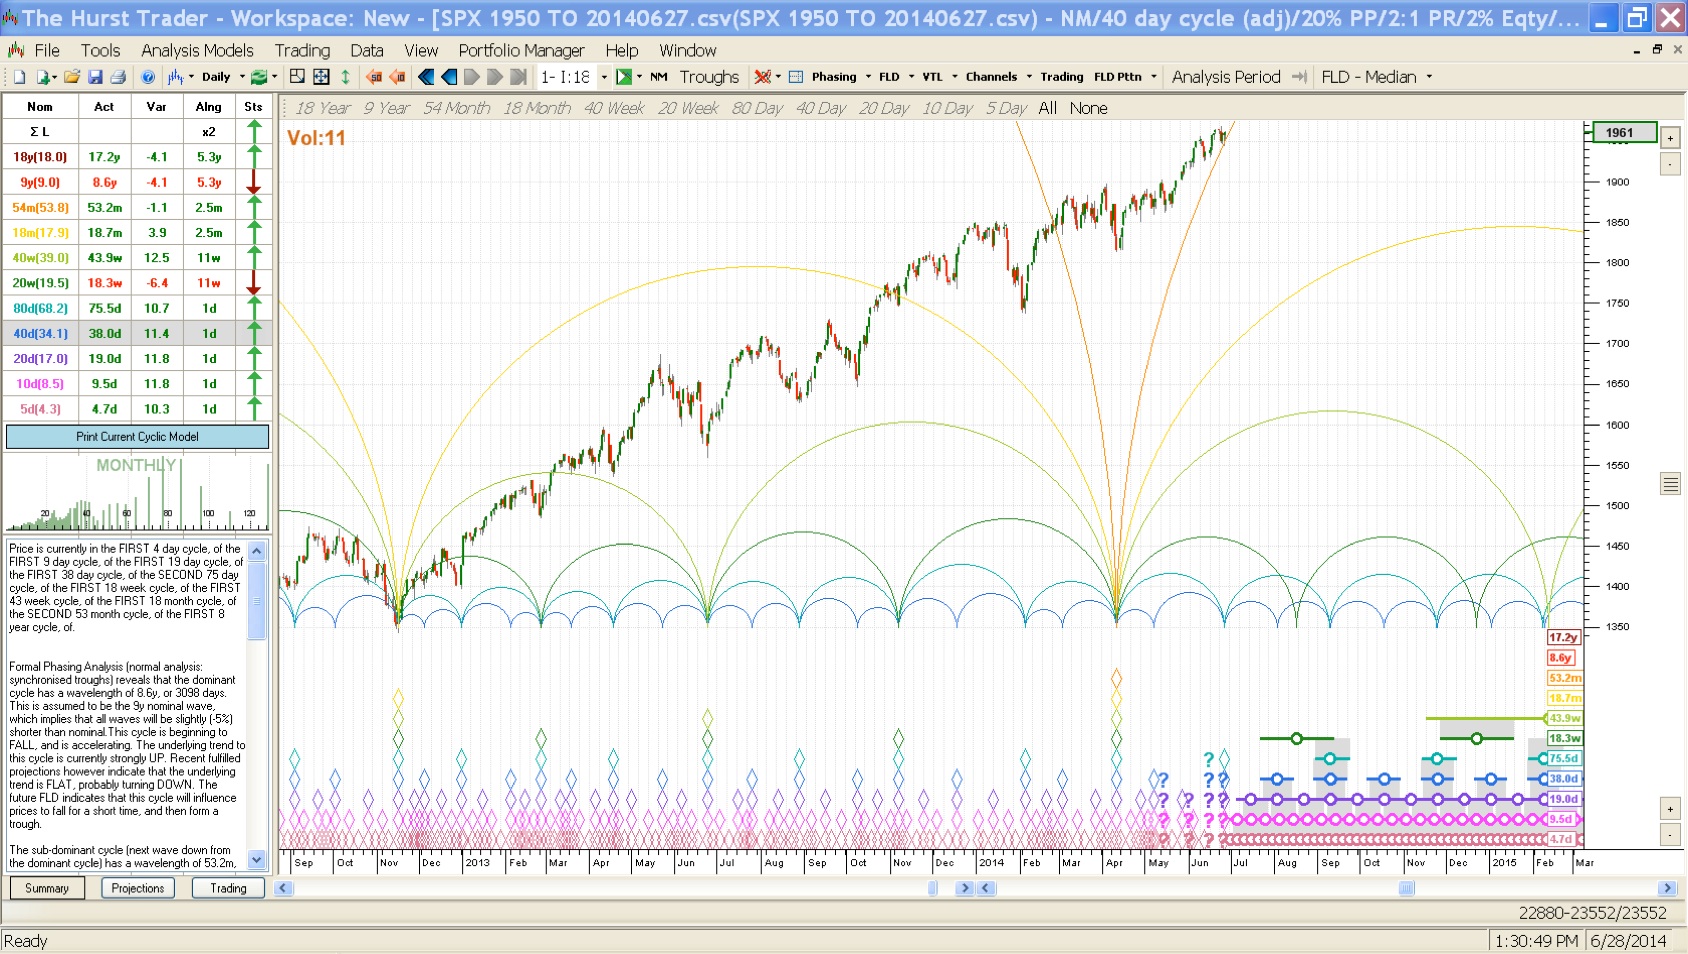
Following are various time zones showing the cycles from the very long to the current cycle outlook. In some of the charts, you will see the chart extended far into the future and that is to show you an approximation of where some major cycle lows could be anticipated.

THT 1950 to 2019 on 06-27-14
THT 2006 to 2019 on 6-27-14

THT 2009 to 2019 on 6-27-14

THT 2011 to 2019 on 6-27-14
THT 2011 to 2016 on 6-27-14
THT 2012 to 2015 on 6-27-14
THT 2012 to 2014 on 6-27-14
- PRINCIPLES OF HURST’S CYCLIC THEORY
The Principle of Commonality – All equity (or forex or commodity) price movements have many elements in common (in other words similar classes of tradable instruments have price movements with much in common)
The Principle of Cyclicality – Price movements consist of a combination of specific waves and therefore exhibit cyclic characteristics.
The Principle of Summation – Price waves which combine to produce the price movement do so by a process of simple addition.
The Principle of Harmonicity – The wavelengths of neighboring waves in the collection of cycles contributing to price movement are related by a small integer value.
The Principle of Synchronicity – Waves in price movement are phased so as to cause simultaneous troughs wherever possible
The Principle of Proportionality – Waves in price movement have an amplitude that is proportional to their wavelength.
The Principle of Nominality – A specific, nominal collection of harmonically related waves is common to all price movements.
The Principle of Variation – The previous four principles represent strong tendencies, from which variation is to be expected.
—————————————————————————————————————————————
- HURST CYCLE SOFTWARE
(Click on the links in this section to learn more about Hurst cycles.)
You can find lots of information about Hurst’s Cyclic Principles here.
For anyone interested in charting Hurst Cycles by hand . . . it’s time consuming and a LOT of work, but when executed properly it will reward you with profitable transactions (if you do it right).
In order to chart by hand, you will need the “CycliTec Services Training Course”, which was reprinted by Traders Press Inc. as the “J. M. Hurst Cycles Course”. It’s a long course with approximately 1200 pages and includes audio lessons. I don’t think this course is available at the present, but if you look around you should find someone that is selling their copy.
Charting the Hurst cycles by hand, I’ve been there, done that. I wound up not keeping the cycles up to date because of the work involved. When I fell behind, I missed some important market bottom dates. Those errors cost me money and that’s definitely not the path to success. So you must have the time to dedicate to charting the Hurst cycles. Without the time, don’t waste your money on the course. But there is an alternative to time consuming hand charting, Hurst Software.
Since I’m lazy, I love the software.
Incidentally, there is a LOT more to the Hurst cycles course and the software, than what I normally show in my blog charts. I keep things on a simplified basis by only concentrating on cycle bottoms.
Software:
The software to generate the cycles is a little bit expensive, excellent on projections, usually error free, and recommended. Since it ain’t cheap, you better be serious about making money in the market. But the return on your money should be worth the investment in the software.
The software is available through Sentient Trader.
There are different software packages, which are broken down into leasing or buying.
Lease Software:
EOD is “end of day”. Intraday software is really not needed and could be asking for tactical problems.
I have NOT taken the FLD workshop and can’t testify to how well it works and whether it’s worth the money. I do find FLD lines to be very interesting and they frequently work quite well in giving accurate measurements for a projected bottom or top, plus they also provide insight to possible resistance levels. Apparently the FLD workshop provides some new insights into FLD that Hurst may have missed.
The software automatically generates all of the bells and whistles that Hurst developed, plus a few more that the software author has added. The data file I use for analyzing the SP 500 cycles is downloaded from Yahoo Historical Quotes and saved in comma delimited format. There is no charge for creating this file on your own from the Yahoo figures.
If you want the Cliff Notes version of the cycles, try Hurst Signals. It’s consists of a concise update of the different cycles and costs $89 per month for the Basic Bundle. This bundle includes EURUSD, S&P 500, and CRUDE OIL.
I find the Hurst cycle software to be valuable and it has become an integral part of my analysis. It helps me to accurately project times for bottoms and occasionally it can project peaks. I wouldn’t want to give it up now that I’ve been using it.
—————————————————————————————
- GOLD
There is a possibility that gold has finally made a bottom. The next objective is to try to refine an entry point at the end of a small correction, or you can just plunge ahead and buy at any point presently. I don’t usually like to do that, but sometimes I get left behind trying to find the perfect entry point.
Here is the current chart for gold miners and it’s internals, advance-decline, up-down volume, new highs-new lows, etc
There is always a possibility that gold is in a rally phase from a downward step and will resume its decline. But it appears to have completed 3 steps down and should have more of a rally before resuming its downtrend. Because of the possibility of resumption of the decline, one should pay close attention to support and resistance points to ascertain where the path of least resistance lay.
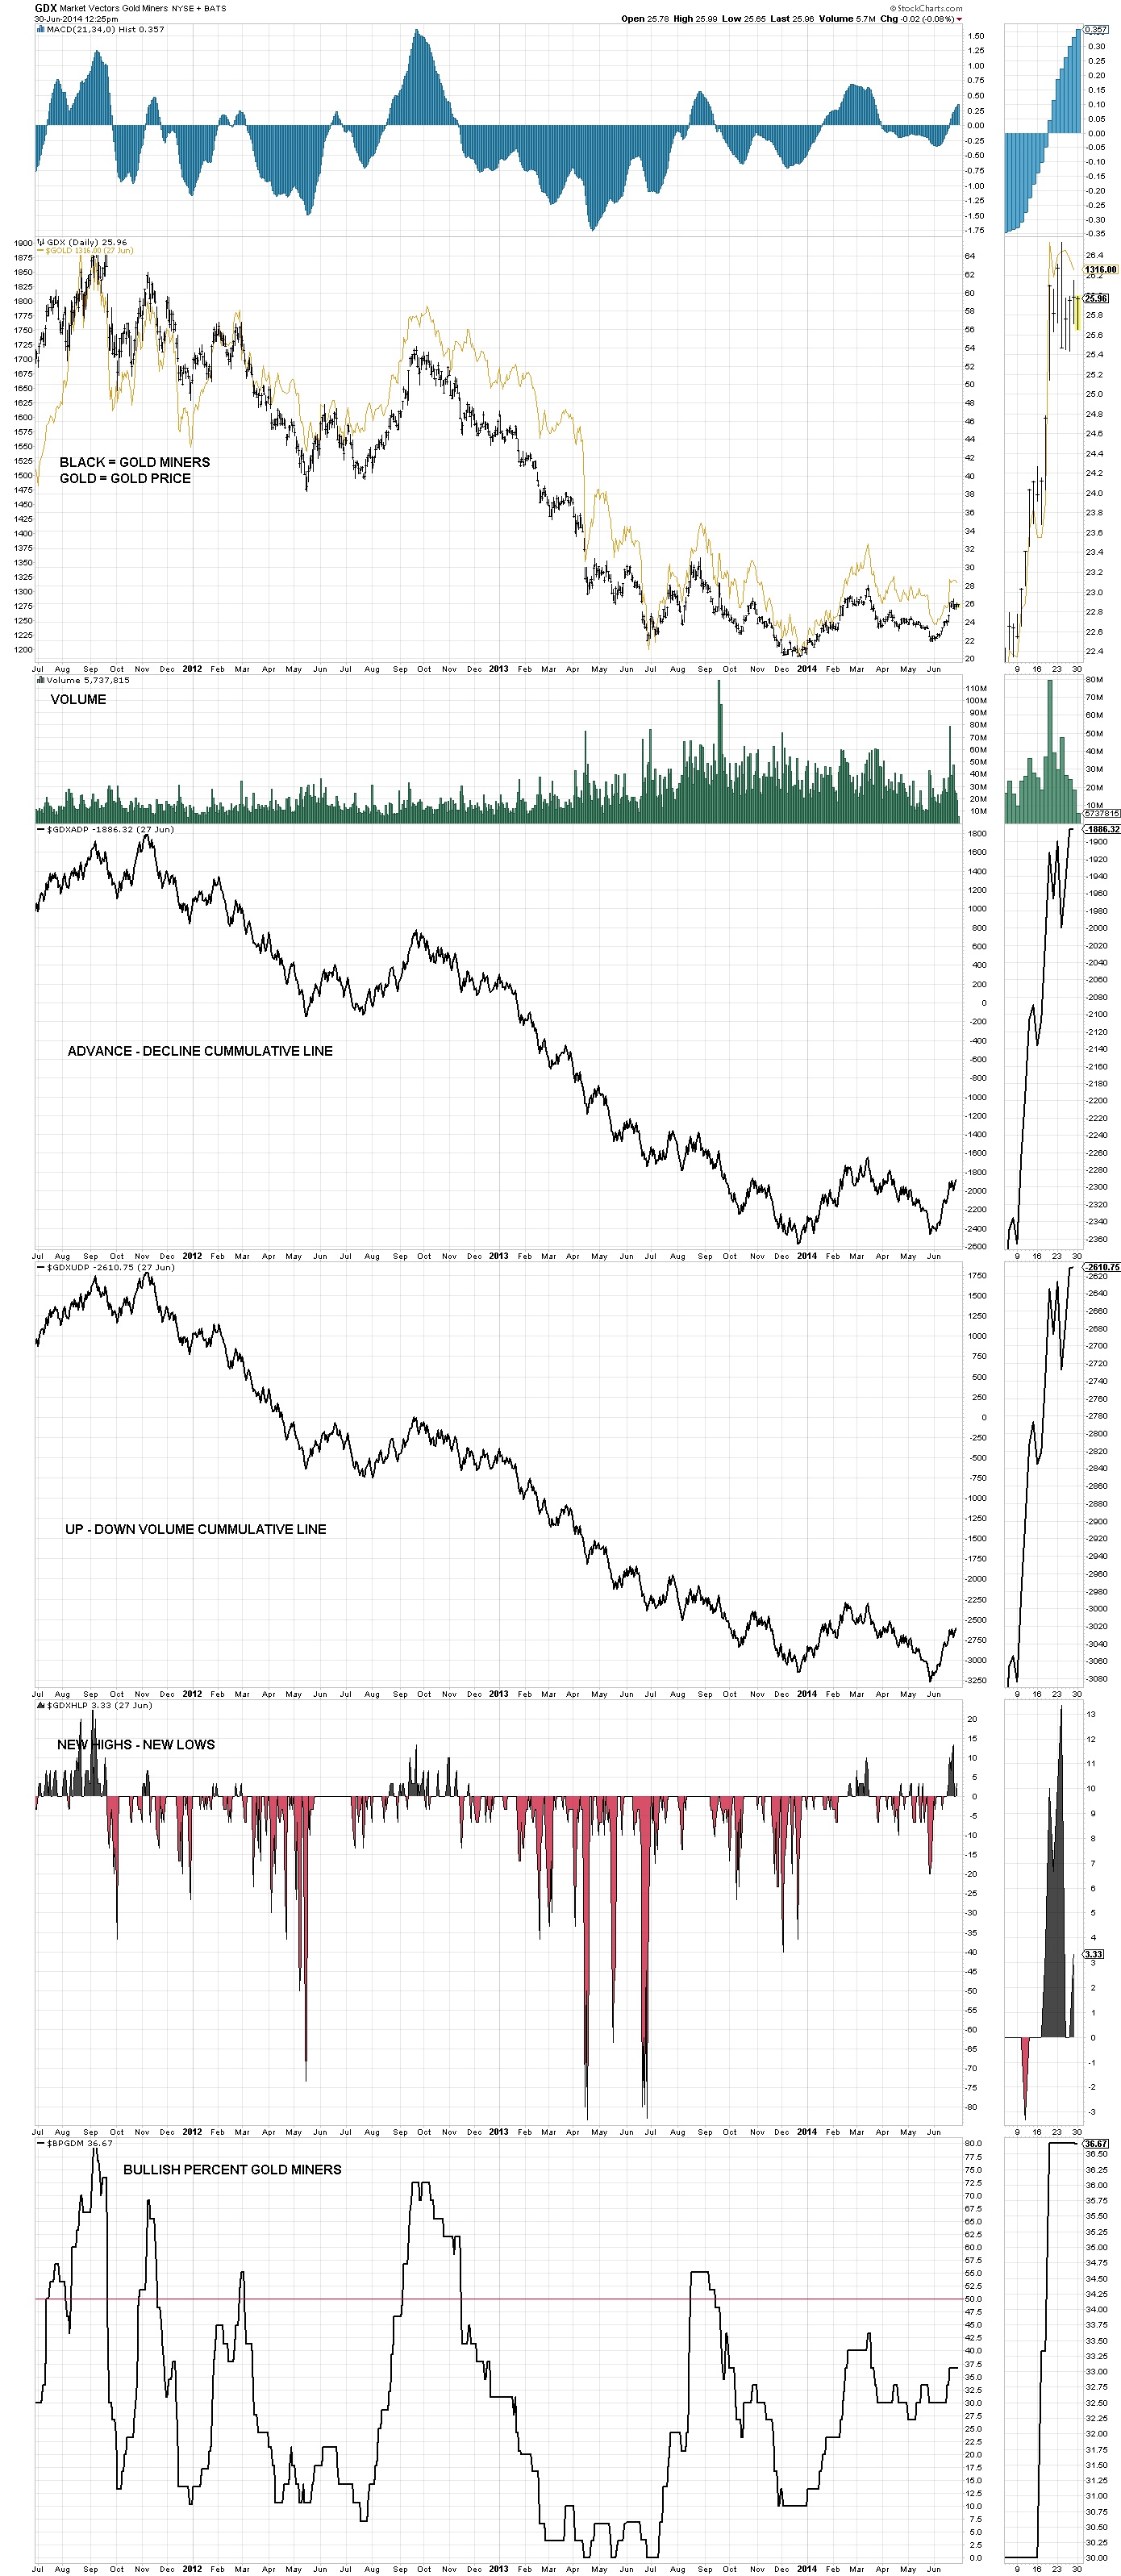
6-30-14 GOLD
- Click on any image to enlarge it
- All Rights Reserved © ™
- Leave me a comment just a few inches below, look for:

Leave a reply
- If you only see the following:

Comments
- Click on “Be the first to comment” and magically you’ll see:
Leave a reply
