04/05/13 – Now What???

MARKET MESSAGES
4/05/13 . . .
The warning blog issued on 4/3/13 has worked well.
Following are some charts to help lead the way.
Here is an interesting chart that put some possible temporary limits on the upside. The market formed a congestion area around the 161% level. We had an earlier inverse head and shoulders that predicted 1600 on the SPX. But the nature of this type of head and shoulders isn’t reliable for measuring. It wasn’t a reversal pattern, it was a continuation pattern.
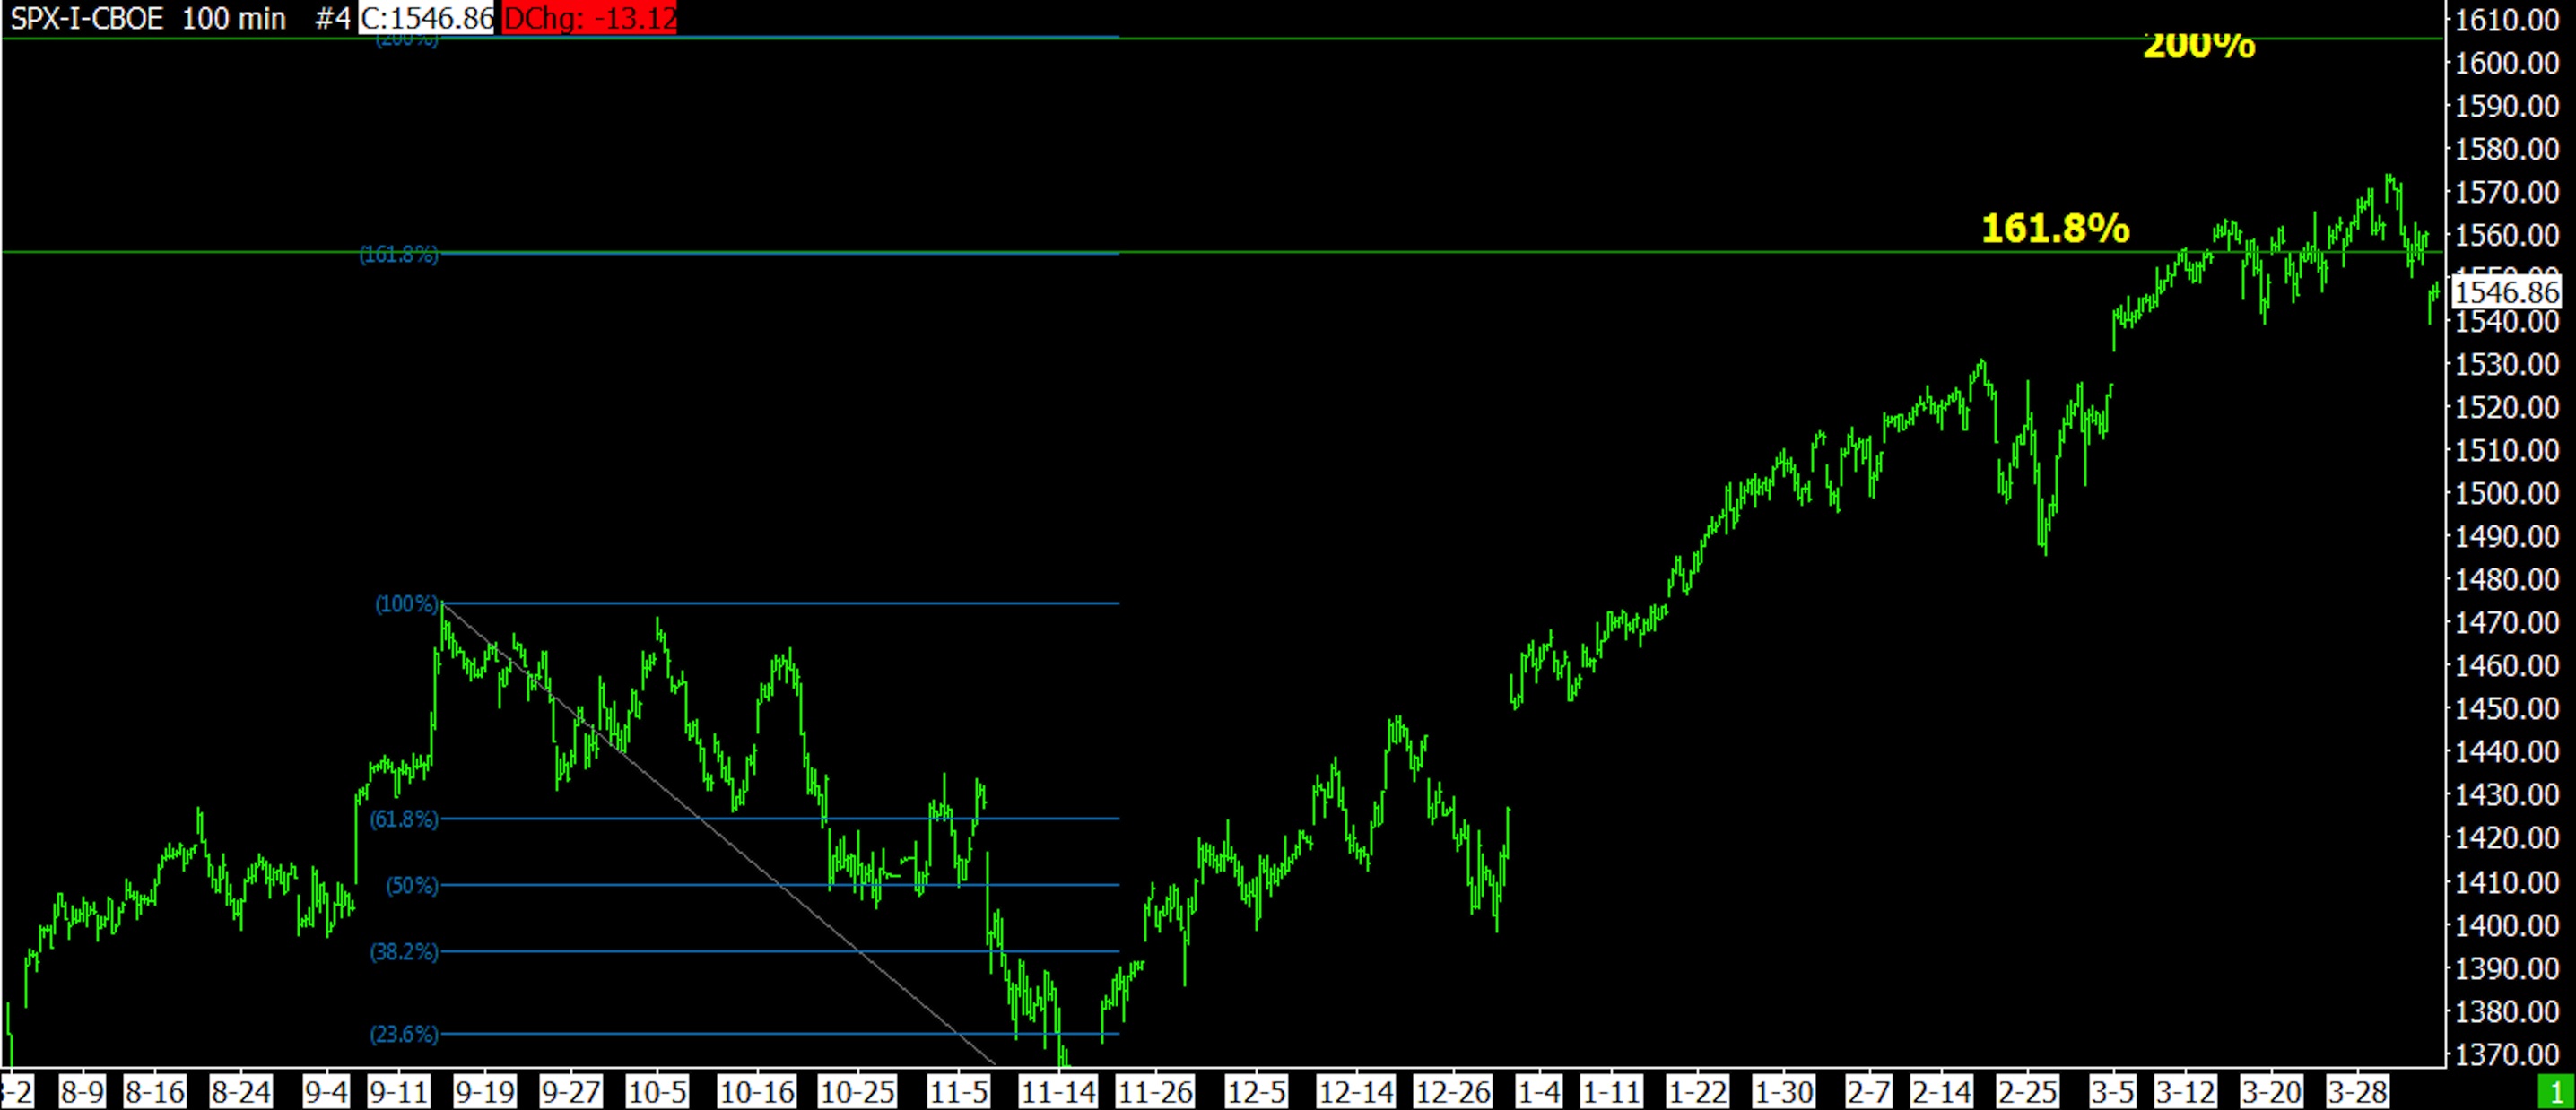
04-05-13 SPX 100 MINUTE BARS
The correct wave count
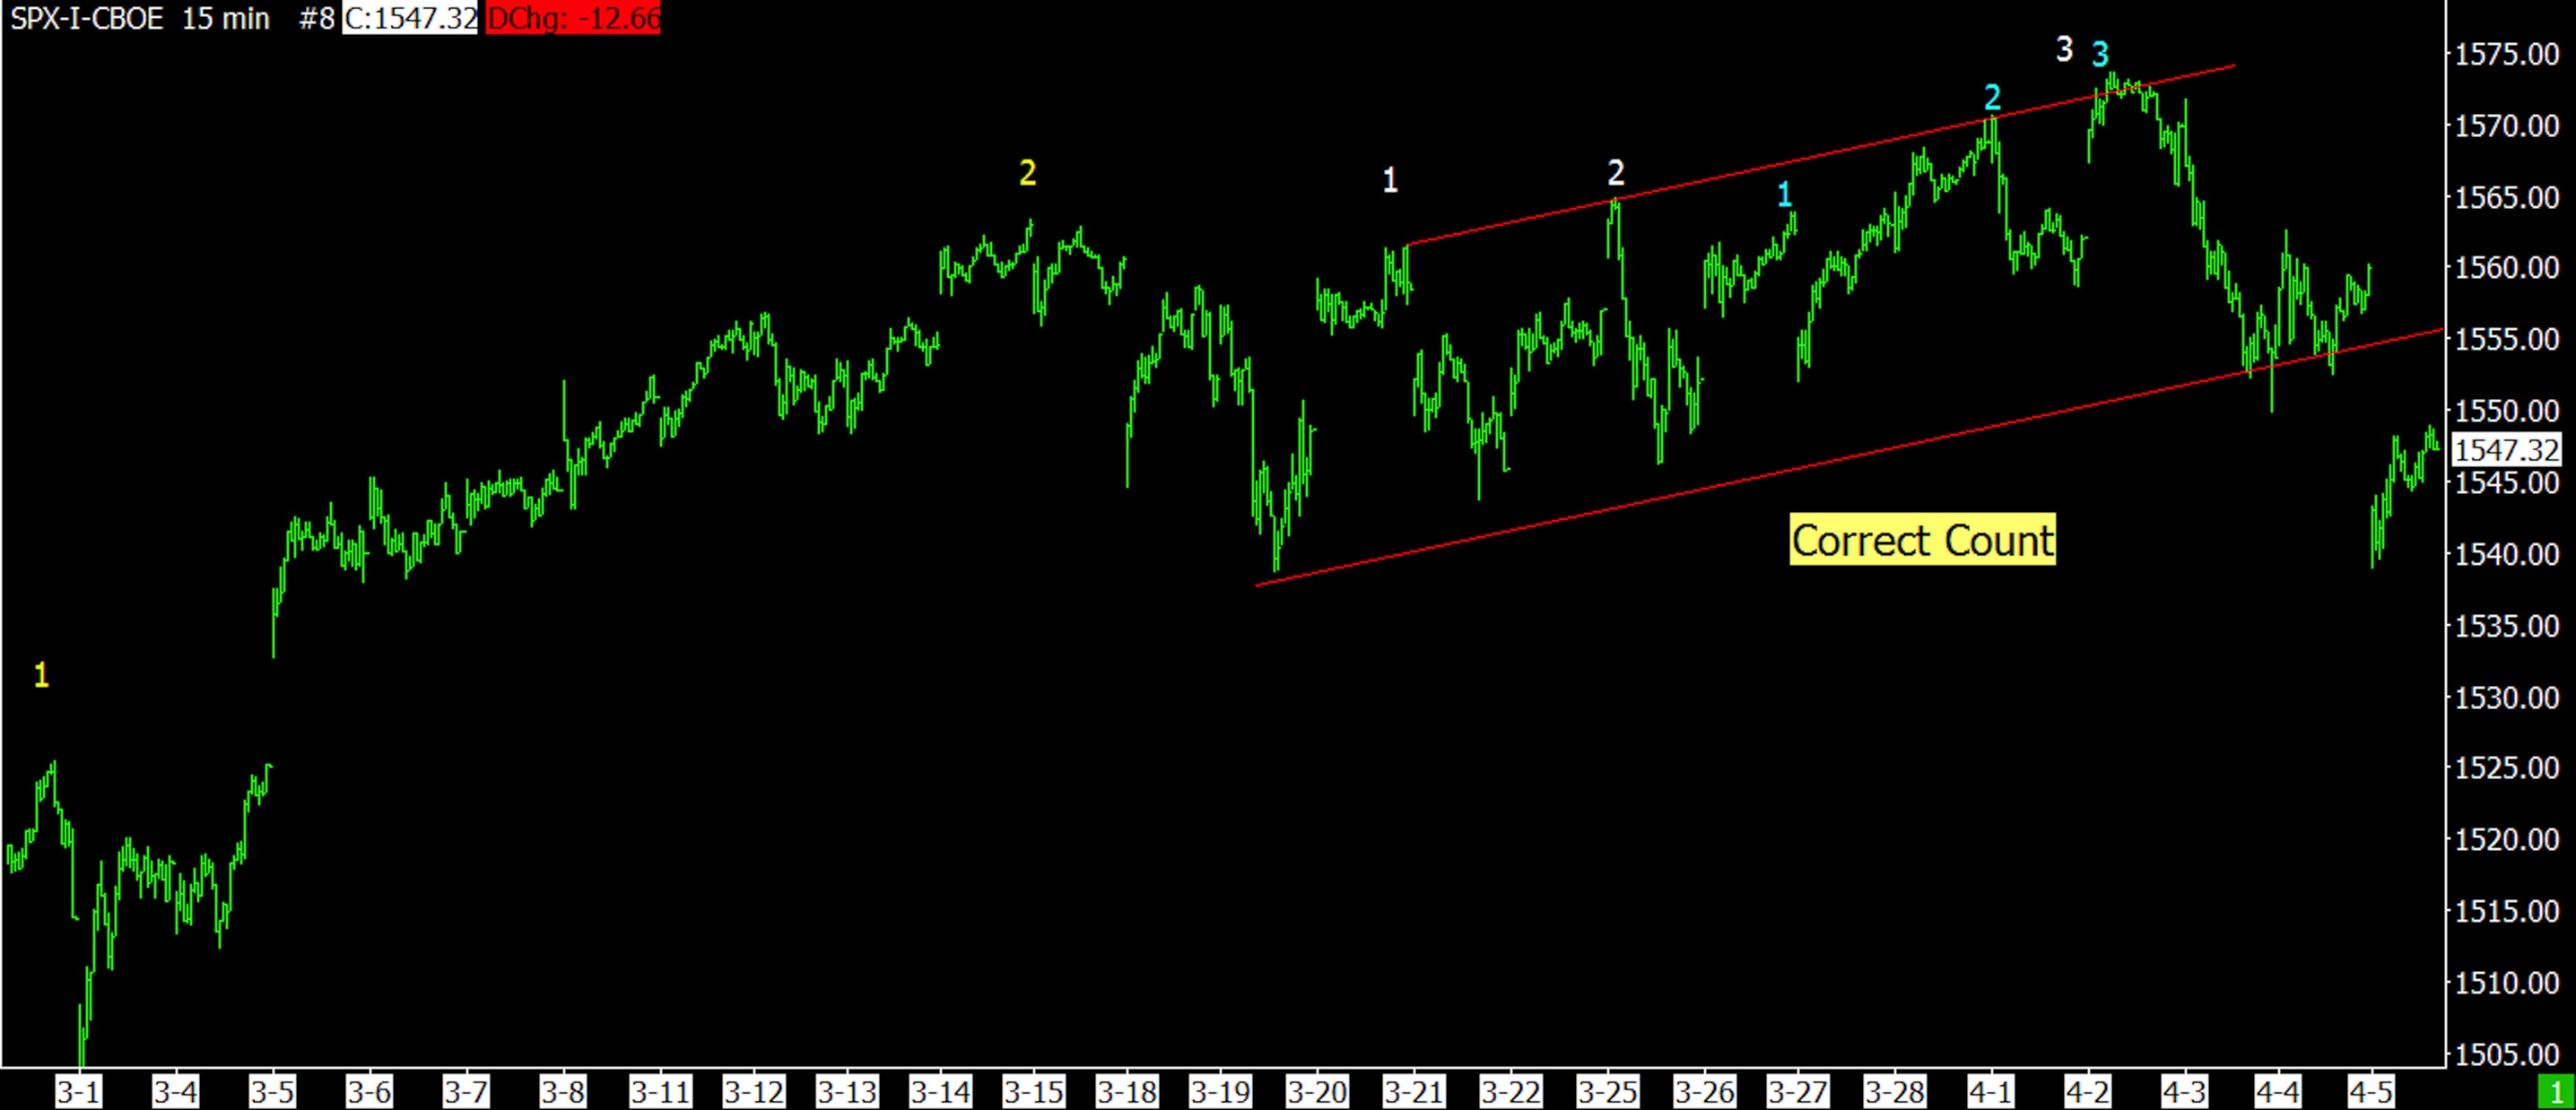
04-05-13 SPX 15 MINUTE
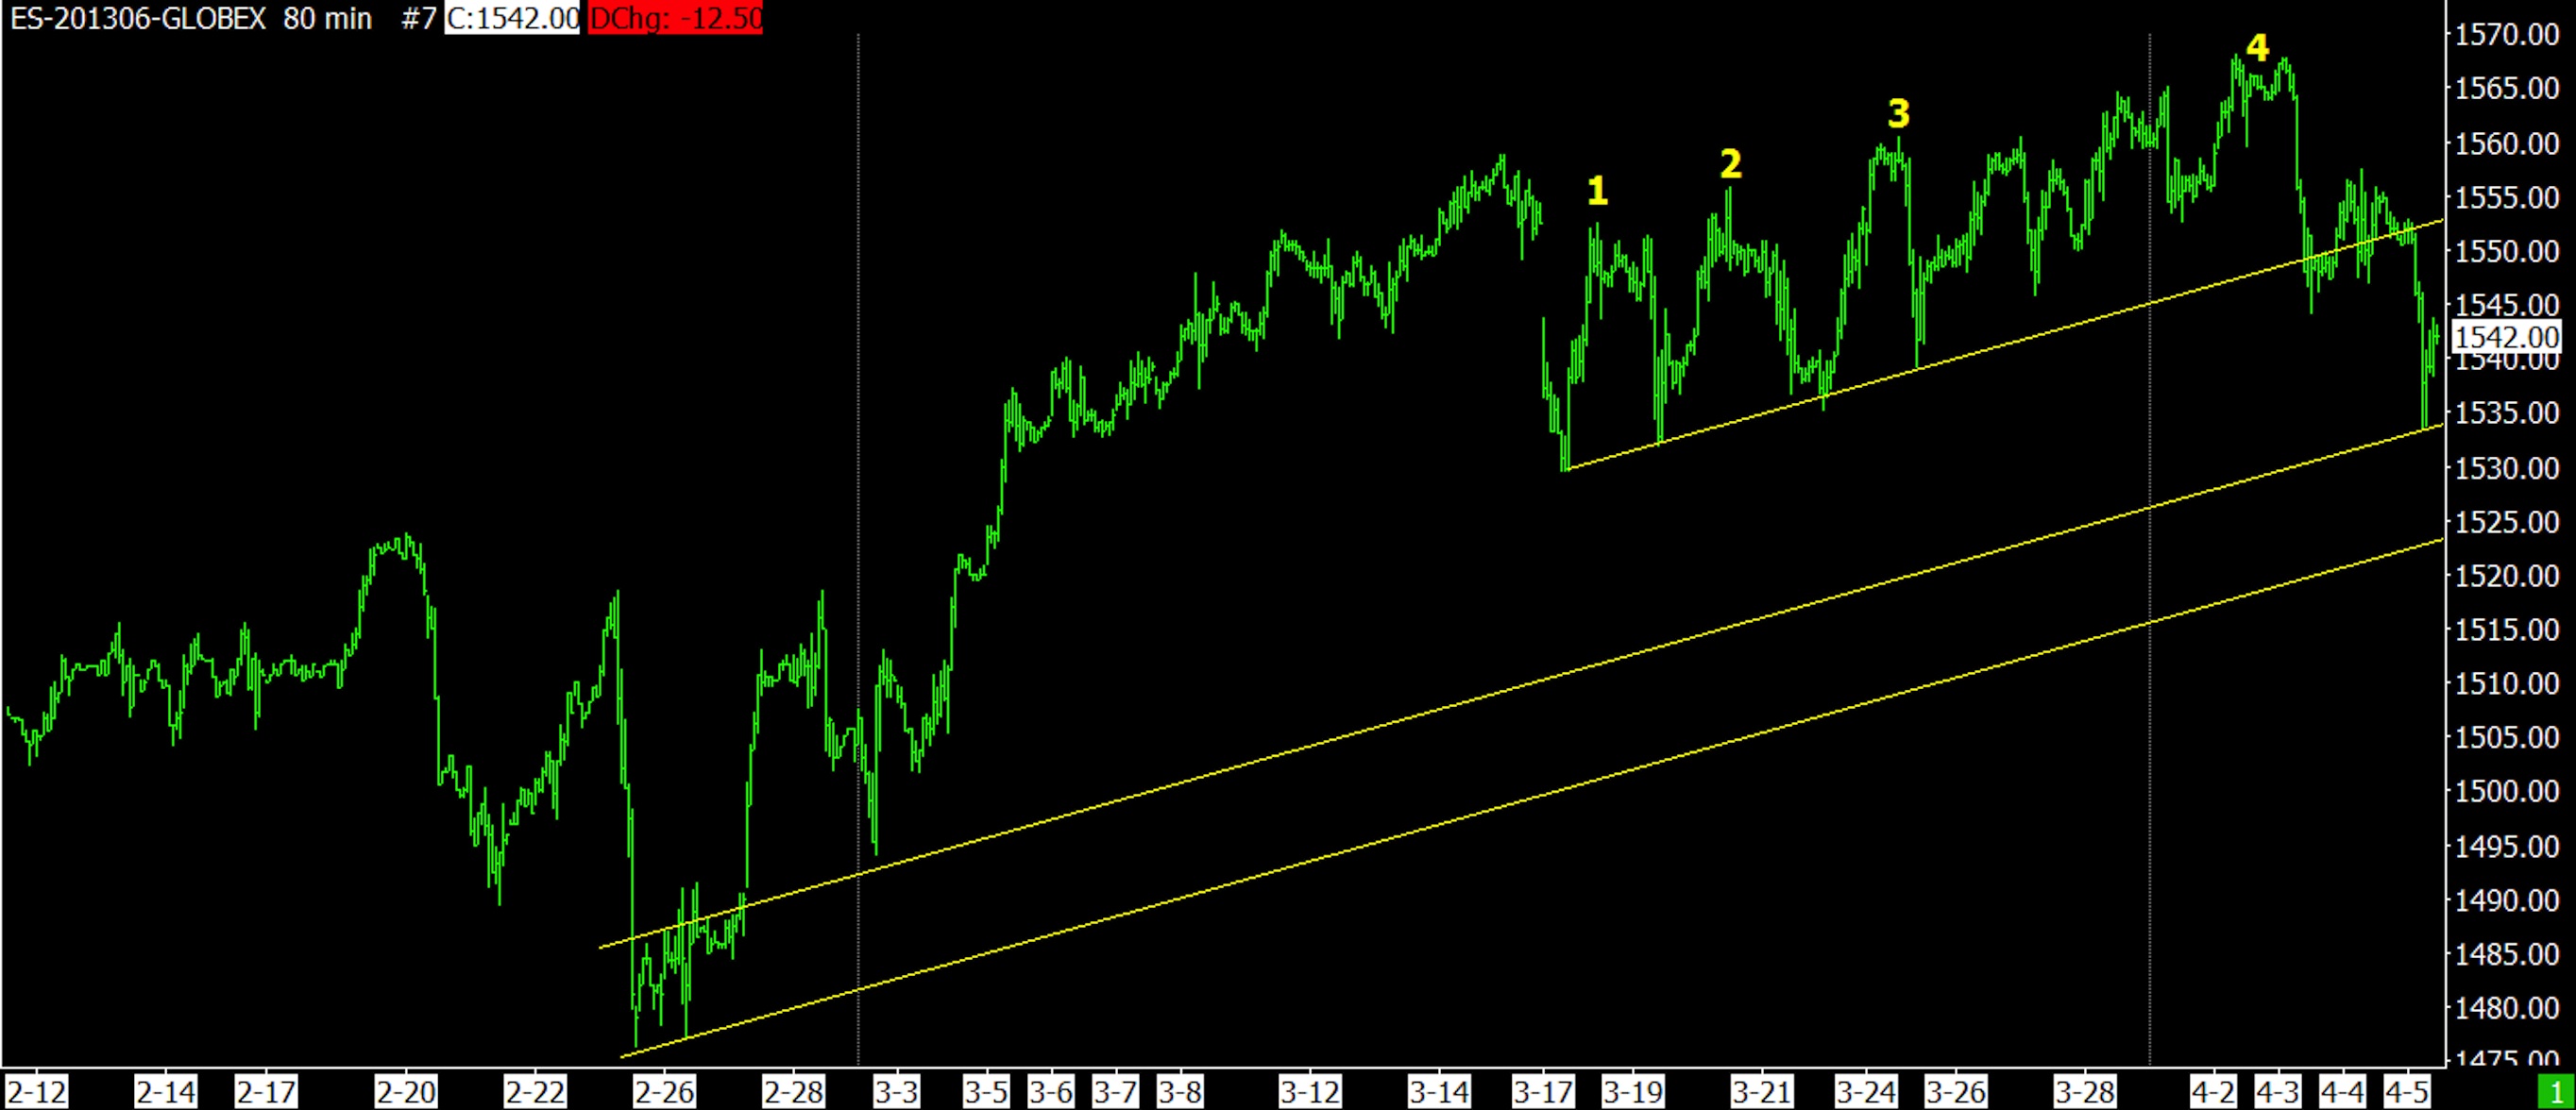
The next was the alternate count, which is now discounted. This time the SPX chart provided the best count and not the ES. That’s not usually the case.
-

04-05-13 ES 80 MINUTE
Which count is correct, the next chart or the following one???

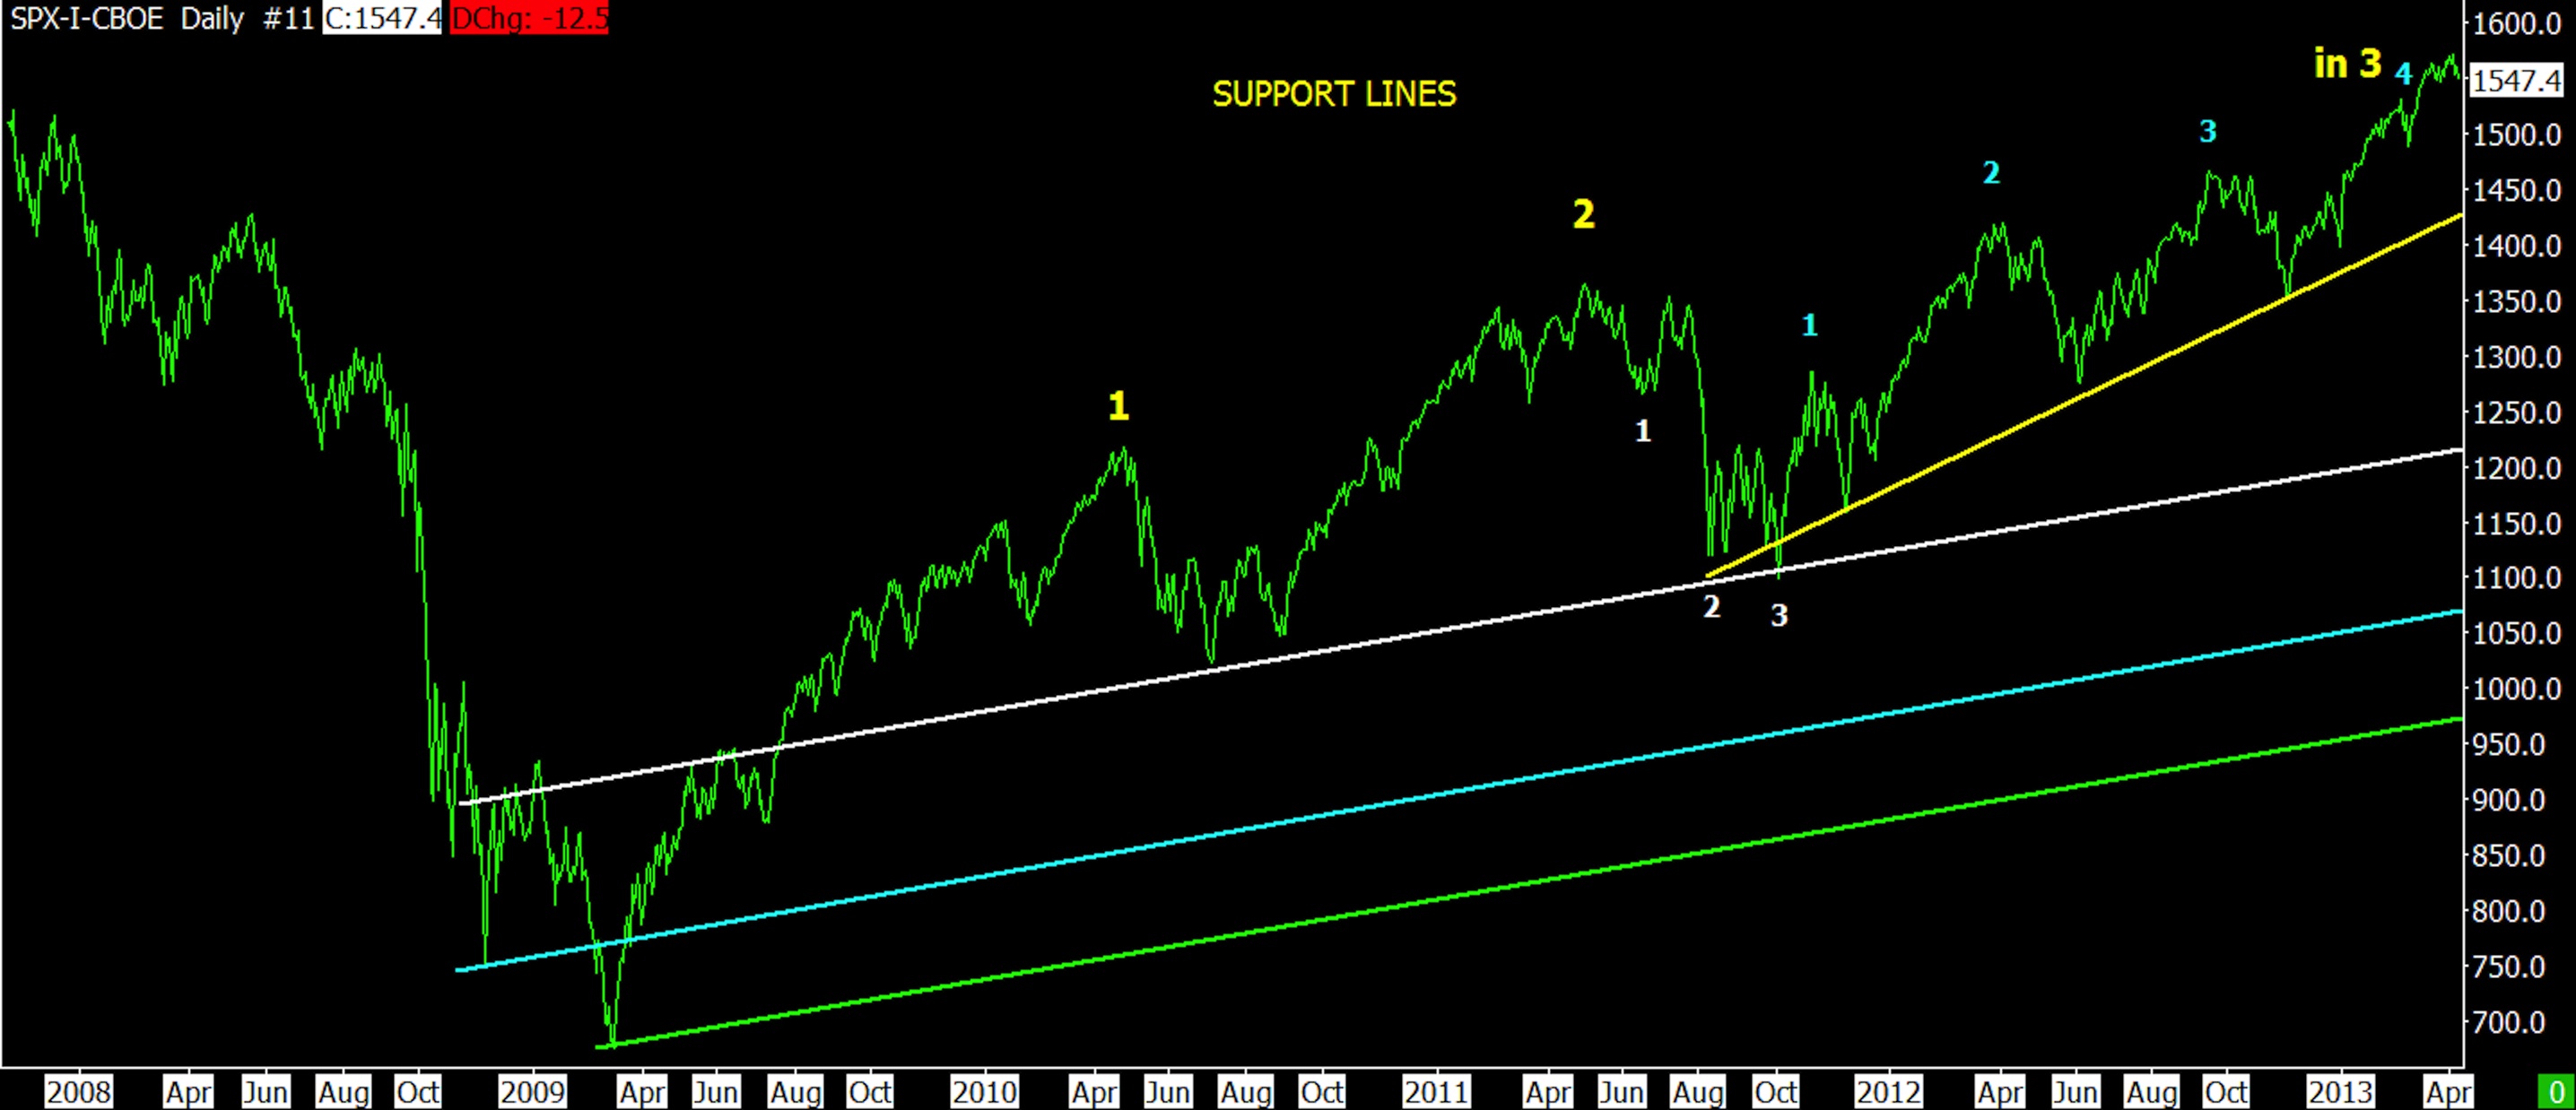
04-05-13 SPX DAILY 1

04-05-13 SPX DAILY 2
This a real head scratcher. If the second chart is correct, we will have another attempt at new highs. But if the first one is correct, we are going to have a correction of significance here. If we have another attempt at a new high, I would expect to see poor high low figures and lower advance decline figures. Much like what happened in Oct 2007.
The market doesn’t normally make U-turns. It forms these broad saw tooth formations and that is definitely missing here. That is encouraging.
The big question is whether we “may” be finishing the bull market since March 2009. I have been intrigued for some time that we could have the biggest correction since March 2009 and keep the bull intact. This type of correction “could” go close to or below the Oct 2011 lows. After that if would rise in yellow step 4 and 5 (as portrayed above). This is a highly bullish picture that “may” see the Dow at 20,000 or higher (several years from now though). This “could” still be part of the rising line on the megaphone formation. Probably the answer to this is whether the FED is all out of bullets. That is always a possibility because the FED has never been backed against the wall like this in its lifetime. 2008 created problems that the FED and the economy are still struggling to overcome.
If the FED was out of ammunition, could the market make a U-turn??? The situation is brand new and there is no precedent so I don’t know. You just kinda have to guess at the outcome and read the market.
The flip side and most bearish picture is the bull is dead and large step 3 down will begin. That is very ominous and will end below the March 2009 lows. Possibly much lower.
I have not published any updates from Jeff Saut for awhile because we have begun to deviate on opinion. He has become very bullish and this was OK for awhile, but now I am growing more cautious and can’t agree with his viewpoint. The wave count has always been the limiting factor for me and it has looked like it “could” be in some type of ending phase since Nov 2012 (3rd step). I elected to not confuse the situation by publishing Jeff Saut’s material.
When reading my remarks, remember that I was a regular Chicken Little from late 1998 until 2000. I was really bad, the sky is going to fall, the sky is going to fall. Nobody listened and I mean nobody. I can be early on big turns and who knows if I’m too early again but I am taking steps to protect against that.
I have not issued a sell signal for the bull market that began in March 2009 and do not intend to do so until a significant correction unfolds. I will issue warnings and that’s all. I am trying to avoid another repeat of 1998 to 2000.
—————————————————————
Is anybody listening???

- Click on any picture or chart to enlarge it
All Rights Reserved © ™
Explore posts in the same categories: UPDATE, WAVE COUNT
April 9, 2013 at 8:23 PM
I was able to find the two books so I will see if I can understand them. I read some reviews of the books on Amazon and many people seem to think that they are difficult to read. I will try my best.
I am interested in cycles but I never had a systematic way of determining cycles on charts aside from casual observation of tops and bottoms in the middle of my charts (which are always very clear in retrospect only). I am very open to this Hurst theory if I can grasp it. But, I don’t like to become dependent on software, because if the software company halts development and it stops working with the future versions of windows, then you are out of luck.
Anyway, I don’t think I will be able to find the course, because it does look like it is out of print and the publisher is gone. That might actually be a good thing, because when it comes to technical analysis, the moment a theory becomes popular is the moment when it also stops working.
Bob, I really appreciate you taking your time to explain your techniques and for your hard work in maintaining your website.
I am already on the email notifications list, but if I don’t respond for a long time it is because I work full-time, so I can only do my market analysis and studying at night.
Thank you very much!
LikeLike
April 9, 2013 at 1:53 PM
Did you join the email notification list??? It’s in the upper right of the blog. You will be notified immediately anytime I make an update.
Bob
LikeLike
April 9, 2013 at 11:32 AM
As I said under the category, cycles, you can find some information and a links that will guide you to the software for Hurst cycles. You can do Hurst cycles on your own, but it requires a fair amount of work. The software itself can be a little bit pricey but it “can” be worth it if you use it properly. They also have some cheaper alternatives to the software, available by the calendar quarter.
This is where you can get the software, but this link is for the free material on Hurst. This is one of the better free sources of Hurst. They hope you get hooked and buy their software. I did beta testing for this software before it was available for the public. At the time he lived in South Africa. It appears he’s in Italy now but that’s a guess. I just happened to tumble upon him by accident as I was researching some Hurst info. He was still writing the program and needed beta testers and I quickly volunteered. You couldn’t believe how much time it took the author to write this program. It was years of years of work (I think 9 years). I thought he did a good job.
http://sentienttrader.com/about-hurst-cycles/white-paper-1-hursts-market-cycles/
also
http://www.sentientcode.com/downloads/SentientTraderHelp/SentientTraderHelpContents.htm
Hurst’s has a couple of books.
Cyclic Analysis by JM Hurst
The Profit Magic of Stock Transaction Timing by J M Hurst
Look hard and you can find these books on the internet in PDF form. Reading these two books won’t really tell you a practical method to achieve it’s cycle defining techniques, but it will explain what’s happening. Hurst died quite awhile ago.
Hurst created a course (“JM Hurst Cycles Course” – reprint, and “Cyclitec Cycles Course” – original version). It is expensive (several hundred dollars). It’s by far the best explanation of Hurst techniques and it’s very clear. The company where I got my copy doesn’t appear to be in business anymore ???? (Trader Press – check it). Occasionally you can find someone selling their used copy. Gotta look around everywhere to find that.
In my blog the Hurst charts show only the cycles that the software produces. It also does FLD, VTL, etc. Nifty software but you need to get a feeling for Hurst first. I’m too busy to bother to do the Hurst stuff by hand. When done by hand, I usually do nothing and neglect the subject completely and that’s not good because it does have its uses.
I’m housebound today and tomorrow due to health problems (nuts), so if I don’t go off in a million other directions I’ll try to post some of Terry’s updates soon. I’m going to start with my first recording of Terry. Incidentally, without the charts the audio is pretty useless.
Bob
LikeLike
April 8, 2013 at 9:14 PM
Hi Bob.
I have a lot of catching up to do. I had never heard of Hurst Cycles, so I will be doing some reading on your blog and on the internet. I understand that nothing is perfect in the market, so cycles could be off by a few weeks or months. I would like to try to go back as far as possible using DJIA data to see if the observed cycles of late would have fit early history. Using extremely long periods leads to very small sample sizes due to lack of data (ex: only 5 or 6 cycle observations since 1984).
Anyway, I was searching for T-theory information after I read Marty Schwartz’s book and that is how I found your blog. I could be wrong, but it looks like you are one of the few who are still carrying Terry’s torch. There are very few resources on this subject on the internet. So, I hope you will find the willpower to publish any additional clues left by Terry, otherwise these things might be lost forever!
Thanks for your explanations Bob!
LikeLike
April 8, 2013 at 10:21 AM
Hi V,
The large oscillating waves are not based on T Theory. They are rigid time oscillations based on “observed” peaks and bottoms. The peak in 2007 and the present on-going top are “right translations” of the predicted peak. This is not uncommon for a peak to have a right or left translation. 2000 and 1987 were close to the mark.
Regrettably I don’t spend much time on T Theory. I like the theory very much and Terry was the messenger for many, many years. Several years ago I had invested money with him as I had hoped he would outlive me and be a primary investment vehicle for my wife (when the need arises). But the best laid plans go often awry. Today I have found no one to replace Terry as an investment adviser for my wife, but I’m always on the lookout.
I use the Hurst cycle software to show the past and future cycles and find it to be an valuable aid in anticipating possible bottoms. Any time we begin an extended decline, I am looking closely at the Hurst cycles. The wave count combined with Hurst cycles can give anticipated stopping points. You can find many charts and comments on this subject in my blog under the category “Cycles”.
I recorded a LOT of audio and charts from Terry during his “golden” age that I have not published. Someday I need to find the time to re-post it in my blog with an index of his reports. Meanwhile it sits gathering dust.
Bob
LikeLike
April 8, 2013 at 5:48 AM
Hi Bob.
Regarding the T-Theory, do you do it based on periods of under performance and superior performance on the advances and declines, or are you looking at price alone? I saw your page on stockcharts and am I correct to assume that those large oscillating waves are T-Theory waves?
Thanks in advance!
LikeLike
April 5, 2013 at 7:14 PM
Hey, that makes two of you that are listening.
That’s a sure sign of complacency.
Bob
LikeLike
April 5, 2013 at 2:21 PM
I am still listening. Thanks for your in-depth and objective analysis. I am still mildly bullish until the end of this month, but my finger is already itching and hovering over the sell button.
LikeLike
April 5, 2013 at 1:23 PM
For what its worth I think this is just a correction to 1520-1530 on the way to your 1600. Your Daily ADX buy/sell signal- chart 40.1- is still on a buy since mid Nov. Of course I could be completely wrong.
LikeLike
April 5, 2013 at 1:08 PM
Thanks Bob I’m still here.
Here’s a chart from an Astrologer calling a top 5/5/13 https://docs.google.com/folder/d/0BwXQGeKSOmgpLVhfb29DYnhZMUE/edit?pli=1&docId=0BwXQGeKSOmgpb1ZXZVRMRmhORzQ
Who knows!
LikeLike