04/03/13 – Warning

MARKET MESSAGES
4/03/13 . . .
Not A FORMAL Sell . . . But An Alert For A Peak.
This could be a temporary peak and I am alert for this possibility, but at the moment, things have “kinda” fallen into place. An extension is certainly possible but until that happens, I am on high alert.
Previously I was a cautious bull, cautious only because of the count. Everything really looked good except for the extended and late count. This warning could possibly be a false alarm. Chicken Little, Chicken Little (been there done that). The count on the following chart is ambiguous because the SPX chart shows a definite count of 3 and the ES chart shows a count of 4. If the count is a 4, there will be another rally back to the prior highs.
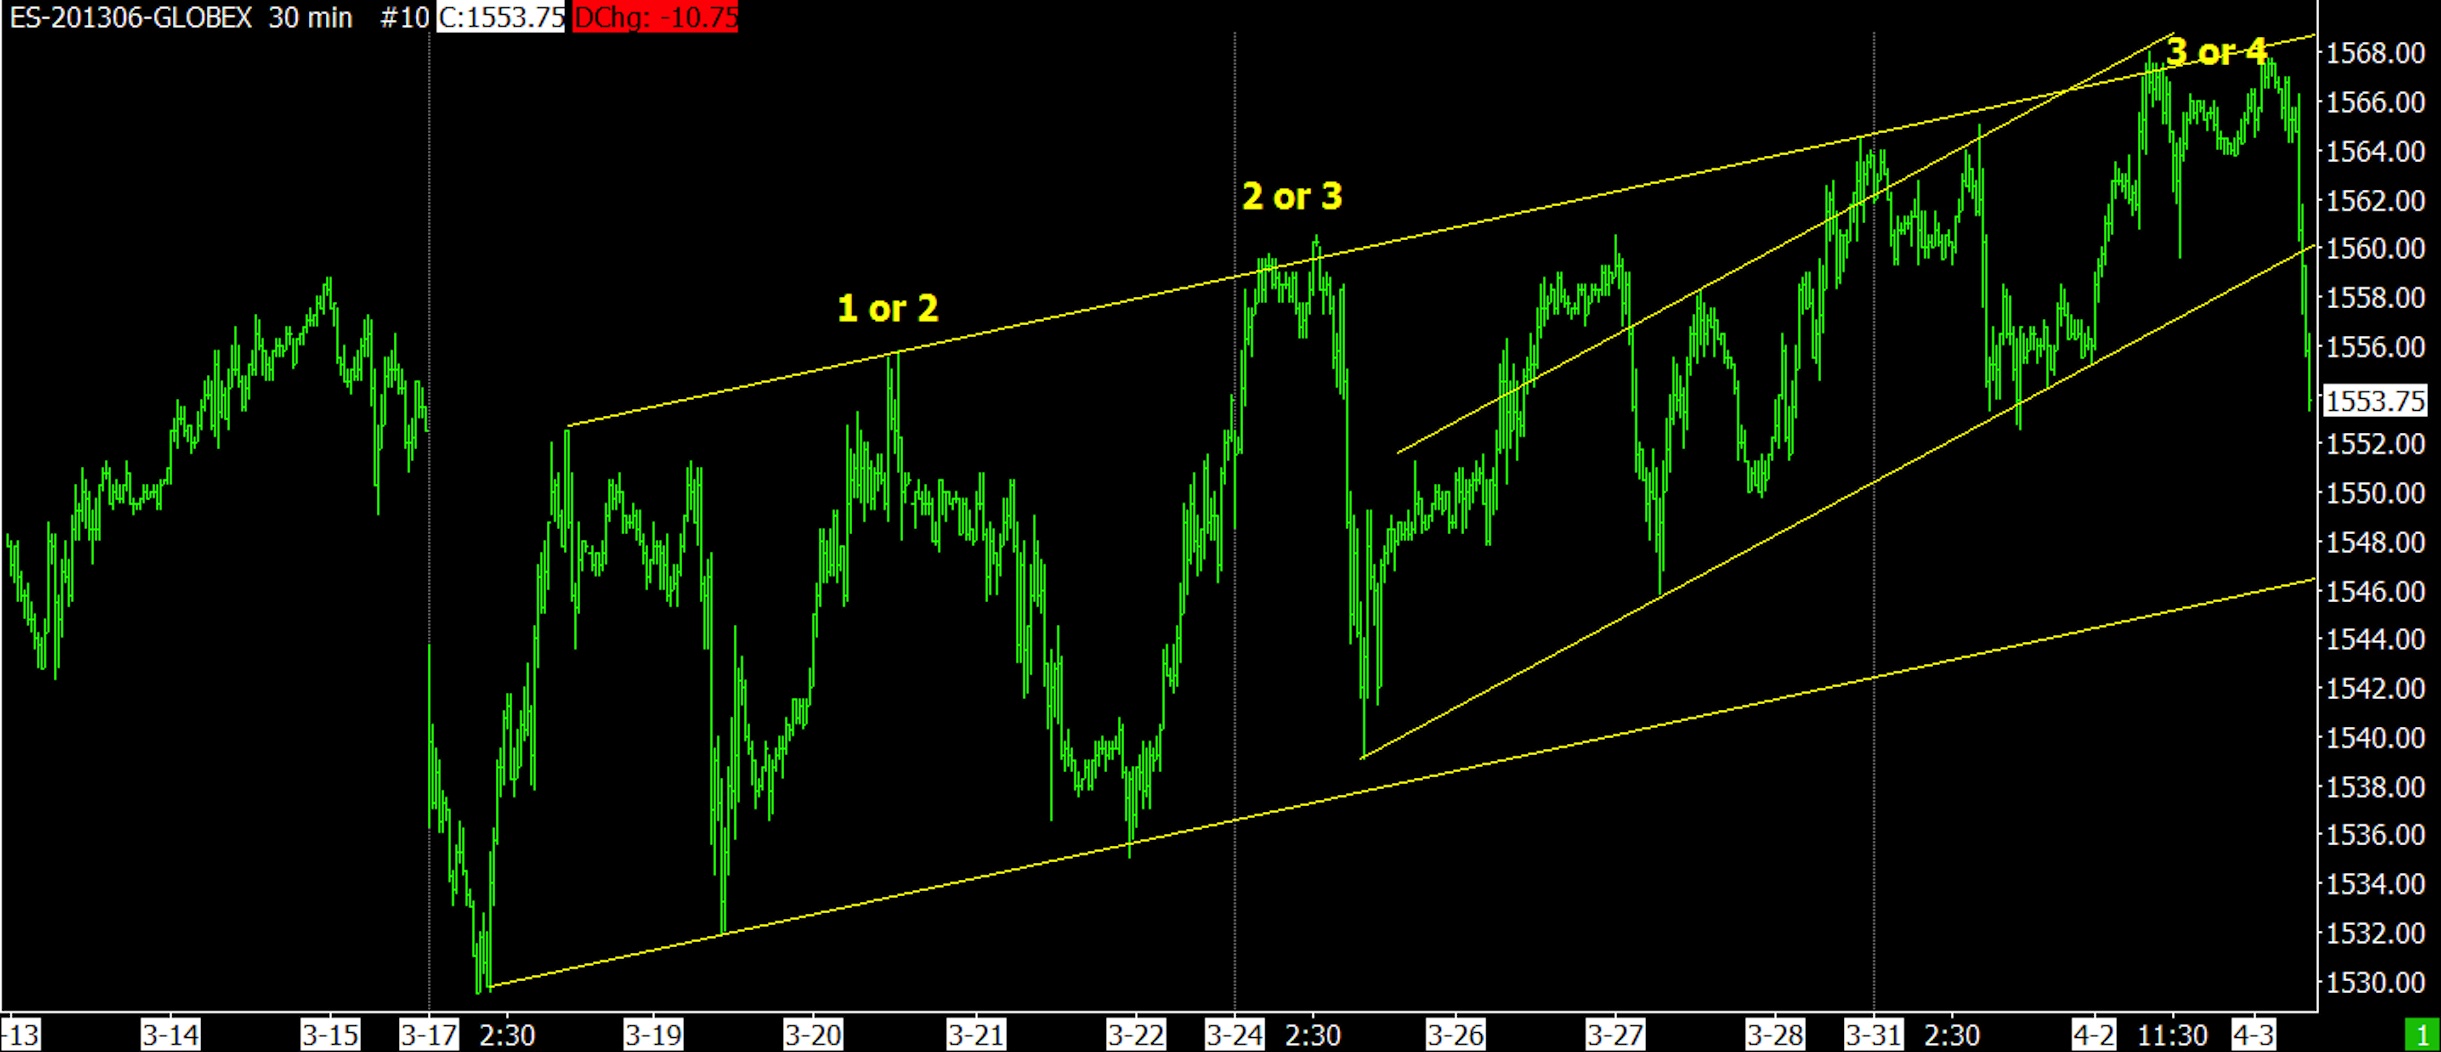
ES JUNE 30 MINUTE BARS 04-02-13
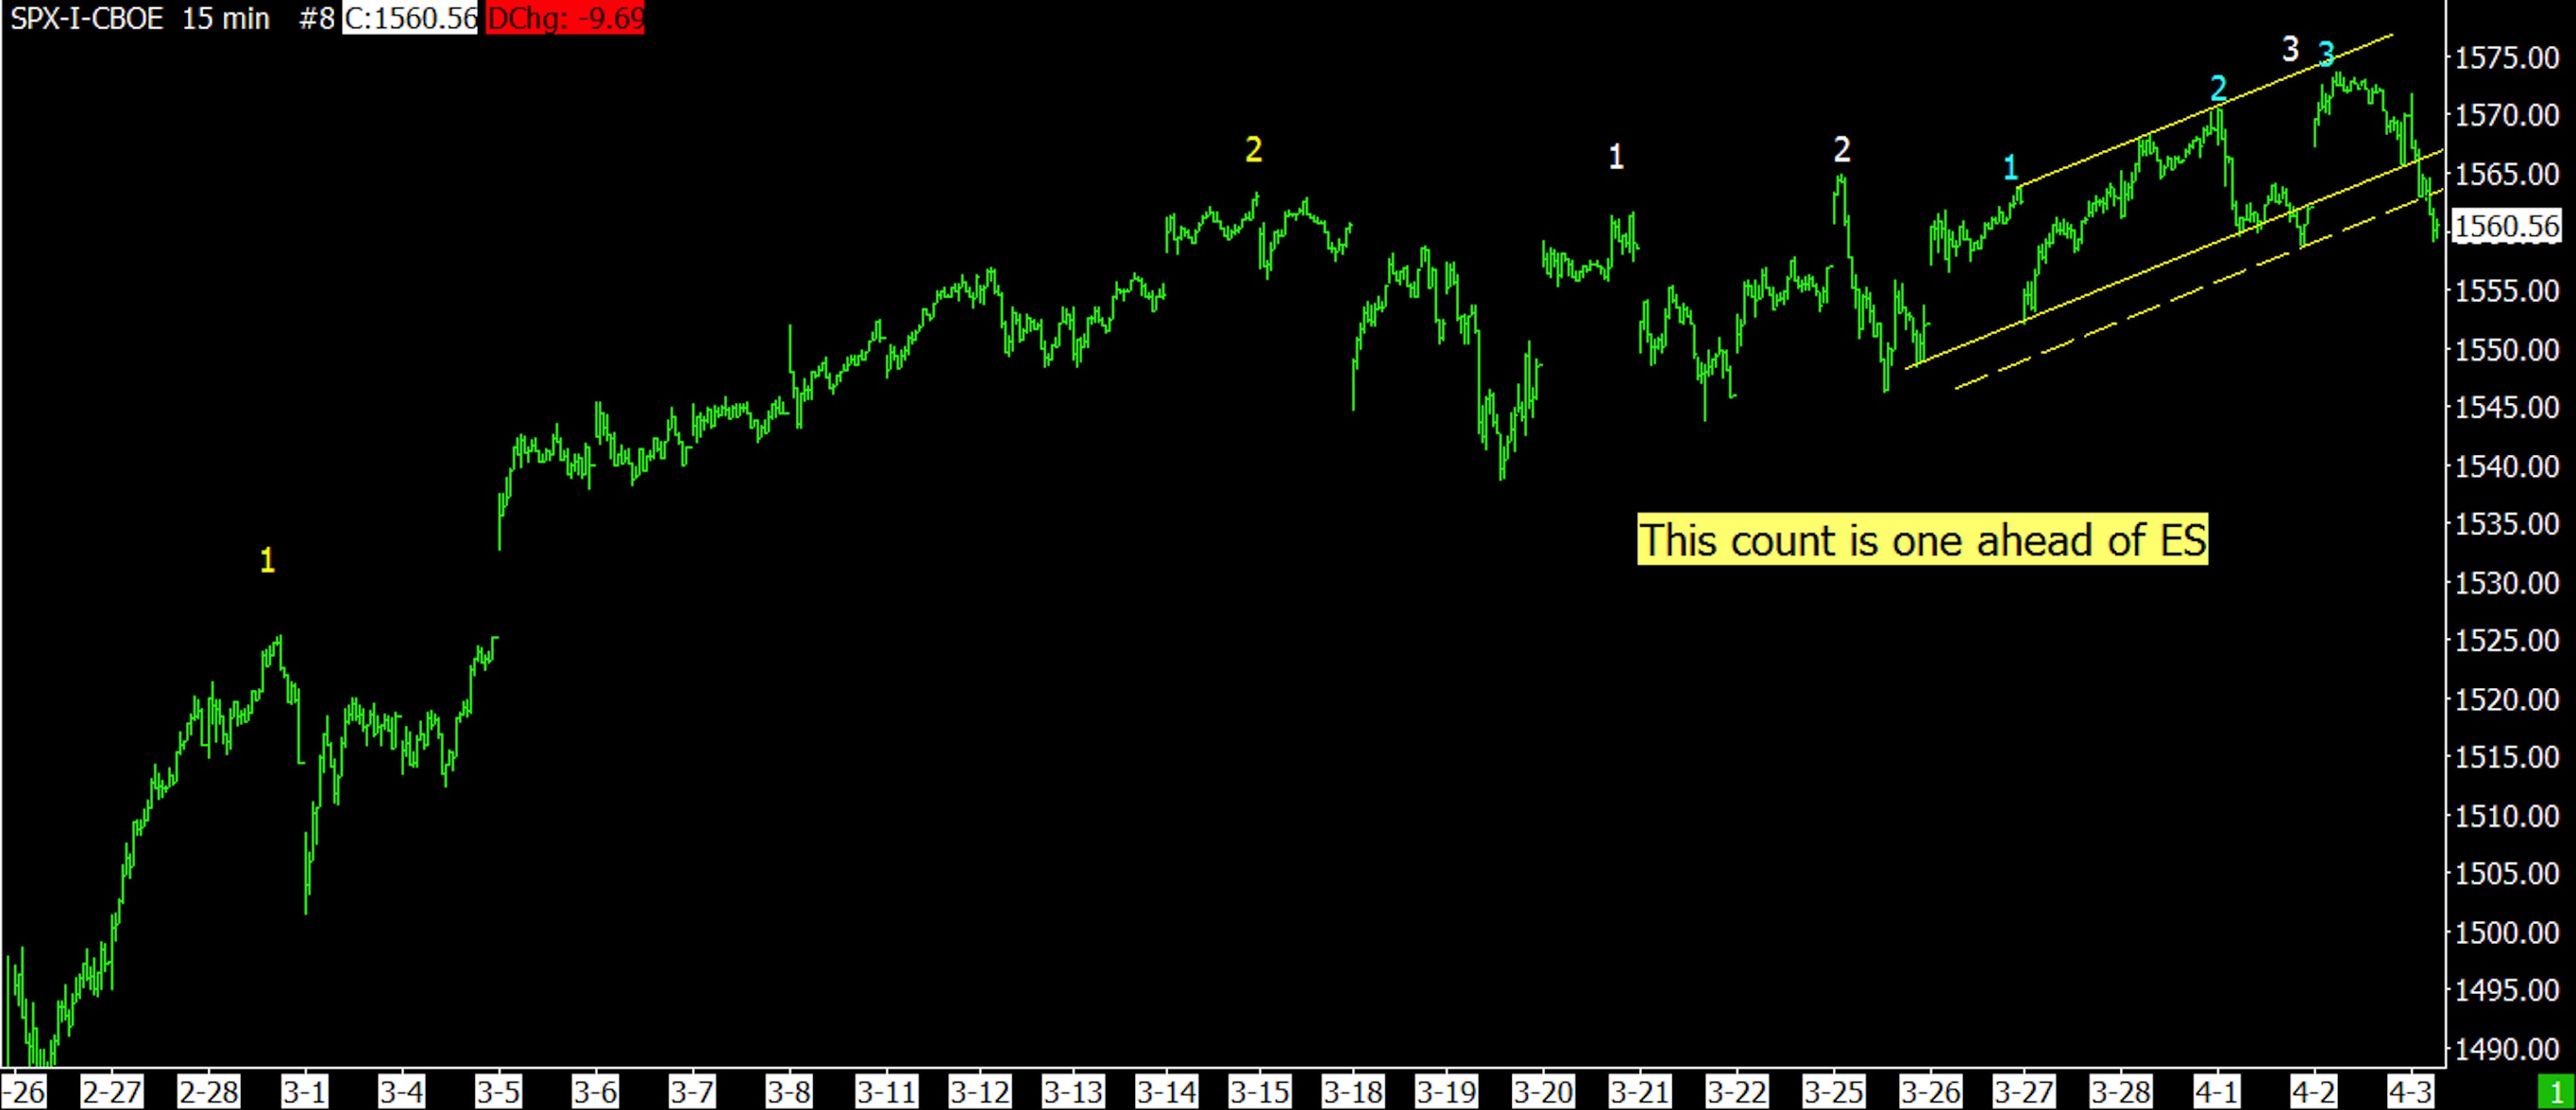
SPX DAILY 04-03-13
The reason for the discrepancy between the SPX and the ES futures is the ES is open almost 24 hours per day and sometimes, more squiggles take place than the SPX. Usually the ES count is quite clear but presently we have a problem. I have relied on the ES to usually give the correct count. The discrepancy is the reason why I haven’t issued a formal sell signal. It’s simply a warning and everyone should takes a comfortable action or inaction.
Presently I’m watching for higher highs to signal a reversal of today’s correction.
I may write more later as things develop.
THE FOLLOWING WAS WRITTEN LATE MONDAY BUT NOT PUBLISHED.
The first two charts are from Arthur Hill of StockCharts.
The first chart shows how the market has corrected each April after the March 2009 bottom.
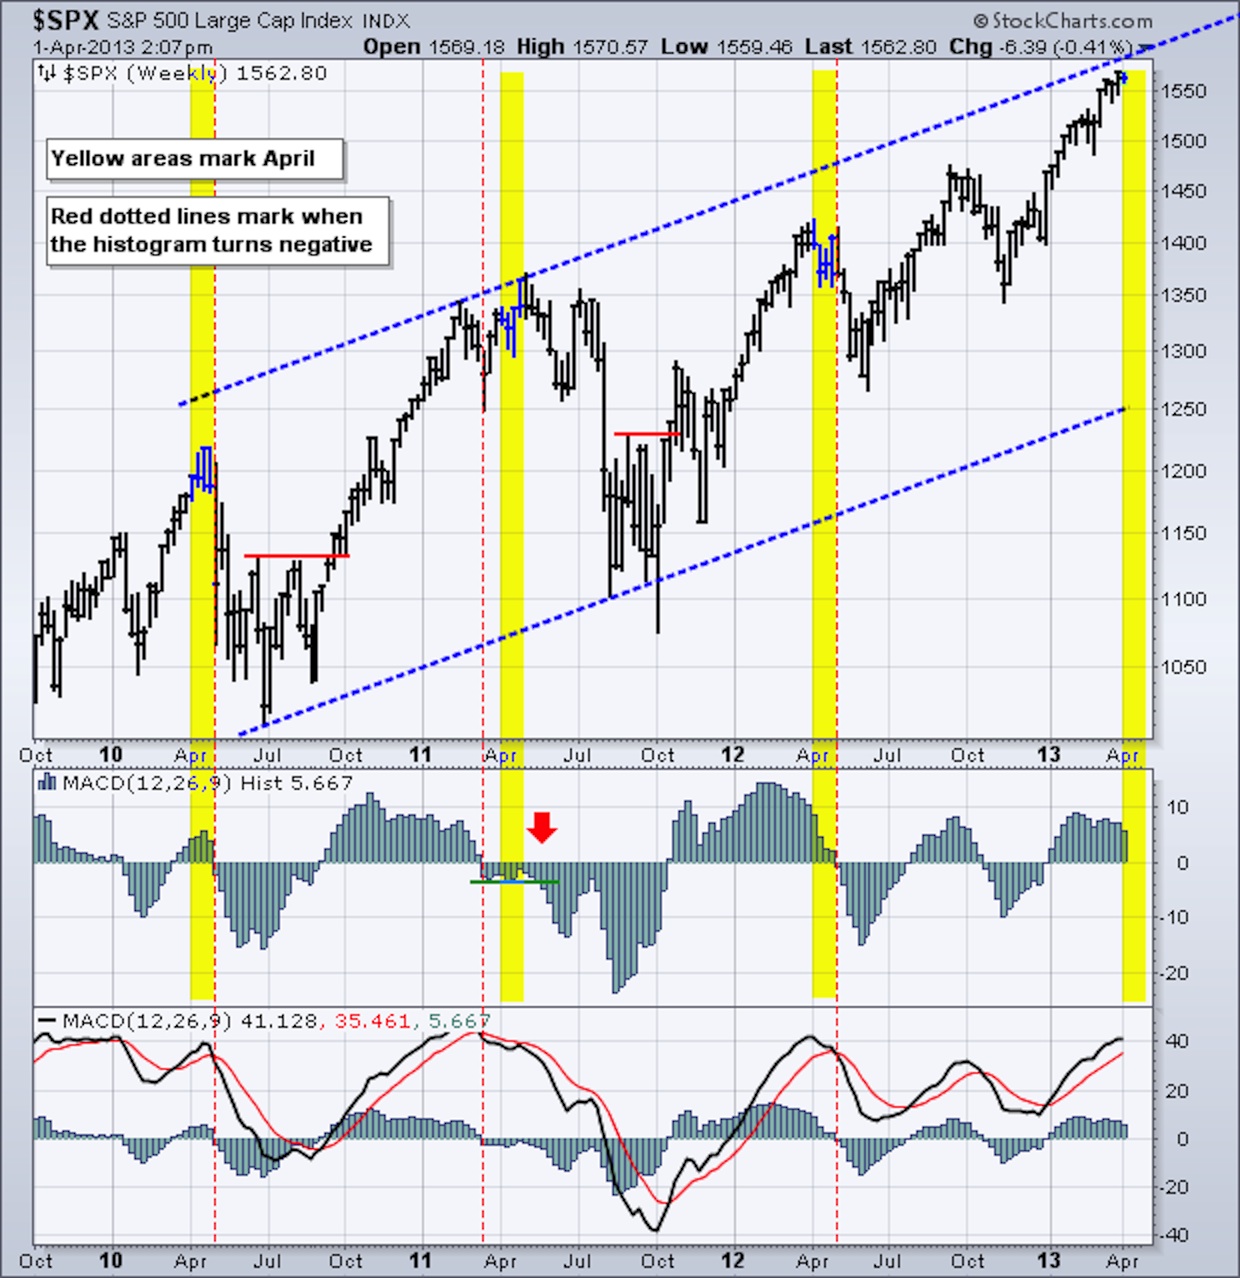
April Peaks 04-01-13
Not every sector is doing well in the first quarter of 2013.
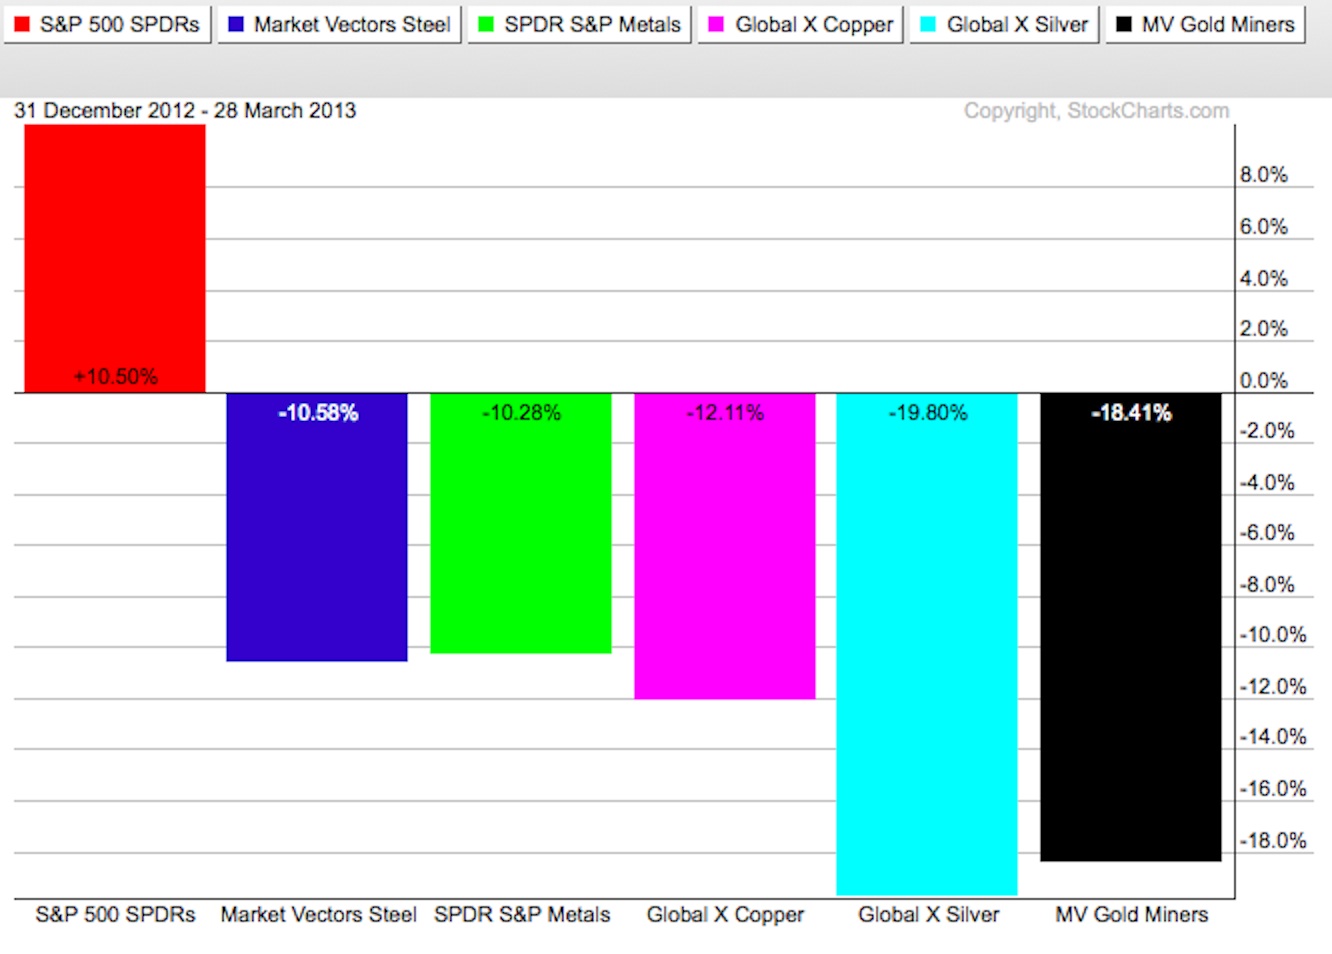
Poor Performers 04-01-13
My Charts – for more of these charts and indicators, see the link at bottom of the page.
The SPX (SP 500) has gone down a couple of points since March 15th (written on Monday). The last couple of weeks the market appears to be going up but it’s actually going sideways.
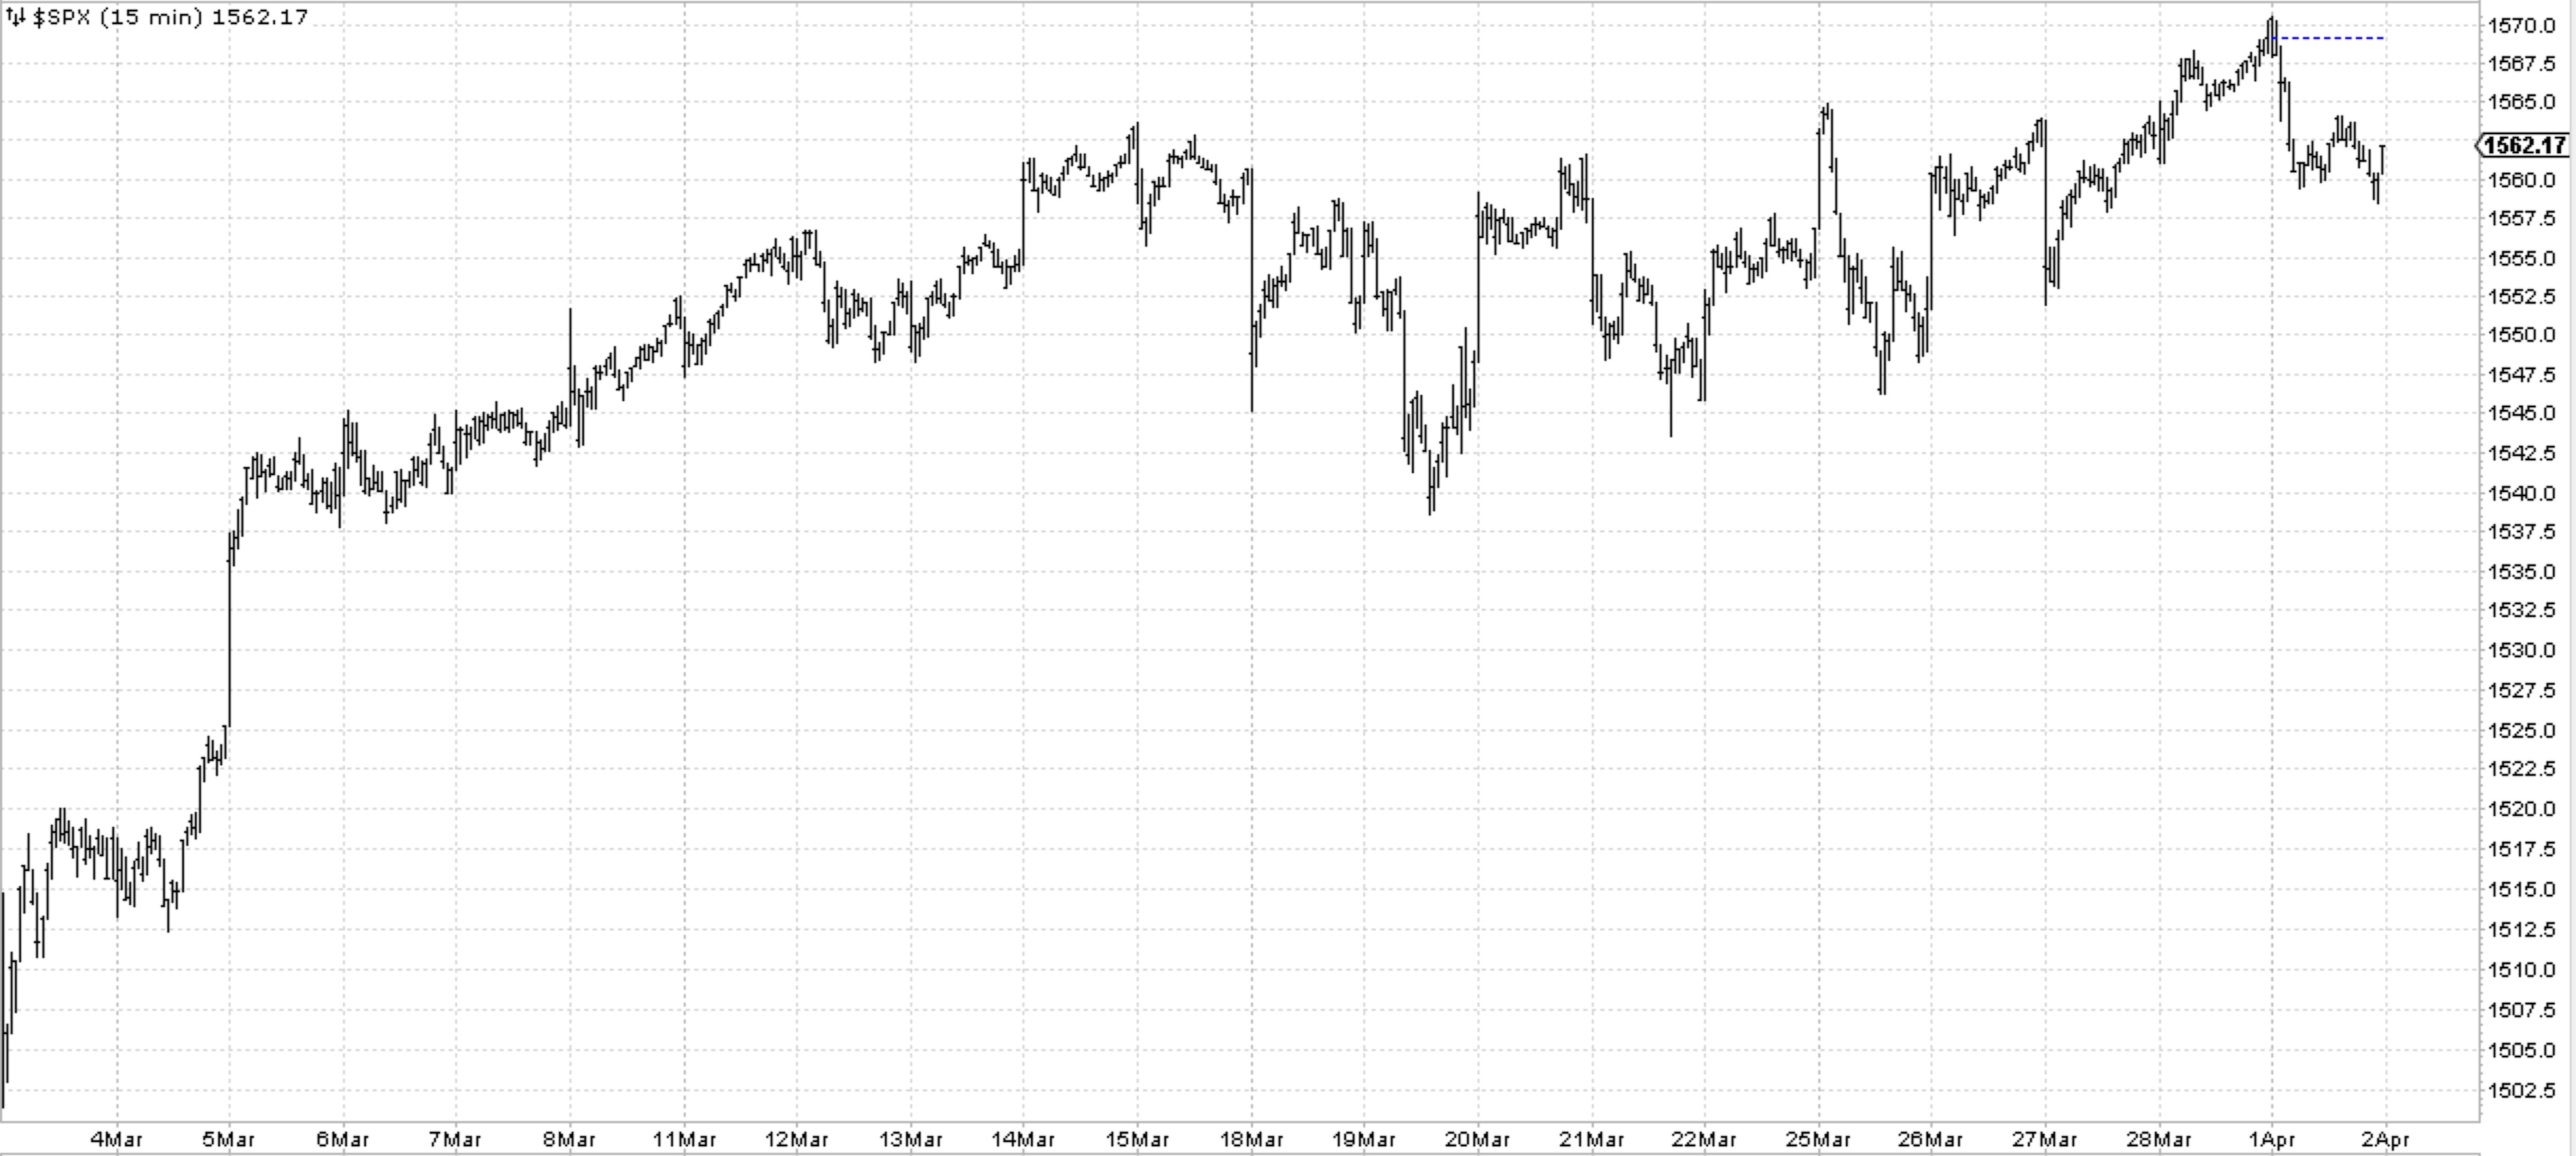
SPX 15 MINUTE – 04-01-13
And a longer term view of the SPX.
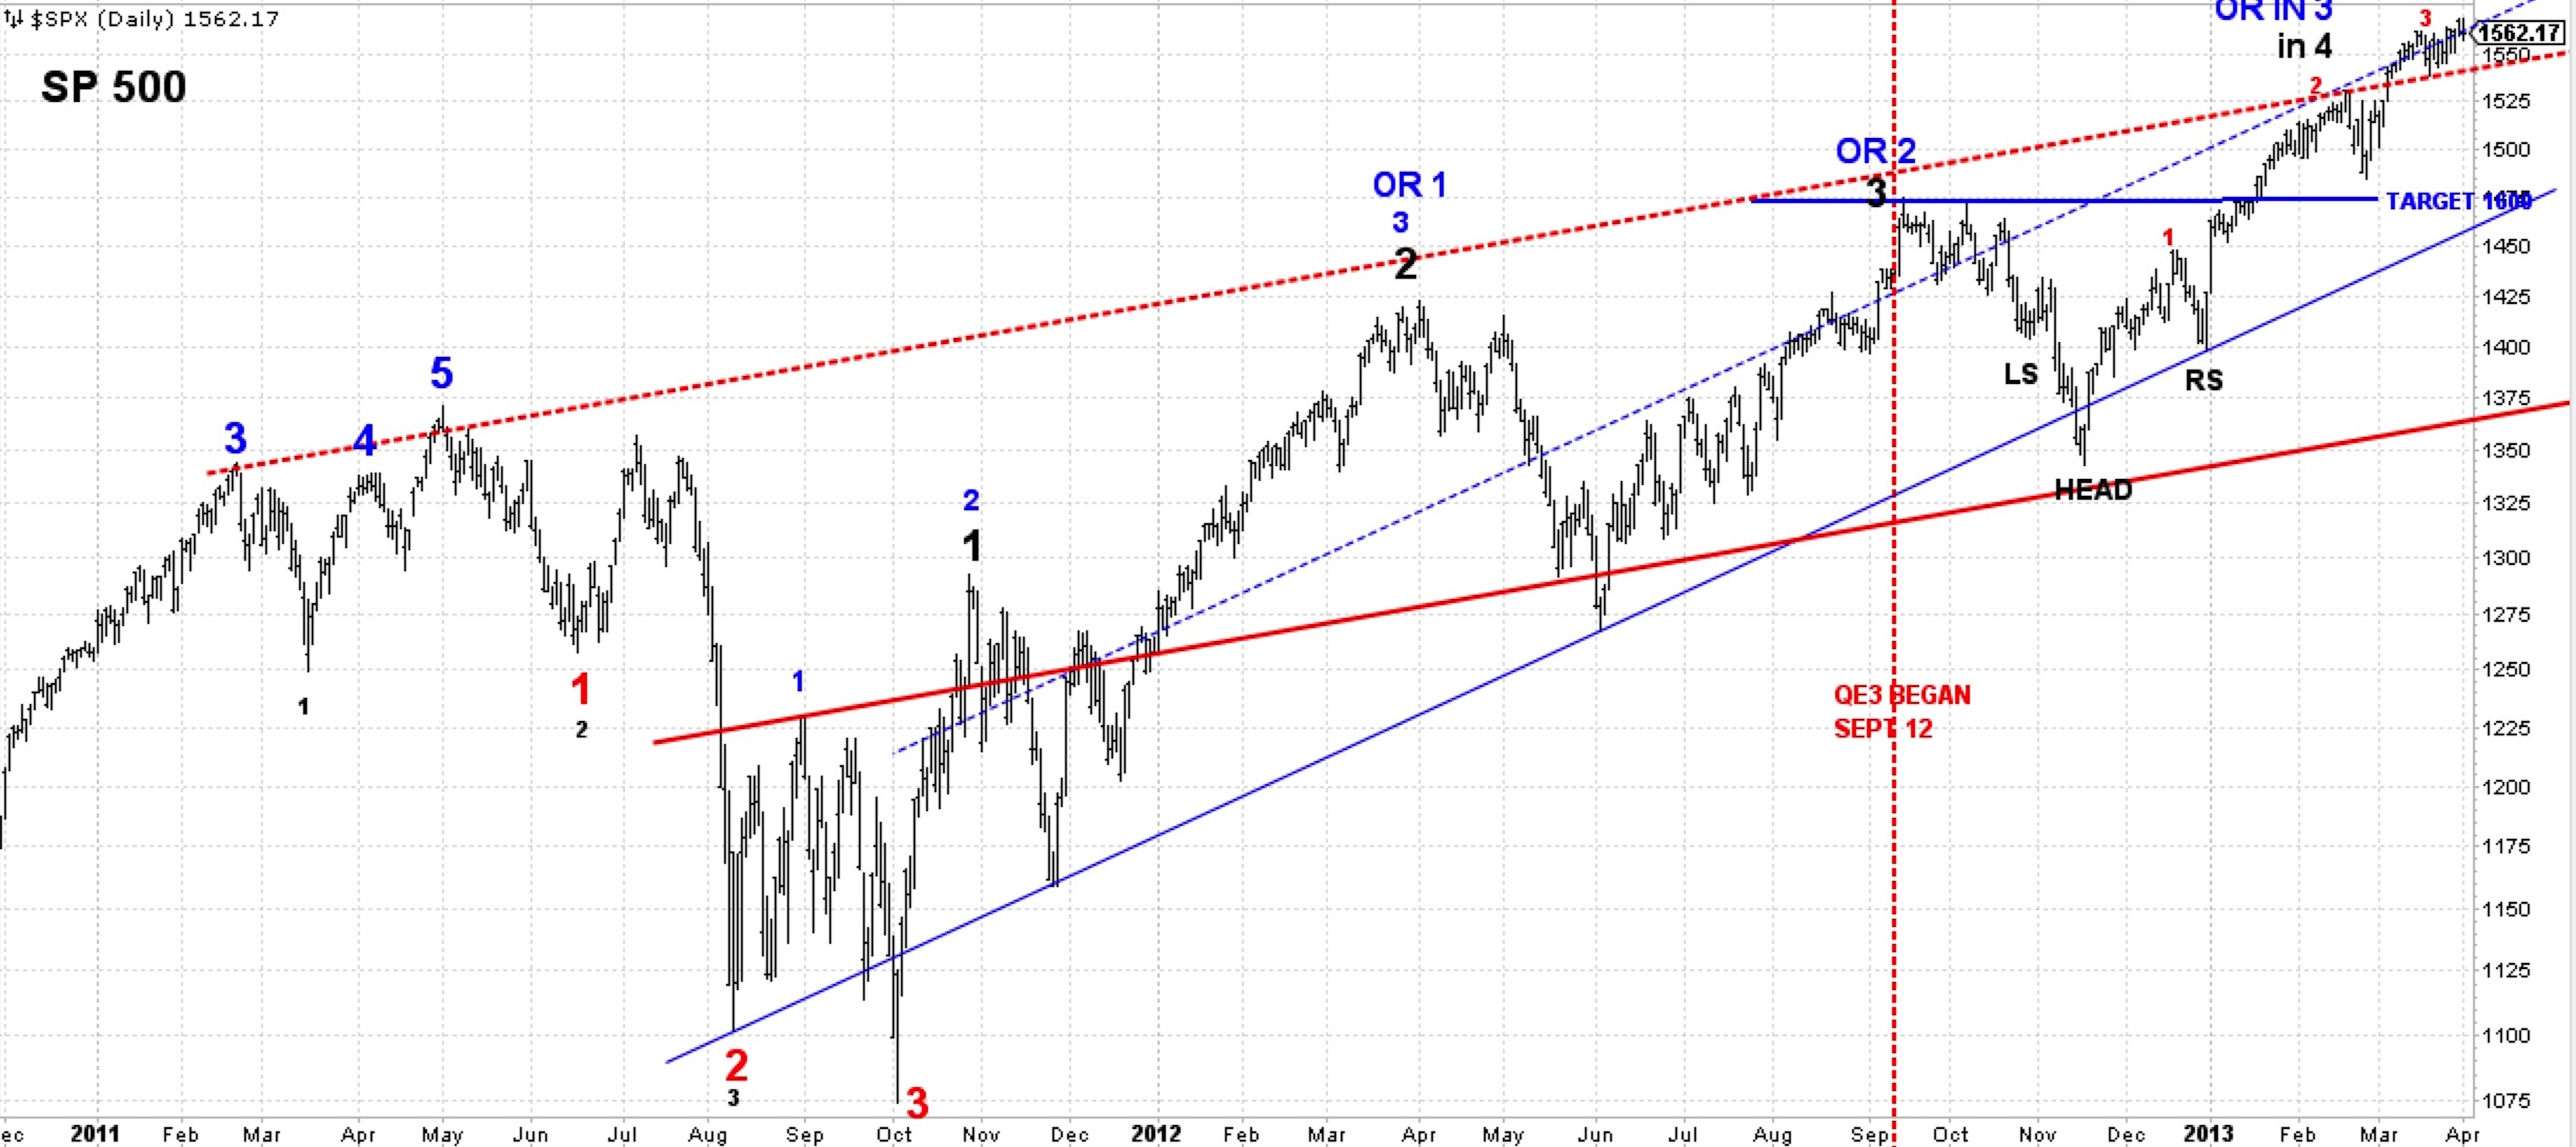
04-01-13 SPX DAILY
Has apple begun its 5th step down? (Monday chart).
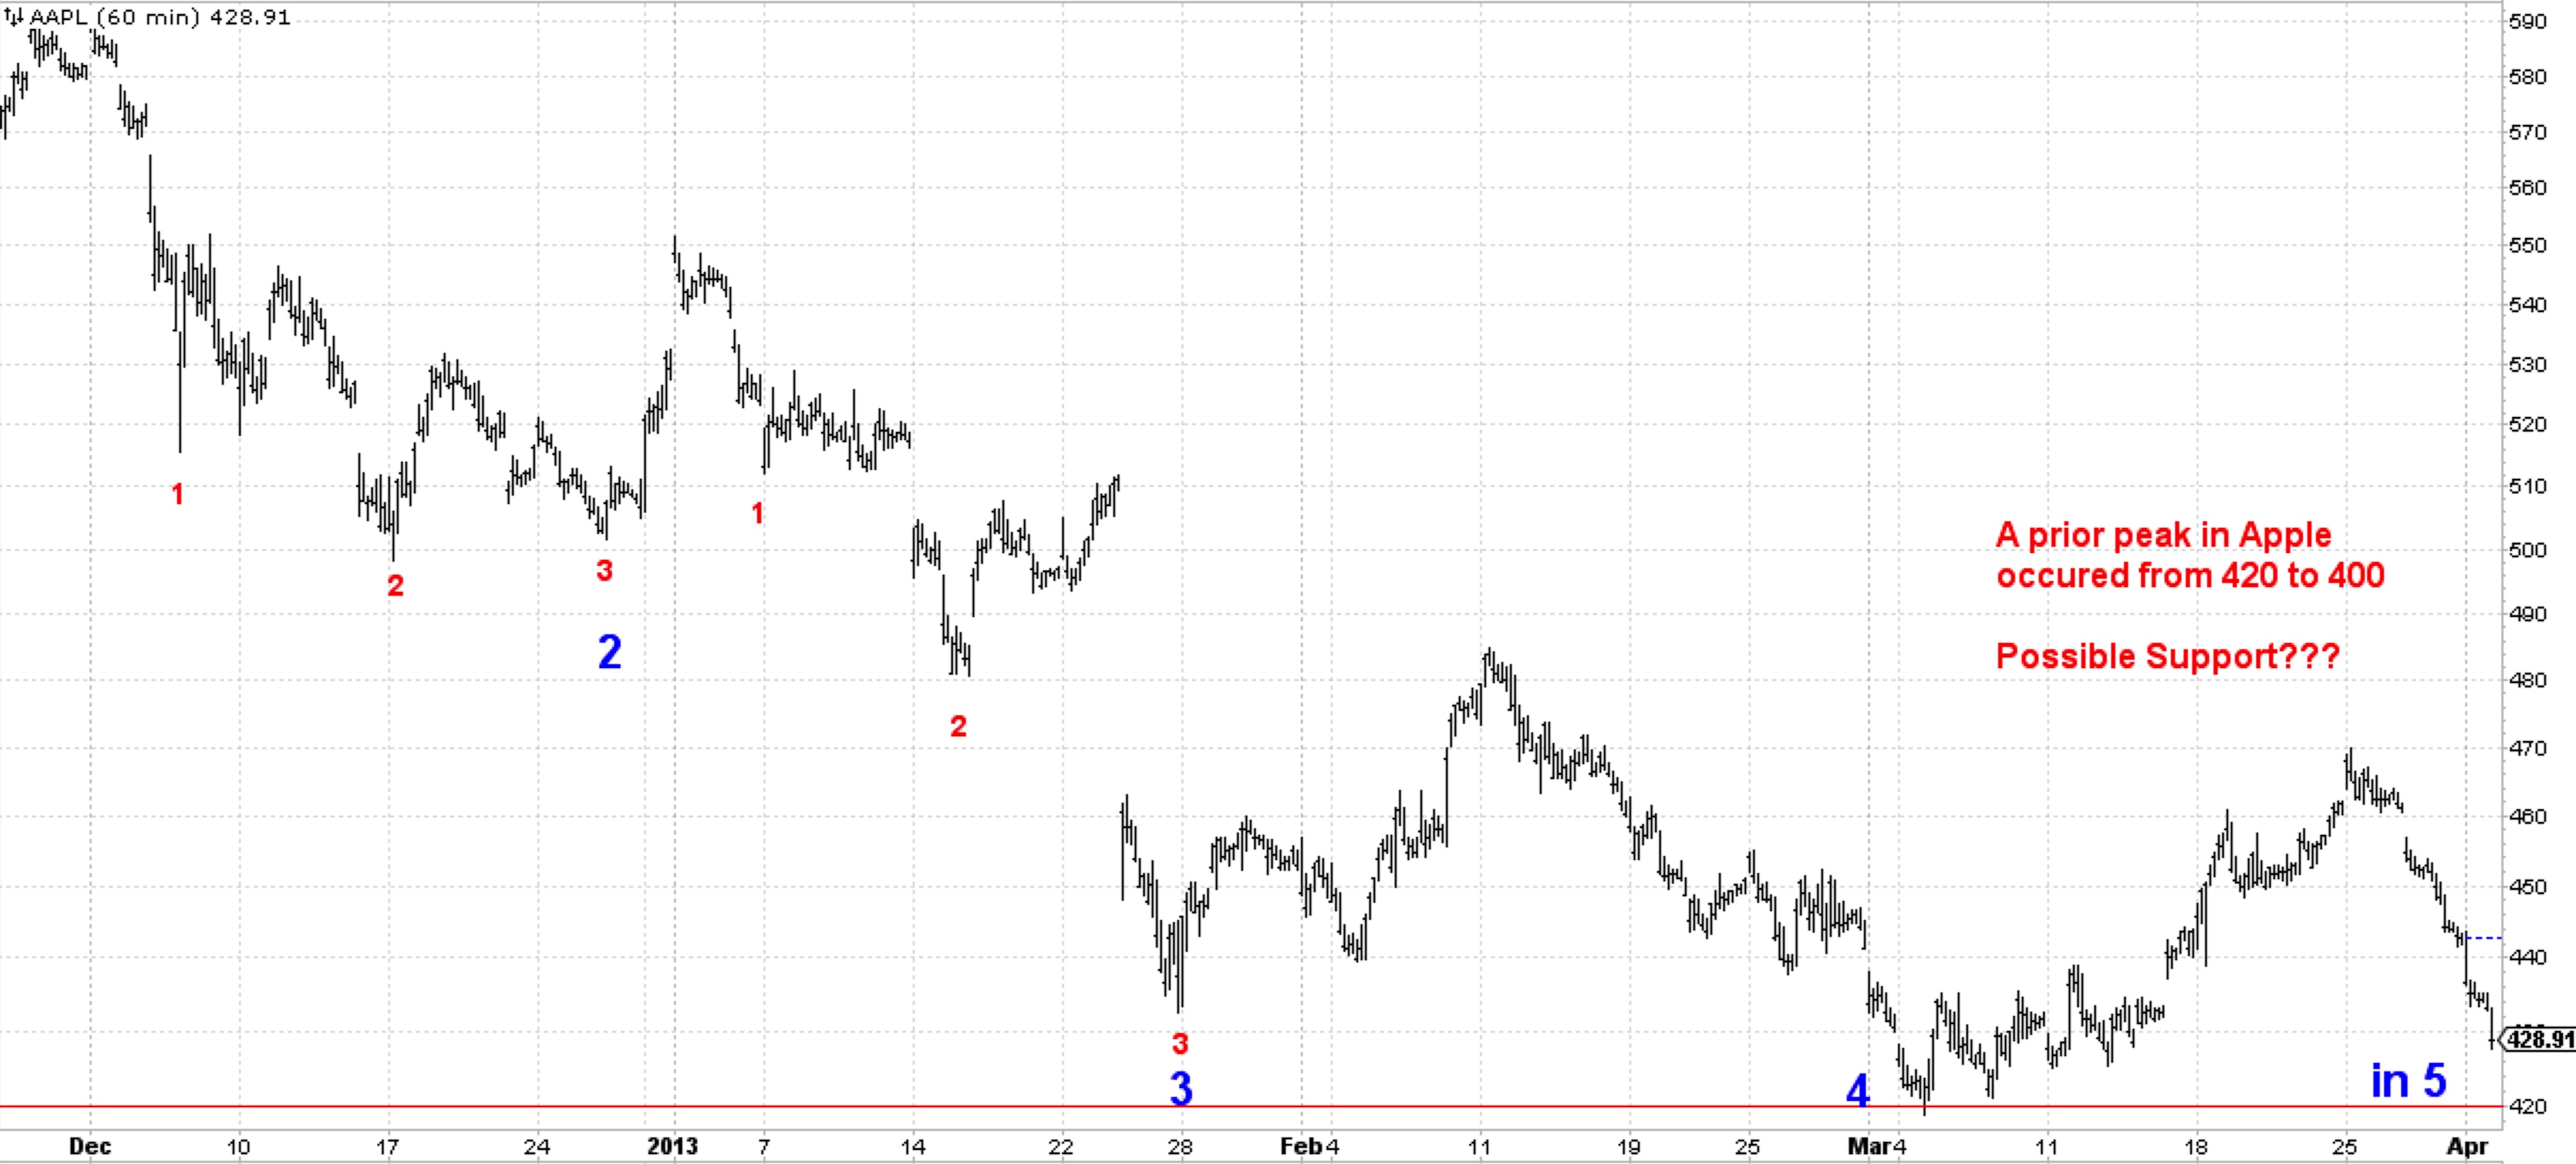
04-01-13 APPLE DAILY
- ————————————————————————————————
- Click on any picture or chart to enlarge it
All Rights Reserved © ™
Explore posts in the same categories: UPDATE, WARNING
Leave A Reply