
MARKET MESSAGES
4/10/13 . . .
Regardless of the presumed count recently, the market still is unable to break the 3rd step channel. Pretty spectacular stuff. We’ll see if there is a possible saw tooth top in the future (or not).
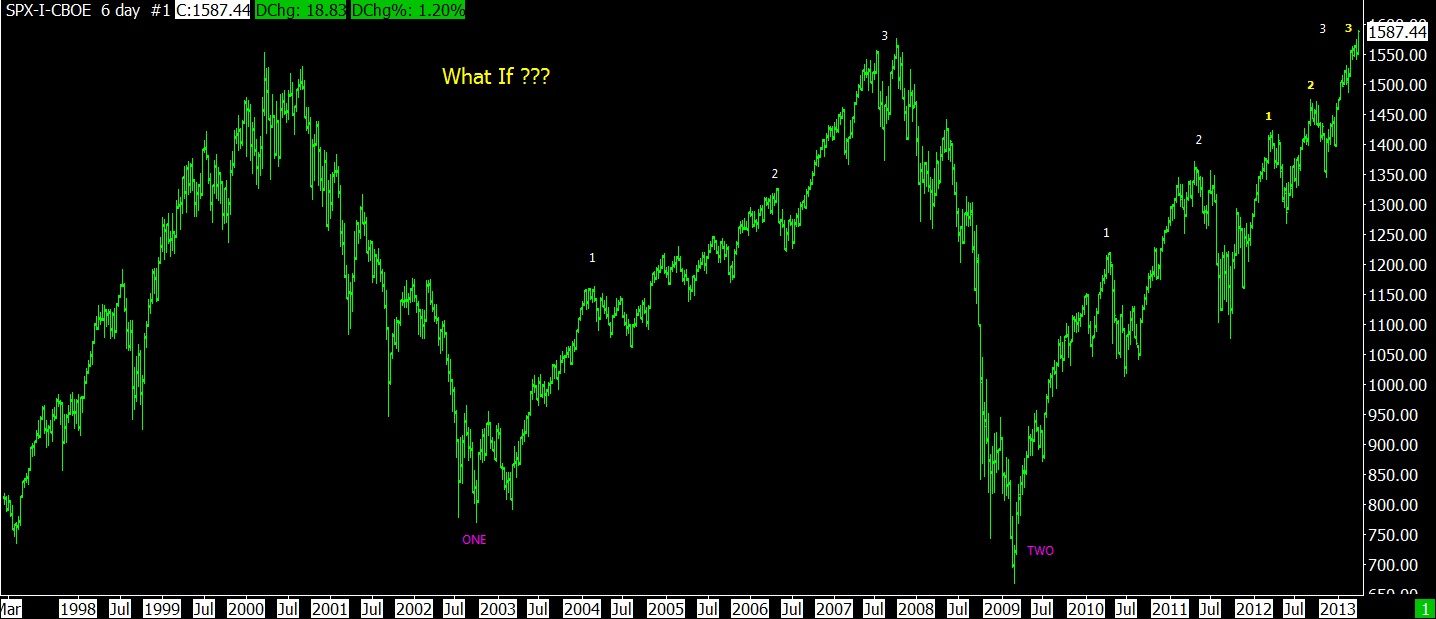
04-10-13 SPX 6 DAY BAR
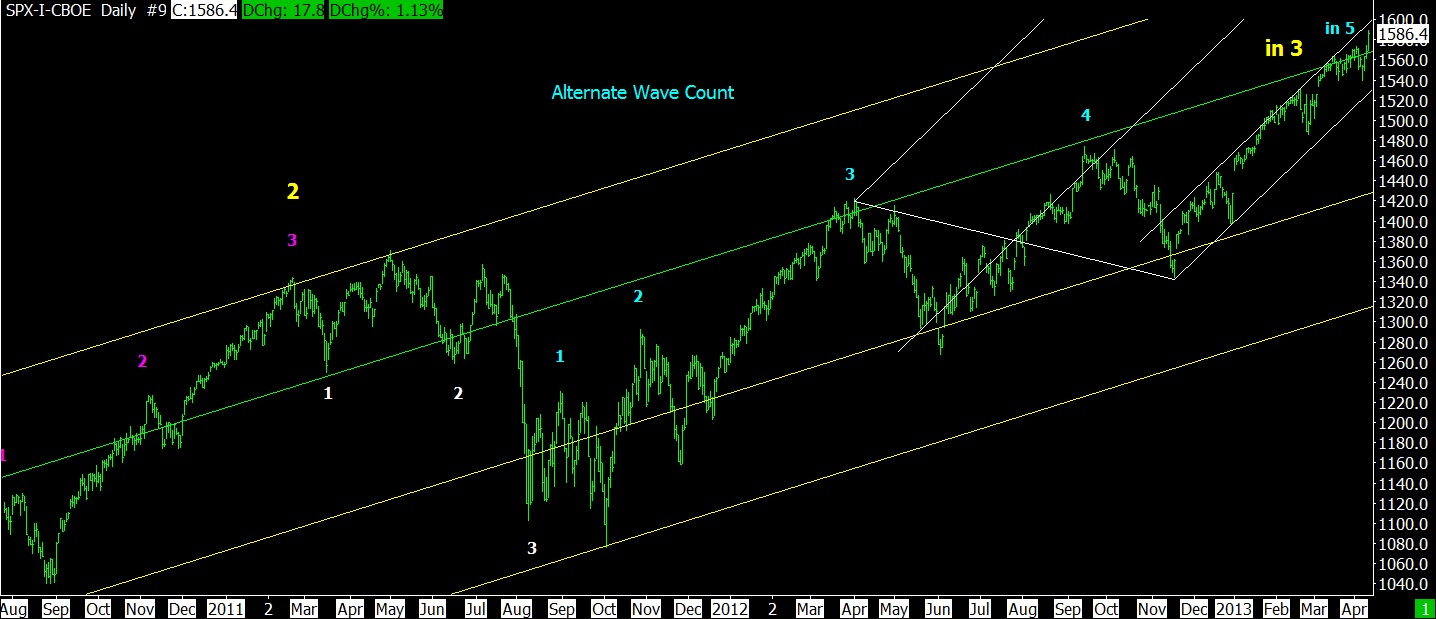
04-10-13 SPX DAILY BAR
The next chart is a close only chart and it’s easy to see the current step 3 continuing.
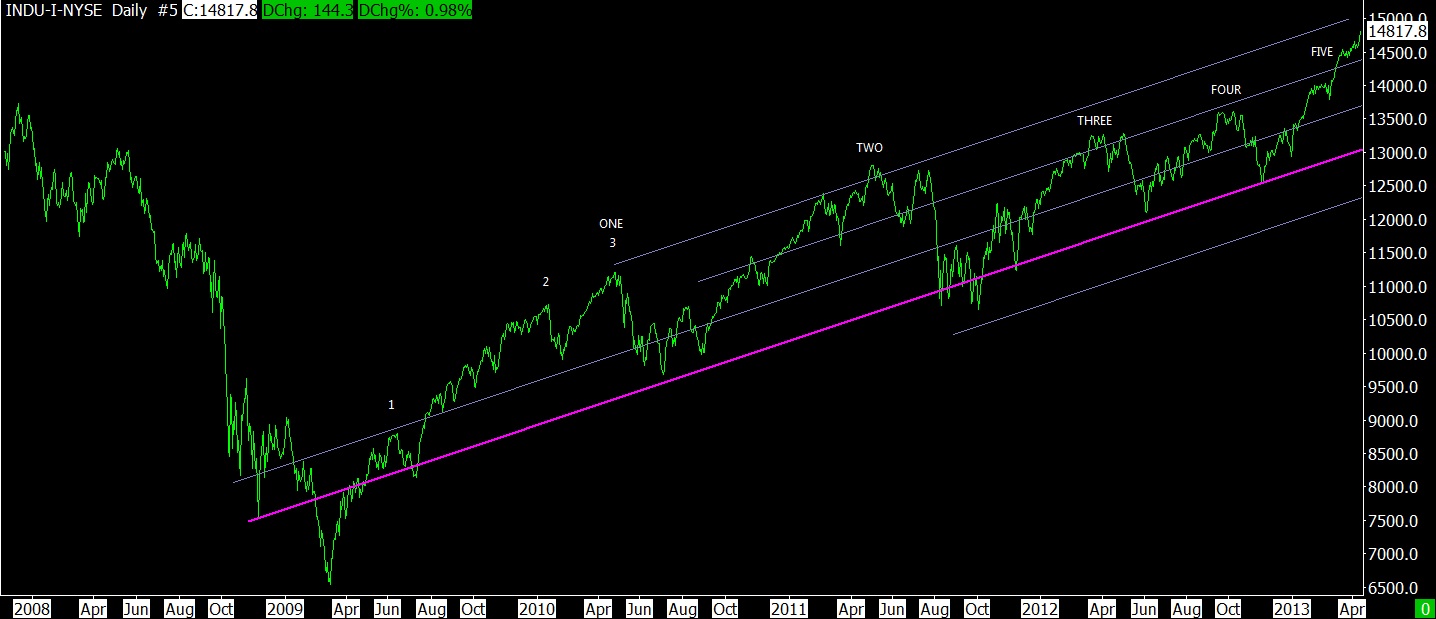
04-10-13 DJ IND DAILY BAR
The market has moved from a recent oversold to almost neutral (last chart in the following group). The charts with the white background always come from “My Charts” at StockCharts.com
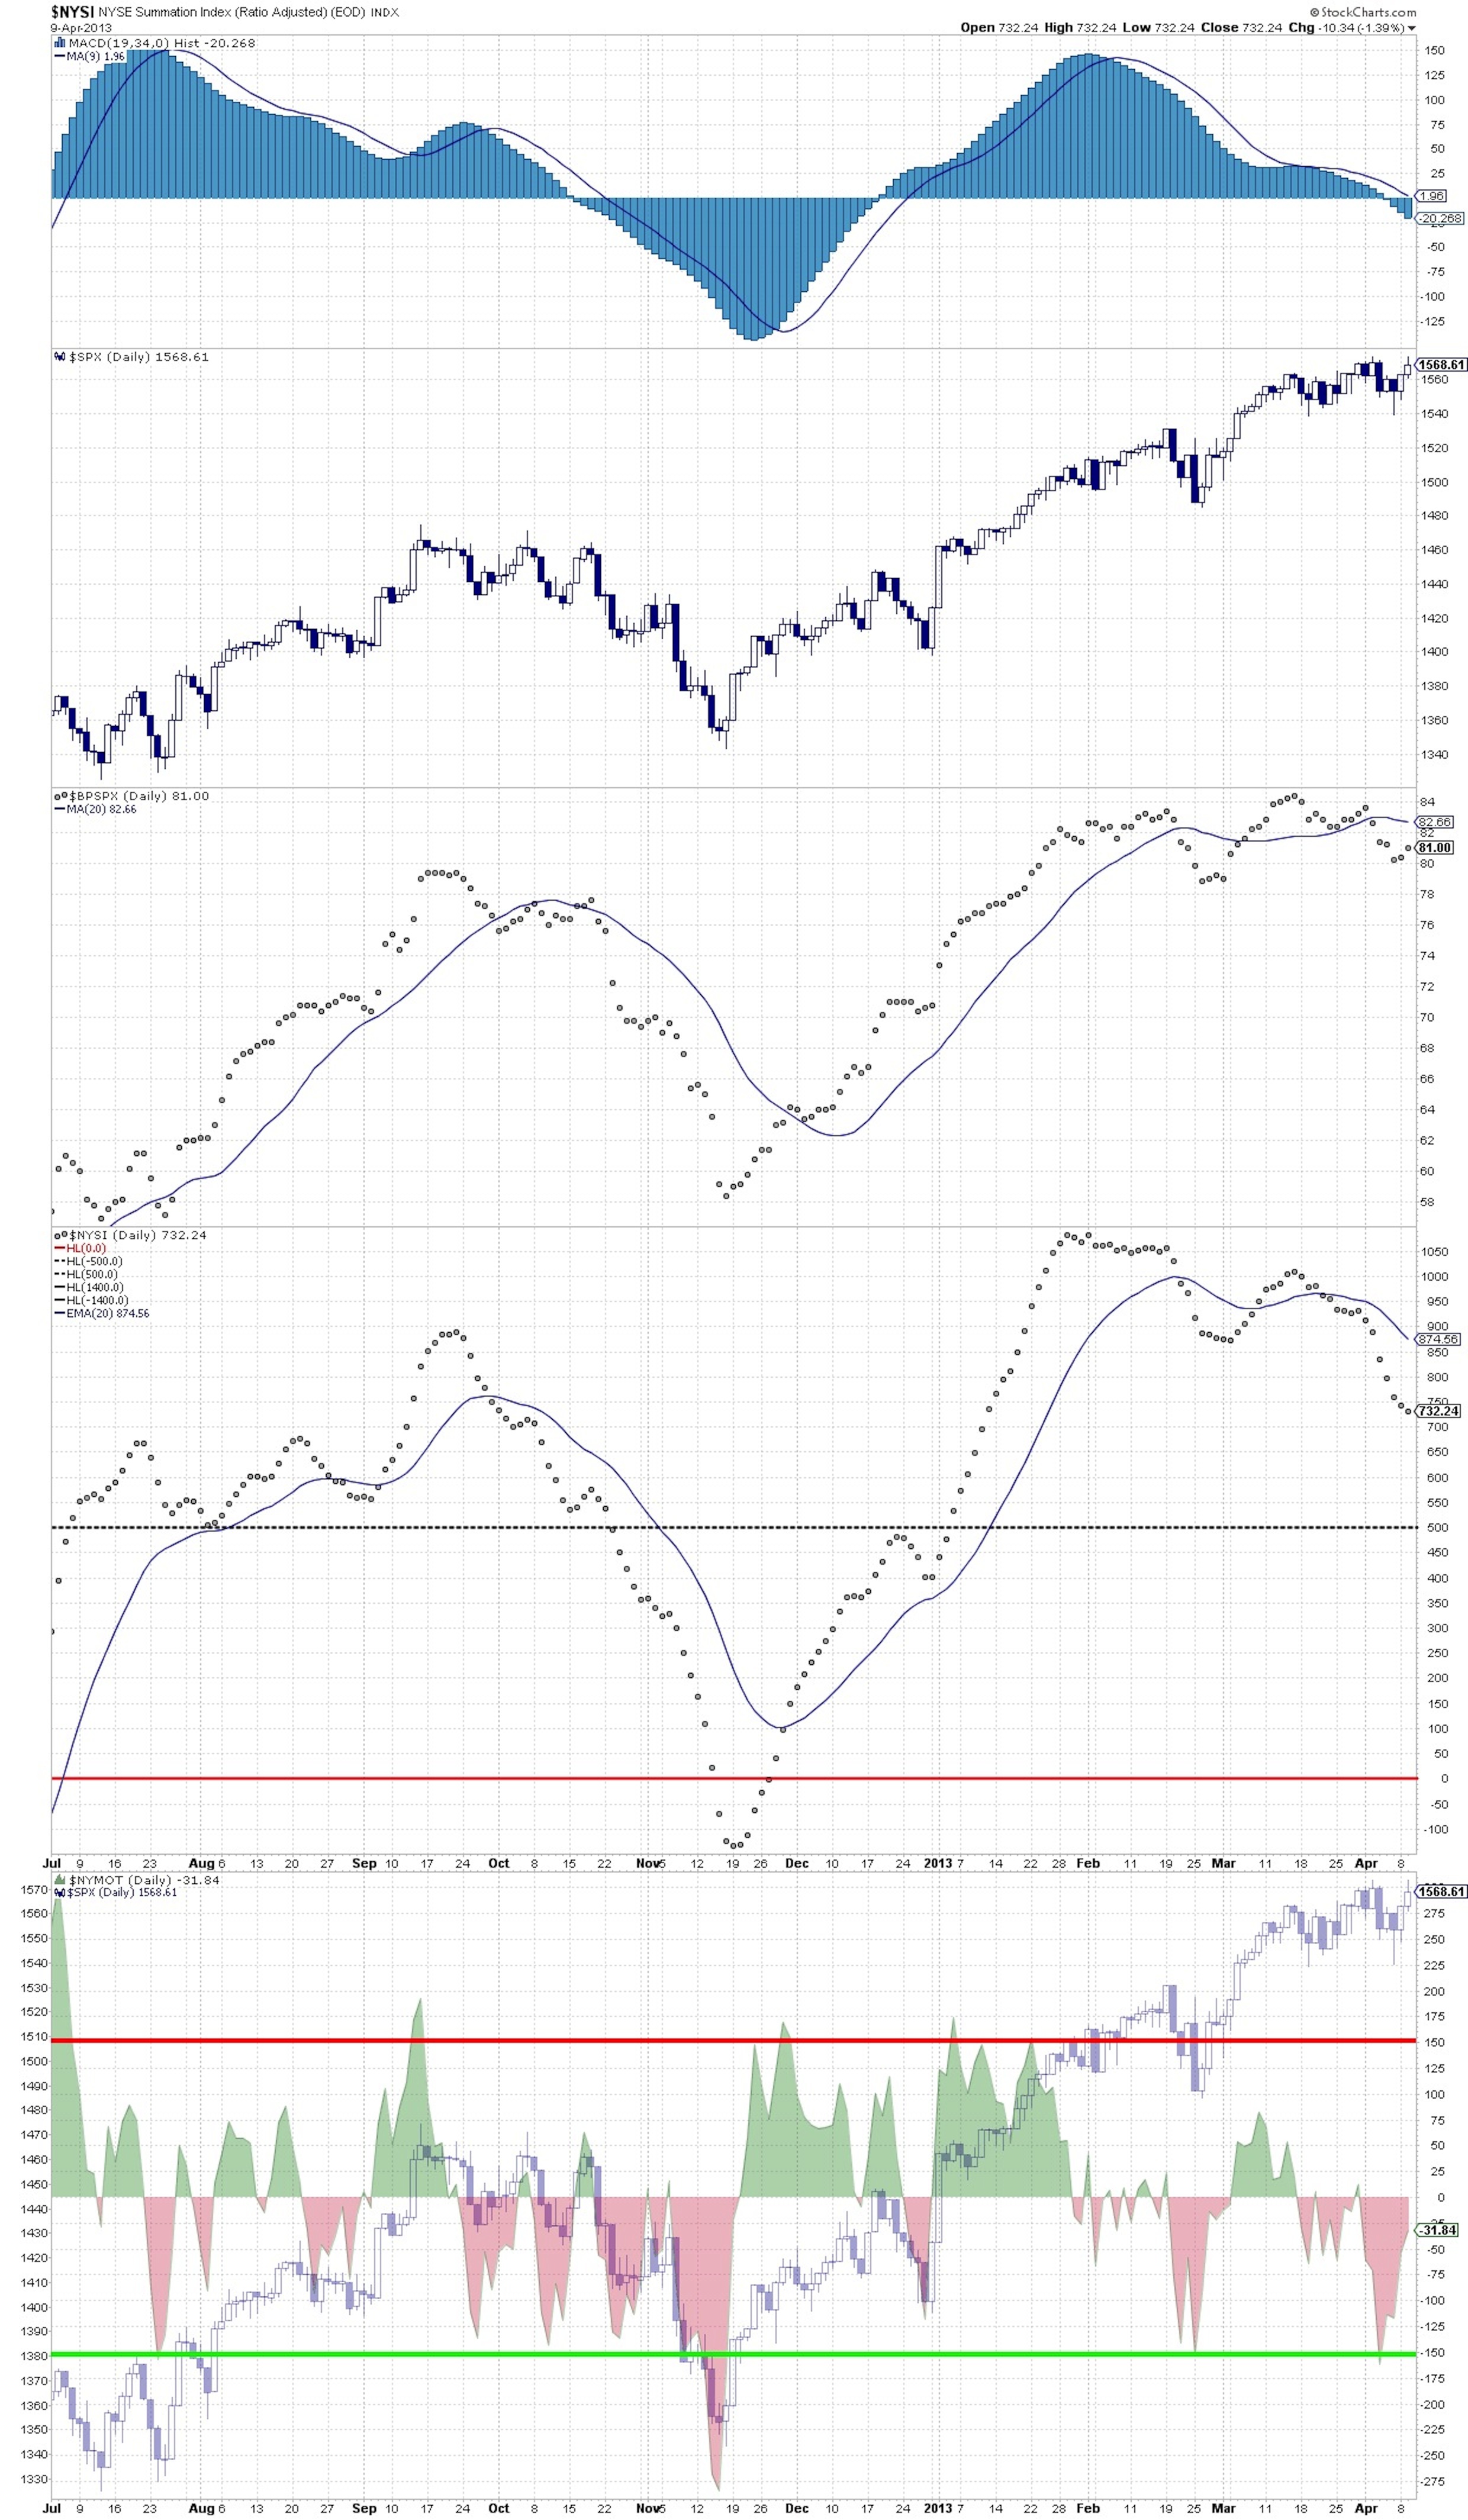
04-10-13 Oversold
The following chart shows the market is hitting (again) the upper limits of the envelope boundaries. That means slower going in the future. But small corrections allow bigger upside bursts like today.
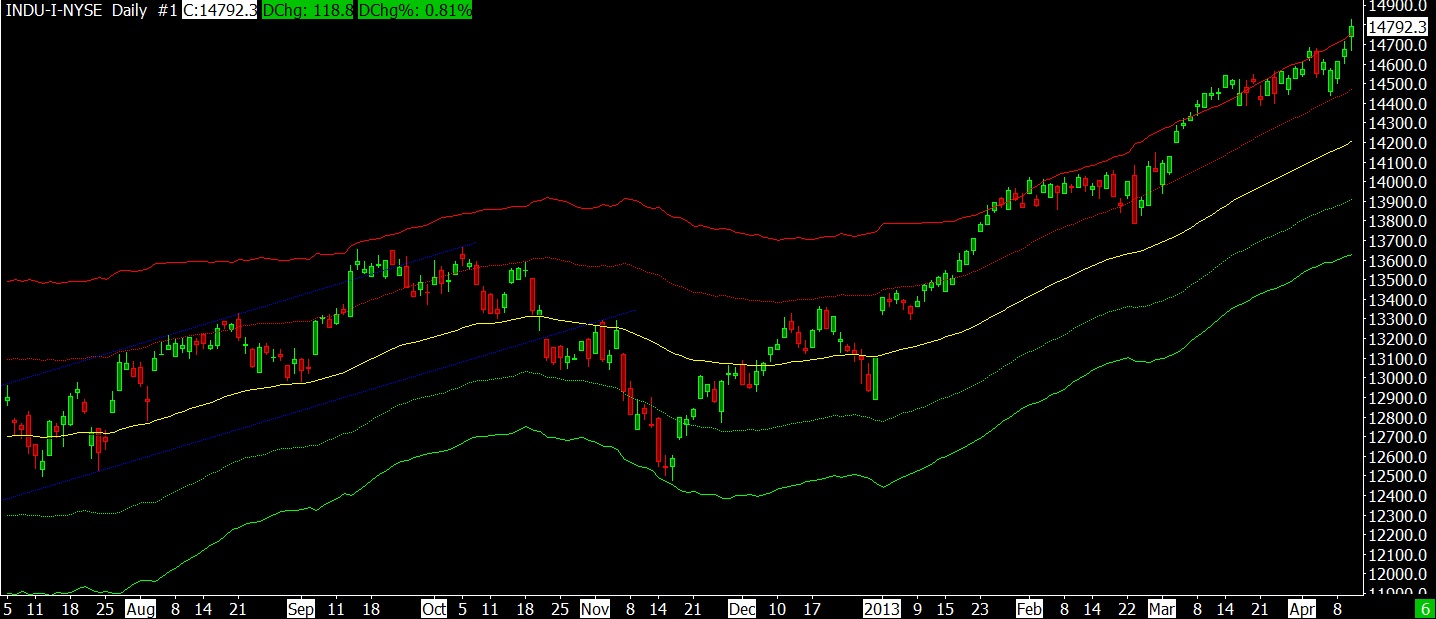
04-10-13 DJ IND DAILY LIMITS
I will give you one day’s alert before ALL of my T Theory updates will be posted. There will be several updates and they need to be separated from anything else I might be doing at the moment. The updates are still days away because there is more to this than I thought. After this group of updates is finished there will be no more T-Theory updates from me.
- Click on any picture or chart to enlarge it
All Rights Reserved © ™
