04/10/13 – Still In 3rd Step

MARKET MESSAGES
4/10/13 . . .
Regardless of the presumed count recently, the market still is unable to break the 3rd step channel. Pretty spectacular stuff. We’ll see if there is a possible saw tooth top in the future (or not).
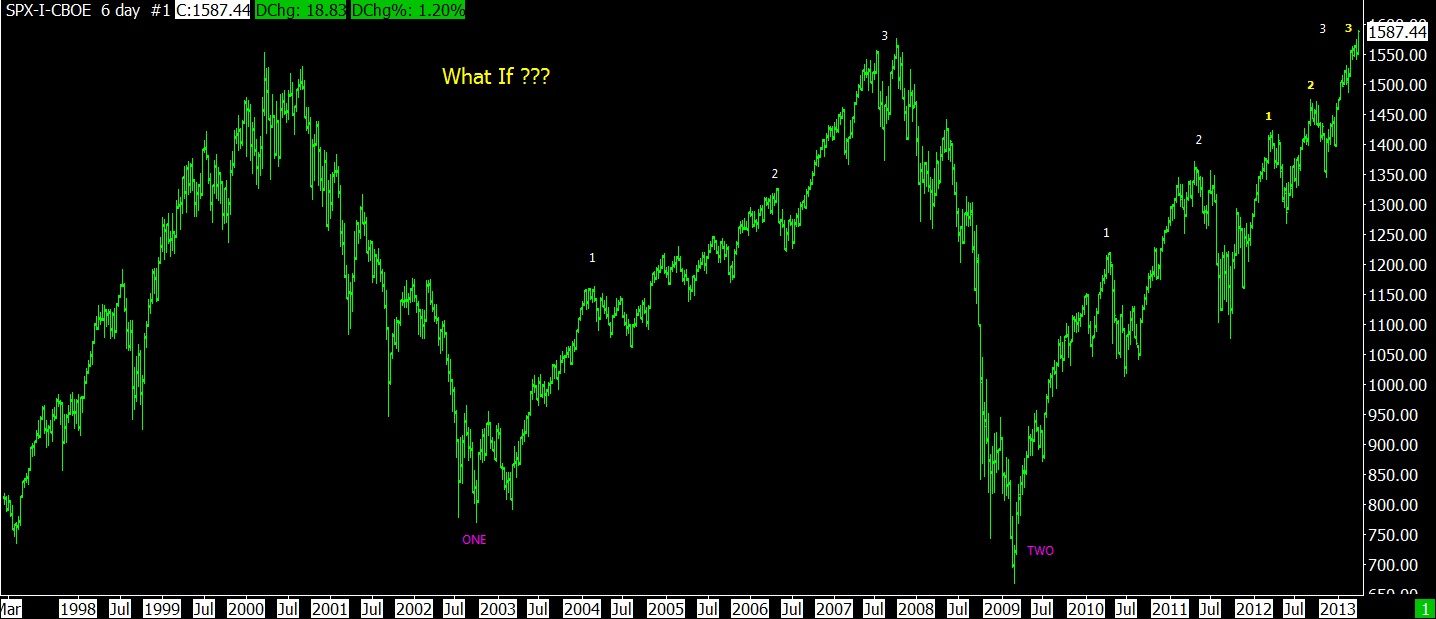
04-10-13 SPX 6 DAY BAR
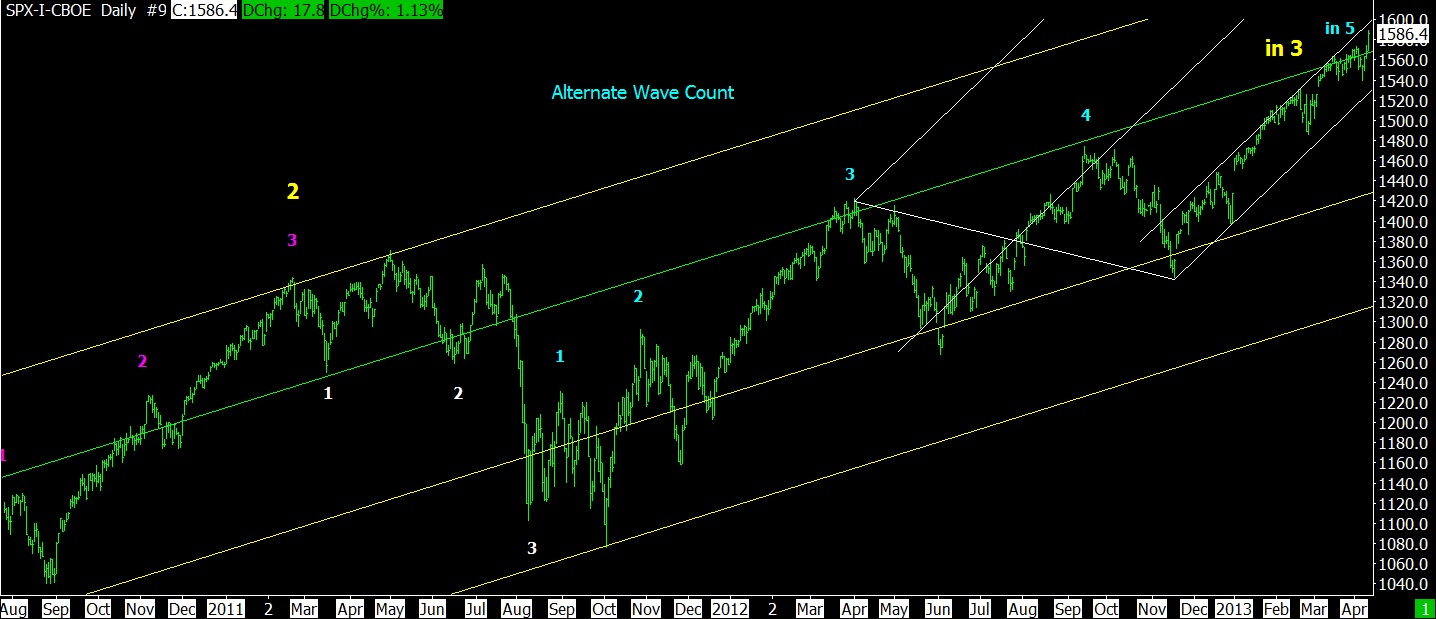
04-10-13 SPX DAILY BAR
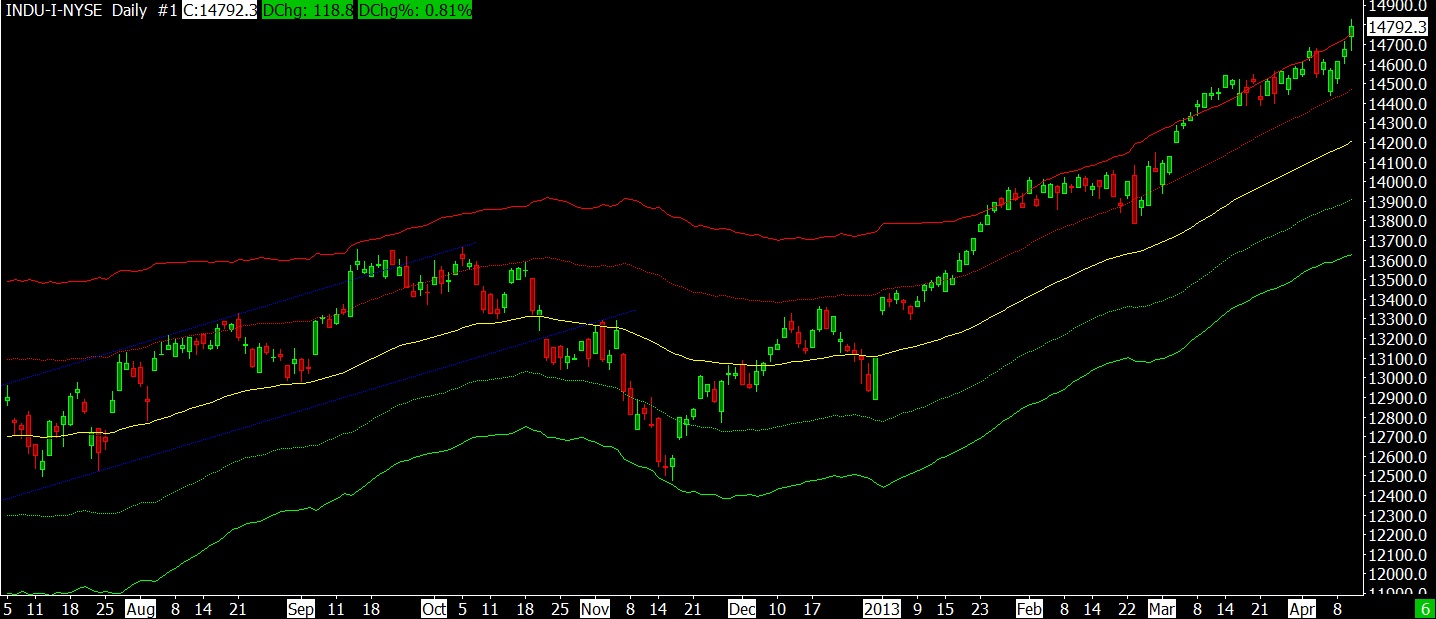
The next chart is a close only chart and it’s easy to see the current step 3 continuing.
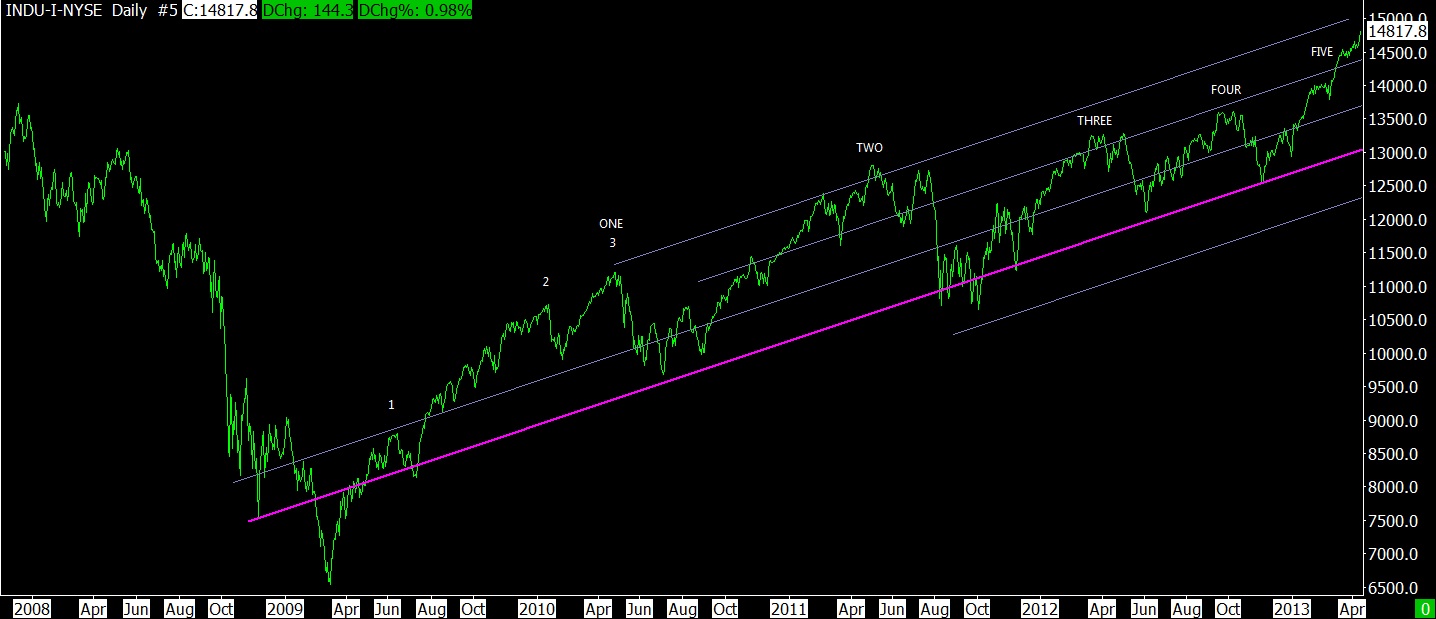
04-10-13 DJ IND DAILY BAR
The market has moved from a recent oversold to almost neutral (last chart in the following group). The charts with the white background always come from “My Charts” at StockCharts.com
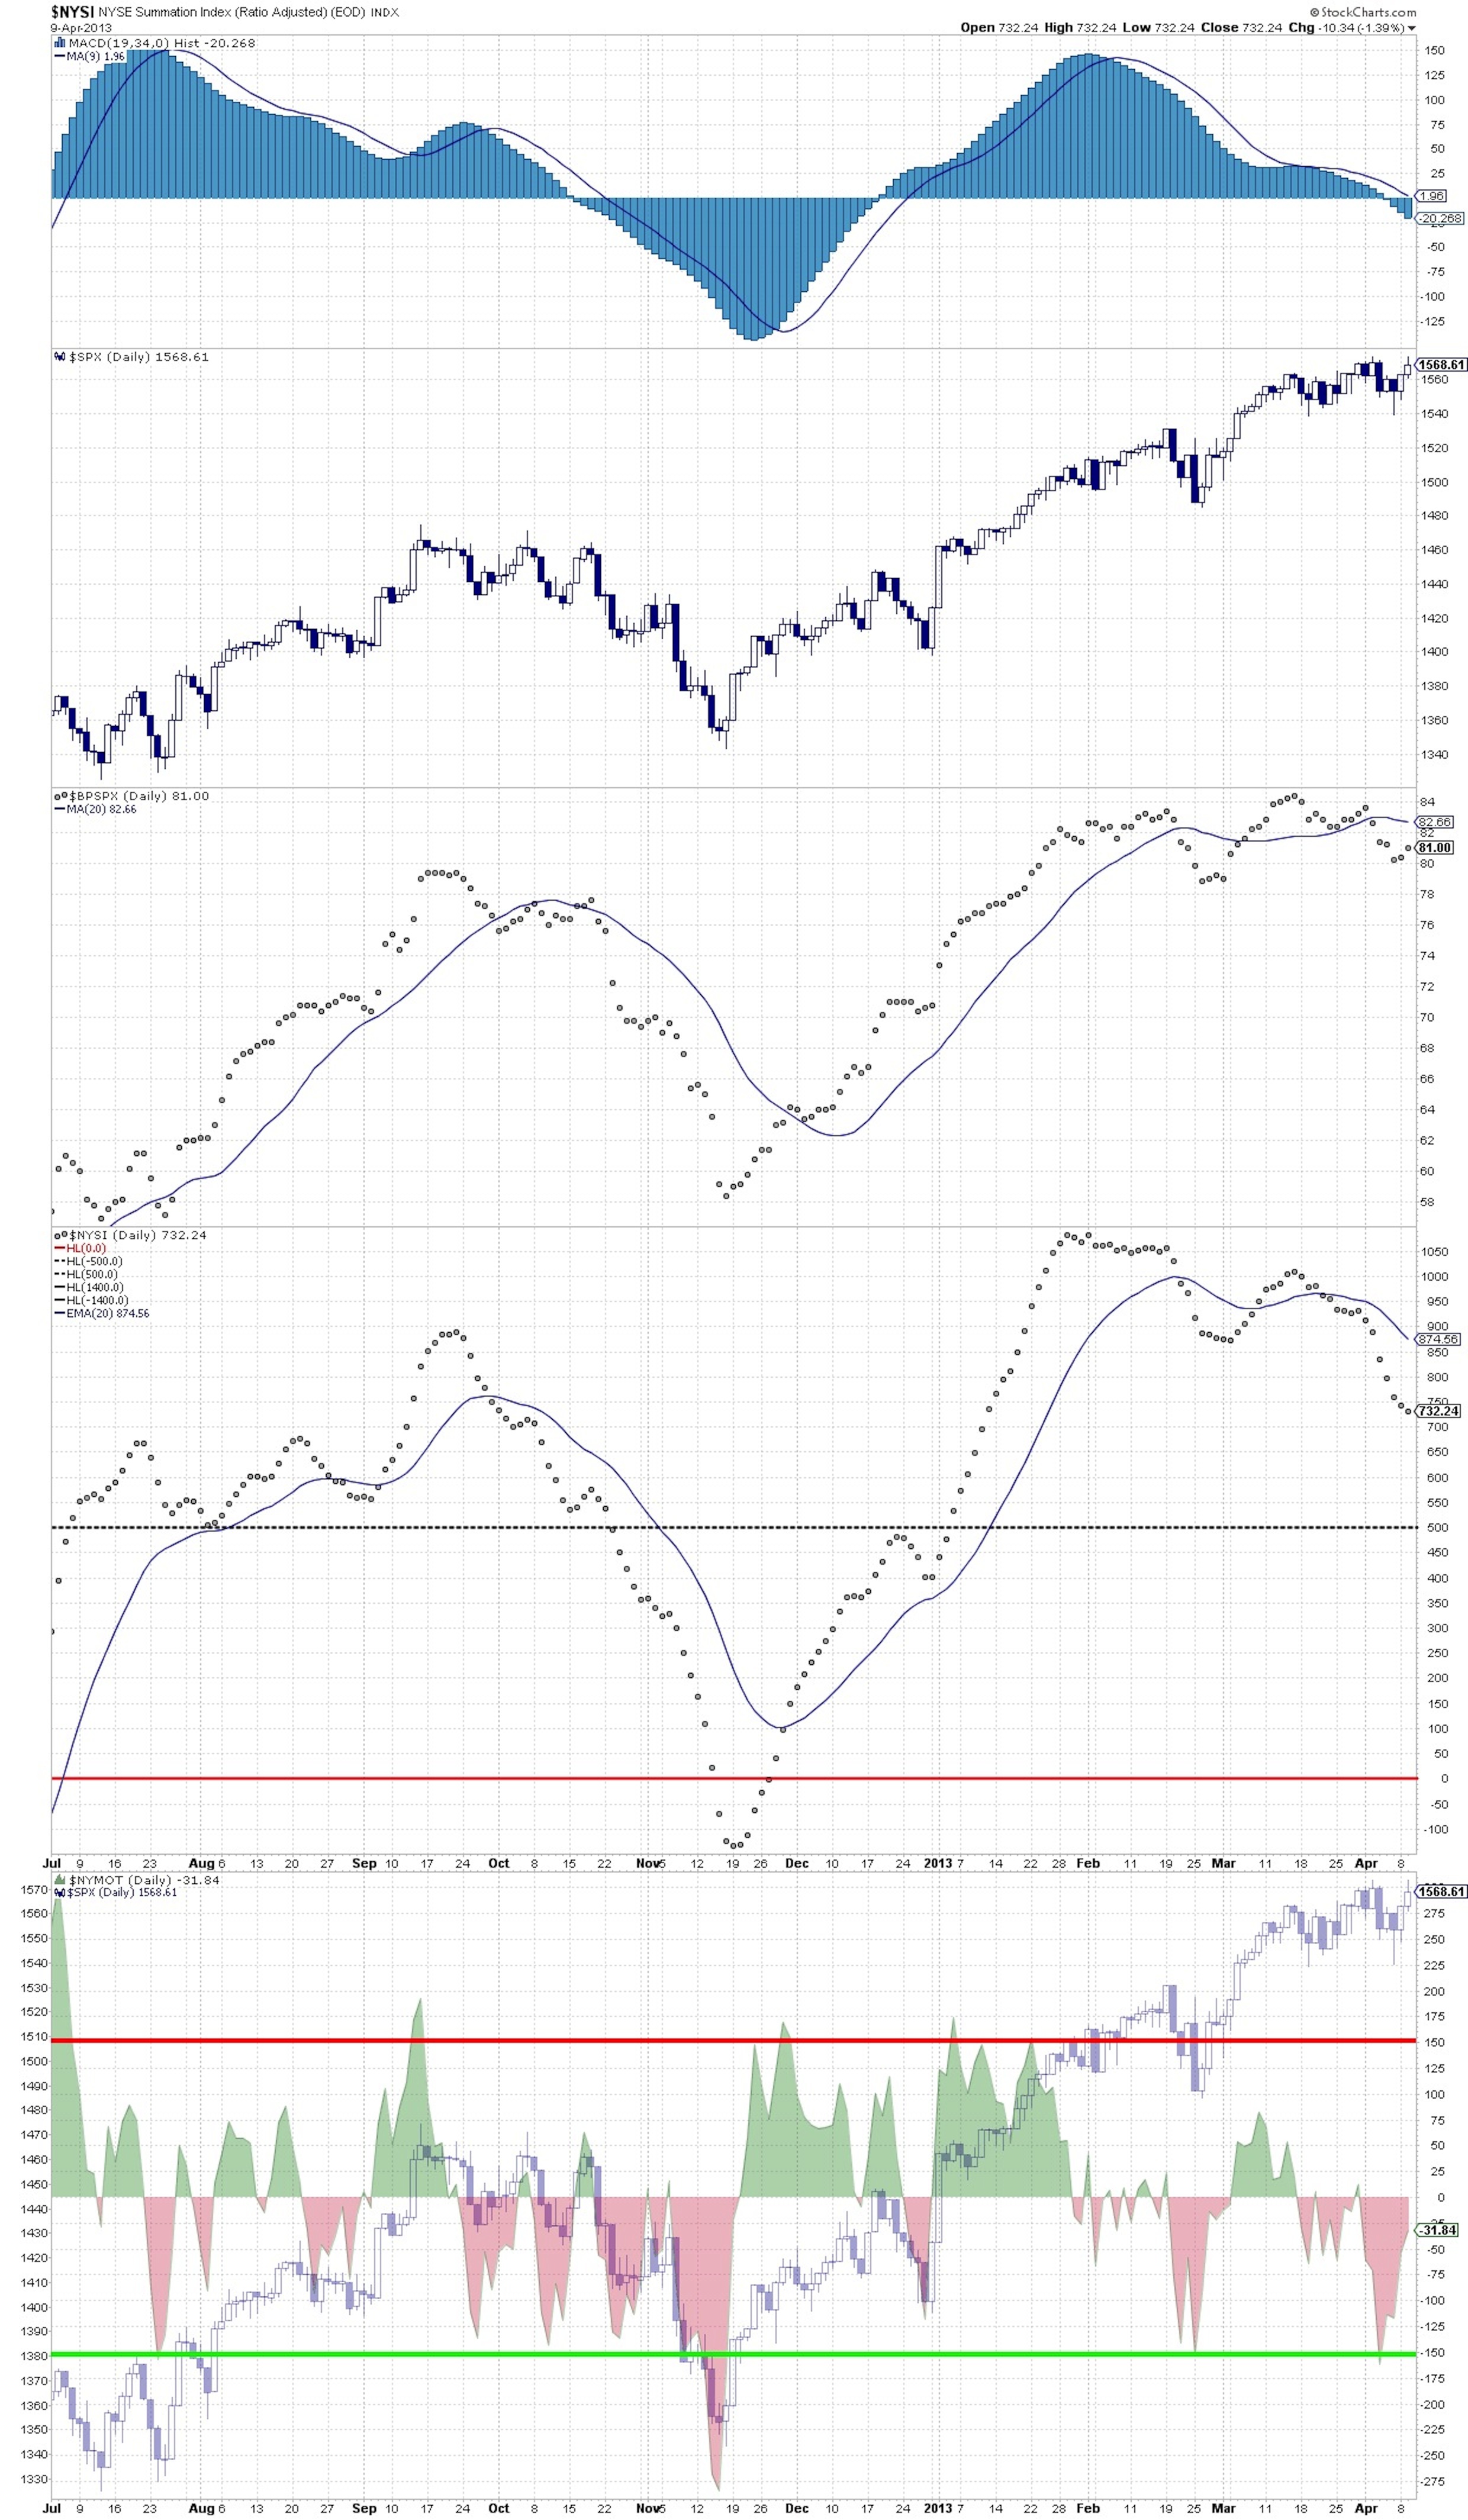
04-10-13 Oversold
The following chart shows the market is hitting (again) the upper limits of the envelope boundaries. That means slower going in the future. But small corrections allow bigger upside bursts like today.
04-10-13 DJ IND DAILY LIMITS
I will give you one day’s alert before ALL of my T Theory updates will be posted. There will be several updates and they need to be separated from anything else I might be doing at the moment. The updates are still days away because there is more to this than I thought. After this group of updates is finished there will be no more T-Theory updates from me.
- Click on any picture or chart to enlarge it
All Rights Reserved © ™
Explore posts in the same categories: UPDATE, WAVE COUNT
April 16, 2013 at 5:40 PM
I am always quoting Jesse Livermore inside my head as I am look at new developments:
“..the tape does not concern itself with the why and wherefore. It doesn’t go into explanations… The reason for what a certain stock does today may not be known for two or three days, or weeks, or months. But what the dickens does that matter? Your business with the tape is now – not tomorrow. The reason can wait. But you must act instantly or be left. Time and again I see this happen…”
Anyway, to add to John Murphy’s analysis, Cyprus announced that they were going to sell the bulk of its gold reserves to meet the bailout conditions.
LikeLike
April 16, 2013 at 4:46 PM
If you didn’t see John Murphy’s comments today on gold, here they are.
Bob
LONG TERM TECHNICAL INDICATORS WEAKEN… The financial media on TV spent all day yesterday trying to come up with a reason to explain gold’s dramatic price plunge. I admit that I don’t know why yesterday’s drop was so big, or why it happened yesterday. What I do know is that a lot of technical and intermarket indicators have been bearish on gold. Although several recent messages have shown the close correlation between falling gold prices and a tumbling yen (rising dollar) and a major shift away from gold and into stocks, my February 28 message made the the bear case for gold in more detail. You may want reread that message to get the entire story. The first three lines in that day’s headline were: THE BULL MARKET IN GOLD MAY BE OVER — LONG-TERM TECHNICAL INDICATORS WEAKEN — A STRONG DOLLAR, STRONGER STOCKS, AND WEAK GOLD MINERS ARE ALSO BAD FOR GOLD. Let’s update three of that day’s price charts. Chart 1 shows the monthly MACD lines turning down at the start of the year and falling to a two-year low. At the same time, the 14-month RSI line peaked during 2011 and has been falling since then (down trendline). Chart 2 shows a major negative divergence between falling weekly MACD lines and the price of gold which was threatening its 2012 low near 1550. Chart 2 also shows gold having broken that support and falling to the lowest level in two years. Those bearish chart warnings were shown on February 28.
Chart 1
Chart 2
GOLD MINERS FALL TO NEARLY FOUR-YEAR LOW… This headline and Chart 3 were also taken from the February 28 message. The chart shows the Gold Miners Index (GDM) having already broken major chart support drawn along its early 2010 and 2012 lows which completed a major topping pattern in gold miners (see circle). To quote from the February message: “That creates a huge negative divergence between gold miners and the price of gold (brown line). Since the two markets have historically been positively correlated, the breakdown in gold miners is another strike against the bull market in gold continuing”. The GDM has since fallen to the lowest level since spring 2009. And gold has had a major chart breakdown. Gold wasn’t the only commodity that plunged. The entire commodity asset class tumbled yesterday. A lot of that had to do with China.
Chart 3
CHINA WEAKNESS HURTS COMMODITIES … The major reason for yesterday’s commodity plunge was given as a disappointing first quarter GDP report from China. The fact is that falling Chinese stocks have been weighing on commodity prices for months. Chart 4 shows the CRB Index plunging to the lowest level in nearly two years yesterday. The dashed line shows the last peak in China iShares (FXI) during February coinciding with the last commodity peak that same month. Chart 5 shows a close correlation between Chinese stocks (red line) and the CRB Index (brown line) since 2009. Both peaked in the spring of 2009. The 2013 peak in the FXI took place below its 2011 peak. Both have been falling together since February. The negative impact of weak Chinese stocks shouldn’t be news to readers of this site. My April 5 message carried the headline: COMMODITY COUNTRIES HIT HARD TO FALLING PRICES. That message showed how weak commodity prices were hurting producers like Brazil, Canada, and Russia. Its first paragraph also observed: “Relative weakness in the Chinese stock market (which is the world’s biggest importer of commodities) has also hurt demand for commodities and countries that produce them”.
Chart 4
Chart 5
LikeLike
April 16, 2013 at 10:04 AM
Terry had a long T lasting until 2020 for gold, but we’ll have to see how that works out.
Bob
LikeLike
April 15, 2013 at 11:59 PM
No Val not long gold but looking for a possible entry if we are still in a bull gold.
Michael
LikeLike
April 15, 2013 at 11:51 AM
I have a dim outlook on free data as it doesn’t seem likely in the future. This is especially true because looking at Dow Jones used to offer their daily figures back to 1896 for free and now charge for it.
I would post the daily info back to 1900 for the Dow Industrials, but I’m afraid Dow Jones would be all over me for doing that. Those figures belong to Dow Jones and I would probably be screwing with copyrighted material.
If viewed correctly there are things revealed with intraday data that isn’t available with daily info. Most everyone winds up with too much data and it becomes confusing. It takes awhile before you can see the relevance provided you are looking at the right indicators.
It’s beginning to look like we “may” have a top of sorts in the market (more later when I can find the time).
Those gaps in gold look ominous and we may have started a larger step 2 down in gold. I’ll study it all later but first glance kinda looks that way.
Bob
LikeLike
April 15, 2013 at 9:07 AM
OMG. Gold just crashed 7% today. I hope you were not long focus12345.
LikeLike
April 14, 2013 at 7:18 PM
Hey Bob,
Luckily I don’t use intraday data for my studies, but tend to think that in the future more data will become available for free (not the other way around). Hopefully it is only a matter of time until intraday historical data also becomes available for free.
I am not trying to pick the top, but I’ve been running a little program that makes educated wild guesses (neural network) just for fun, and the thing predicted a major top in the stock market soon. So I added more parameters (AAII Sentiment, RSI, MACD, and VIX) and I am running it again just see if it predicts a top again (unfortunately it takes 2 days for my computer to analyze the data and spit out the crappy results). It will be interesting to see what your indicator says (if you get around to updating it). Most popular technical analysis and sentiment indicators on the weeklies seem to be bearish now, but the stock market just keeps going up and up just to prove everyone wrong…
LikeLike
April 14, 2013 at 3:11 PM
Ok.
LikeLike
April 14, 2013 at 2:57 PM
Busy, busy, ask me again later in the week. I’ll probably forget between now and then.
I hope to finish the T-Theory drafts today. If so, the warning will go out tomorrow and I’ll post all of them on Tuesday.
Bob
LikeLike
April 14, 2013 at 2:28 PM
Bob I know your are busy but when you get a chance could you comment on Gold?
Thanks
LikeLike
April 13, 2013 at 12:07 PM
Scrapbook takes a HTML snapshot of the webpage as it exists on the day of the snapshot. The snapshot exists on my computer as the actual webpage and anything I can do with the real page can be done from the Scrapbook page. Using the snapshot, I copy and paste the industrial, transportation and utility hourly info (as a block) into Excel (at my leisure – key point for me). That’s all I do, copy and paste, Excel does the rest for me, calculates everything and even updates the charts on separate sheets. So simple, it’s stupid and that’s the way I like it (KISS). But I do spend a LOT of time creating the Excel programing, but once it’s done, there is nothing left to do in the future.
I have thought about creating a browser program that extracted the info, but after my experiences with Dow Jones Retrieval in the 1980s with changing formats, I don’t want to modify the browser program every time DJ makes a format change. The copy and paste method that I presently use is very simple and the time spent on the program would probably never equal my copy and paste time for several decades.
I don’t need to buy historical data when I can have it for free. I have already created the past data by hand prior to 1979, then I used Dow Jones News Retrieval in the 1980s for real time data. Beginning in the 1990s, I used the Dow Jones internet pages to create my data and that’s where I’m at today.
When I created my data back to 1930, there was no past data for sale at that time. Many, many years later did some services pop up that sold past data. You gotta remember that I started all of this before the internet was available (Yup, I’m ancient). CPM (and its variations) ruled the waves until the IBM PC in 1981.
For awhile Dow Jones had their daily, weekly and monthly info available for free back to 1896 (???), which I promptly copied to my computer. Now they charge for that info. Things change and that’s one of the prime reasons for using Scrapbook – things never change there.
No worry, I won’t publish my indicator. But I will likely publish charts and the charts don’t give a clue to the data used. Sometimes my indicator data looks exactly like prices and other times, my indicator goes in the opposite direction of prices.
The T-Theory project is taking a LOT of my time and I won’t do anything for awhile because I have a lot of projects piling up on me. I do NEED to update my indicator as it is months behind. It could be telling a different story than prices, but since March 2009, it has been telling me that every correction should be ignored because big money was still buying. What’s it saying now???
Bob
LikeLike
April 13, 2013 at 10:46 AM
Thanks Bob,
I am not sure why you would need to be compiling hourly data using scrapbook. I’ve used scrapbook before to save some websites, but that process is still very manual and time consuming.
I think there is a much better way to do this. Assuming that you really want to be compiling data using web prices like this (why not just buy historical data?), I recommend that you write a little program to automate the browser itself. There is a wonderful programming library called Watin that allows you to completely control your browser programmatically. The library itself uses old technology, but I think the concept is very cutting edge. You can automate everything!
Regarding your indicator, I don’t think you should publish its “secret” if you worked so hard on it. However, I don’t think it would make much difference either way since people who did not work on it would not have the confidence to rely on it anyway. But, a chart or two would be interesting just to pique our curiosities.
Thank you for continuing to work so hard on you t-theory updates. After you publish this, I think your site will be the number one resource for the t-theory (if it isn’t already).
LikeLike
April 12, 2013 at 11:40 PM
Sounds interesting.I will remind you when your done with your project.
Thanks.
LikeLike
April 12, 2013 at 5:27 PM
The DJ Industrials is the indicator that I researched back to 1930. This was all done by hand at the local library. Luckily they had Barrons back to Jan. 1930. They had nothing beyond that date and so I just stopped there. If I had to see the 1929 peak, I could have gotten the info from another source, but I really didn’t think it was necessary. I had enough past data to get a good idea of how the future should work.
As expected, the new indicators showed that the conventional bear market bottom was in 1942. Step I was 1929, step II was 1937 and step III was 1942. Prices showed higher lows for each of these bottoms. 1929 had done such extreme damage that a further decline was unlikely.
Incidentally, I have always been a big fan of the Battle of Midway because the 1942 bottom occurred almost immediately after this huge WWII battle. What this battle meant to Wall Street was the war in the Pacific was won, all we had to do was finish it up (we win both ways, through attrition or our manufacturing capabilities). The war in Europe was obviously the area that got the most attention because of the necessary landing of troops in 1944 (a really huge achievement for the times).
Here is an illustration of how the little guy can get left out in the cold. My mother told me she had no idea how important the Battle of Midway was at the time, because of news blackouts and censoring. But Wall Street obviously had a direct line to the “War Dept” because “they” knew exactly how important it was. As I researched all of this, it told me that one must watch Wall Street for a message of how important a news event might be.
One time I was ahead of Wall Street regarding the news in 1973. I read in the newspaper back on page 10 (or further back), that OPEC was cutting off the oil to the west. At that time, nobody even knew what OPEC was. I thought this seemed important and sure enough a week or two later, Wall Street crashed. Being ahead of Wall Street on the news doesn’t happen often. But Gould had previously declared a bear market in January 1973, months ahead of the crisis. The oil crisis was step II down in the bear market.
In 2007, the DJ Industrials indicator didn’t top in advance of the market (it did confirm the decline). The DJ Transportation indicator topped several months before Oct 2007. Also the DJ Utility indicator peaked early in the year (2007). The later price high in the Transportations was shown by this indicator to be nothing to follow as it was FAR BELOW its peak in early 2007 making consistent lower highs and lower lows.
In 2000, I “think” the indicators peaked well in advance of prices. The 2000 peak was a historical euphoric peak focused on NASDQ tech stocks AKA dot com. Also the 2000 peak was lifetime event. Meaning only the very young may live to see another one like it. 2000 was even nuttier than 1929. That’s why I predicted a large 3 step decline after the 2000 peak. The pendulum always swings from euphoria to despair. We came close to despair in 2009 but I think we “might” have one more stab at another crisis. Lifetime euphoria (2000) should match up to lifetime despair (maybe 2018 to 2021 . . . or not).
2000 was a easy peak to call for any technician that has been in the business for a long time. That type of euphoria ALWAYS bites us in the ass. But nobody would listen and that is always the case. “I’m making too much money, don’t bother me with your doomsday predictions.” Ain’t it true.
I also have the DJ Utilities researched far back too. So there is a threesome that I follow (amongst lotsa other stuff), industrials, transportations and utilities.
I really should post the past indicator charts for 2000 and 2007, but I never seem to get around to doing it. Maybe if you remind me occasionally, I’ll do it.
I’m progressing nicely on the T-Theory project and when its published it will be big. I doubt if anyone realizes what’s coming, but there will be a warning the day before publication. I’m also redoing the previously published weekly publications into monthly publications. Gotta get back to work on it.
Bob
LikeLike
April 12, 2013 at 4:02 PM
Hi Bob you wrote:
“What the indicator has been showing throughout this entire bull market beginning in March 2009 is that it has constantly gone up, even when the market was correcting. It’s revealing under cover buying as the market corrected (pretty cool)”.
How long have you been using this indicator and does it show when the bear is back- did it in 2000/2007?
Thanks
Michael
.
LikeLike
April 11, 2013 at 5:19 PM
Thanks for the info on DOS.
I can’t run my DOS software until I copy it into the correct directories on my C: drive, otherwise it will error because the referenced data directories won’t be there. The directories were hard coded into the program, but that’s easily changed if I wanted. Directories would have been better if they referenced a file for the directories (easily changed that way), but at the time they were written, I didn’t know better. I think I would need an emulator and thanks for the info on DOSBox. I haven’t run any of this stuff in decades. I printed all the charts for each year when I realized that DOS was going to disappear some day. It might be fun to play with this old stuff when I don’t have projects hanging over my head. I still have copies of DOS Basic too. All of this stuff sits on a a couple of external data disks, one disk for reference and the other backs up the first disk (almost a raid setup, but it’s manual).
Regarding Excel, I have always written my own analysis programs for Excel. My DJ Industrials data in Excel manipulates the new data automatically after its copied into the sheet from Barrons Market Labortory.
If you aren’t aware, Barrons hourly info is only available for the current week, after that the info is gone. I have past issues available with my Dow Jones service, but the Market Laboratory page consists only for current week data. Consequently I save the current week’s laboratory web page using Scrapbook on Firefox (a very very hand tool). After saving the page data, I can update my Excel info at my leisure and never with a schedule. This obviously means that I don’t update often (because I’m lazy).
During the 1980s, Dow Jones had a service called Dow Jones News Retrieval and I captured the screen display into a text file and then ran a program that placed the hourly info directly into a file and made the necessary calculations. The daily work was effortless and it worked great until DJ made a change in their display format. It would then create havoc with my program as it looked for string information in a certain format. As I remember they changed their format only a couple of times during the time this service was available. The service disappeared when the internet became available. I then resorted to the system that I have in place today.
To date, I haven’t posted a chart of my secret indicator, but I will probably do that at some later date. What the indicator has been showing throughout this entire bull market beginning in March 2009 is that it has constantly gone up, even when the market was correcting. It’s revealing under cover buying as the market corrected (pretty cool). I really need to do an update on this indicator as it is very far behind and I have questions. Revealing the indicators construction isn’t going to happen. That might be kinda silly, but I figure people need to work just as hard as I did to get to this point (and they need imagination). I am unaware of anyone else having this indicator. Perhaps it does exist elsewhere, but no one is talking about it. As I said, most people don’t want to work hard or dream about an indicator that will do something brand new. Imagination has always been a key ingredient in my analysis of the market.
Time to go back to work on Terry’s stuff.
Thanks,
Bob
LikeLike
April 11, 2013 at 4:07 PM
Wow, that’s pretty cool. I wrote my first experiment programs on an Apple IIe in school back in 1988. The Apple IIe did have those 5″ floppies and a similar 64k of RAM, but it was released much later than the Cromemco that you mentioned. So you probably had the Ferrari of computers back in 78.
I didn’t get my first computer until much later… in the early 90’s. It was an IBM ps2 386 with a “whopping” 2 megabytes of ram. Nowadays programming is all object-oriented, very organized, well documented, and computers are super cheap. The sky is the limit.
By the way, if you have Windows 7, DOS is still there. It is no longer an integral part of the operating system, but it still is an integral part of windows management, network administration, and programming. To bring up the DOS box, simply click on Windows Key + R. This bring up the Run box. Then type cmd.
Some extremely old software, however, might require a DOS emulator to run properly. Every once I a while I still run DOS software with something called DOSBox. It is a free emulator that you can download. You can also run the original DOS 6.2.2 in Virtual PC, which is a free hardware emulator from Microsoft.
Also, if you do a lot of Excel analysis, I recommend a set of commercial macros called TraderXL. They have all the popular indicators and price/data downloaders. They even have a Neural Network plugin that can be amusing to predict prices (but as far as I am concerned, it is no better than anybody’s guess about the future).
Thanks Bob
LikeLike
April 11, 2013 at 11:23 AM
Thanks for the offer, but it’s not necessary.
The work I’m doing is creating the same web page over and over with different content (no programing involved). Looking at my T-Theory pages, you’ll see that they all look the same, just different charts and audio.
I will add to this page with the new info, otherwise it would be out of control data.
There are a lot of pages for me still to do, so it’s monotonous dreary work. I should have it done in a week or more (if I keep at it – that’s the real kicker and I get bored eventually too). I’ll be hard at work again today trying to get more done. After I finish putting up the pages, I don’t need to keep the Terry’s data on my computer. I’ll put the pages up all at once (there will be a flood of updates when it happens). I will run a warning the day before the flood to let everyone know it’s coming. Not everyone cares about intensive T-Theory information. They just want someone to tell them the results of what’s happening currently.
I was actually a computer programer in my last job (around 2000). I only got the programming job for fun (didn’t need the money), but I grew weary of it as I was writing code to automate company functions and putting people out of work. I didn’t like that and quit when I put a friend out of work.
I had taught myself to program in 1978 (Basic). I built my first computer from a kit (Cromemco) in 1978 (3 years before the IBM PC). In those early days there were NO beginner books for programing. I needed instructions on how to program and examples of how to use the my first commands (syntax examples). It was basically just try it and see if it worked.
I spent all day and night for 6 months in front of the computer writing my first program. It was so big and computer memory was limited to only 64K (huge for those days, each card was 16K and cost $400, I had 4 cards of memory). I had to chain the programs to together passing data from one program to the next. It was a profit and loss statement for my restaurants with all the expenses categorized and tracked on disk (91K 5″ floppy). After Basic, it was on to Visual Basic when it became available (many many years later).
Pictures of my first computer (not of my actual computer, but this is what I had).
I still have my original code from those early days, even though I can’t run DOS anymore (Windows 7 won’t let me drop back into DOS). I suppose I could boot into DOS using Parallels (on my Mac), but I don’t know if DOS is available or if it would work on my computer (never checked to see). Those early programs are just dinosaur material, but I keep them for sentimental reasons (too much work involved to throw them away). In those days, printing a chart required using an ACII character (no raster graphic) and interpolating where it went on the line (crude but effective). I had a DecWriter to print (that was expensive $1500). It was a dot matrix printer and so loud I put it in a closet. My first computer with peripherals was expensive, Cromemco computer, Hazeltine monitor and DecWriter (I think about $5,000 – lotsa money in 1978 dollars, almost $19,000 in today’s dollars, obviously everything has become much cheaper). But it made life easier for me as it also did payroll (printed the checks too) and did the quarterly reports for the government. I hated calculating payroll and writing the checks.
After writing my business programs, I begun thinking that this thing could do wonders with my stock market data. After that I did a lot of work, some useful and others were a bust. Years late I came to the conclusion that you lose touch with the market when you depend on the computer to do all the charts. Keeping charts up to date by hand has a very, very useful component that I think most people don’t realize, especially in today’s world of easy charts.
Today I don’t use any of my own programs to track my data. I keep the data in Excel and let it chart the data. I have “calculated” hourly data going back to 1930 for the DJ Industrials (secret indicator). That was a LOT of data input and real drudge work. The stock market was also open on Saturday in earlier days. HOURLY data back to 1930 on the Dow isn’t available anywhere (later data is available, around 1978???). I may be one of the few around that has all of this data. I also have daily hourly info in text format for the early years. Calculated hourly data back to 1930 is a lot of Excel lines and it’s consequently broken up into separate sheets (it’s huge, about 125,000 lines). I only use relatively current data to work with due to file’s enormous size.
Thanks again for the offer. It was greatly appreciated and I haven’t had such a generous offer in a long time.
Bob
LikeLike
April 11, 2013 at 9:54 AM
Thanks Bob,
Please let me know if you need help with organizing the t-theory pile of stuff. I am a programmer and web developer so coding html is easy for me. You can email me directly if you are interested.
LikeLike