
MARKET MESSAGES
2/16/13 . . .
A couple of weeks ago, I showed a chart of the NAAIM Survey of Manager Sentiment and today I’m showing the current readings for that chart. Previously I had observed that this indicator had a history of peaking a bit before the general market.
In the chart below, notice how sentiment peaked recently (purple = sentiment; blue/green = SP500). The market has been going no-where recently. It’s just churning in place, distribution or ??? The only thing missing is high volume. High volume would make it a text book example of distribution.
It seems the market is “waiting” for something to happen. Whether the market will be disappointed is something we’ll find out later, but Wall St. is very fickle. Even when it gets what it wants, it may go down . . . or if it doesn’t get what it wants, it can go up (???).
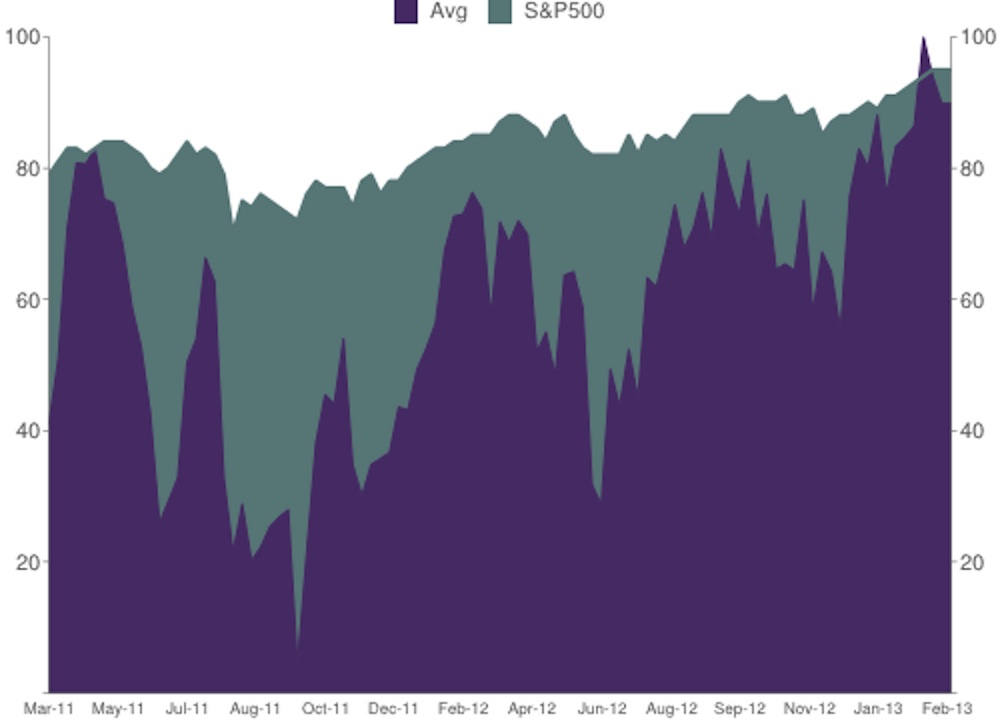
02-16-13 Sentiment
I have a lot of momentum indicators that are yelling WARNING. That’s not a definitive sell indicator but sometimes it can give you a heads up.

MOMENTUM INDICATOR
…………………………………
Possible Wave Counts
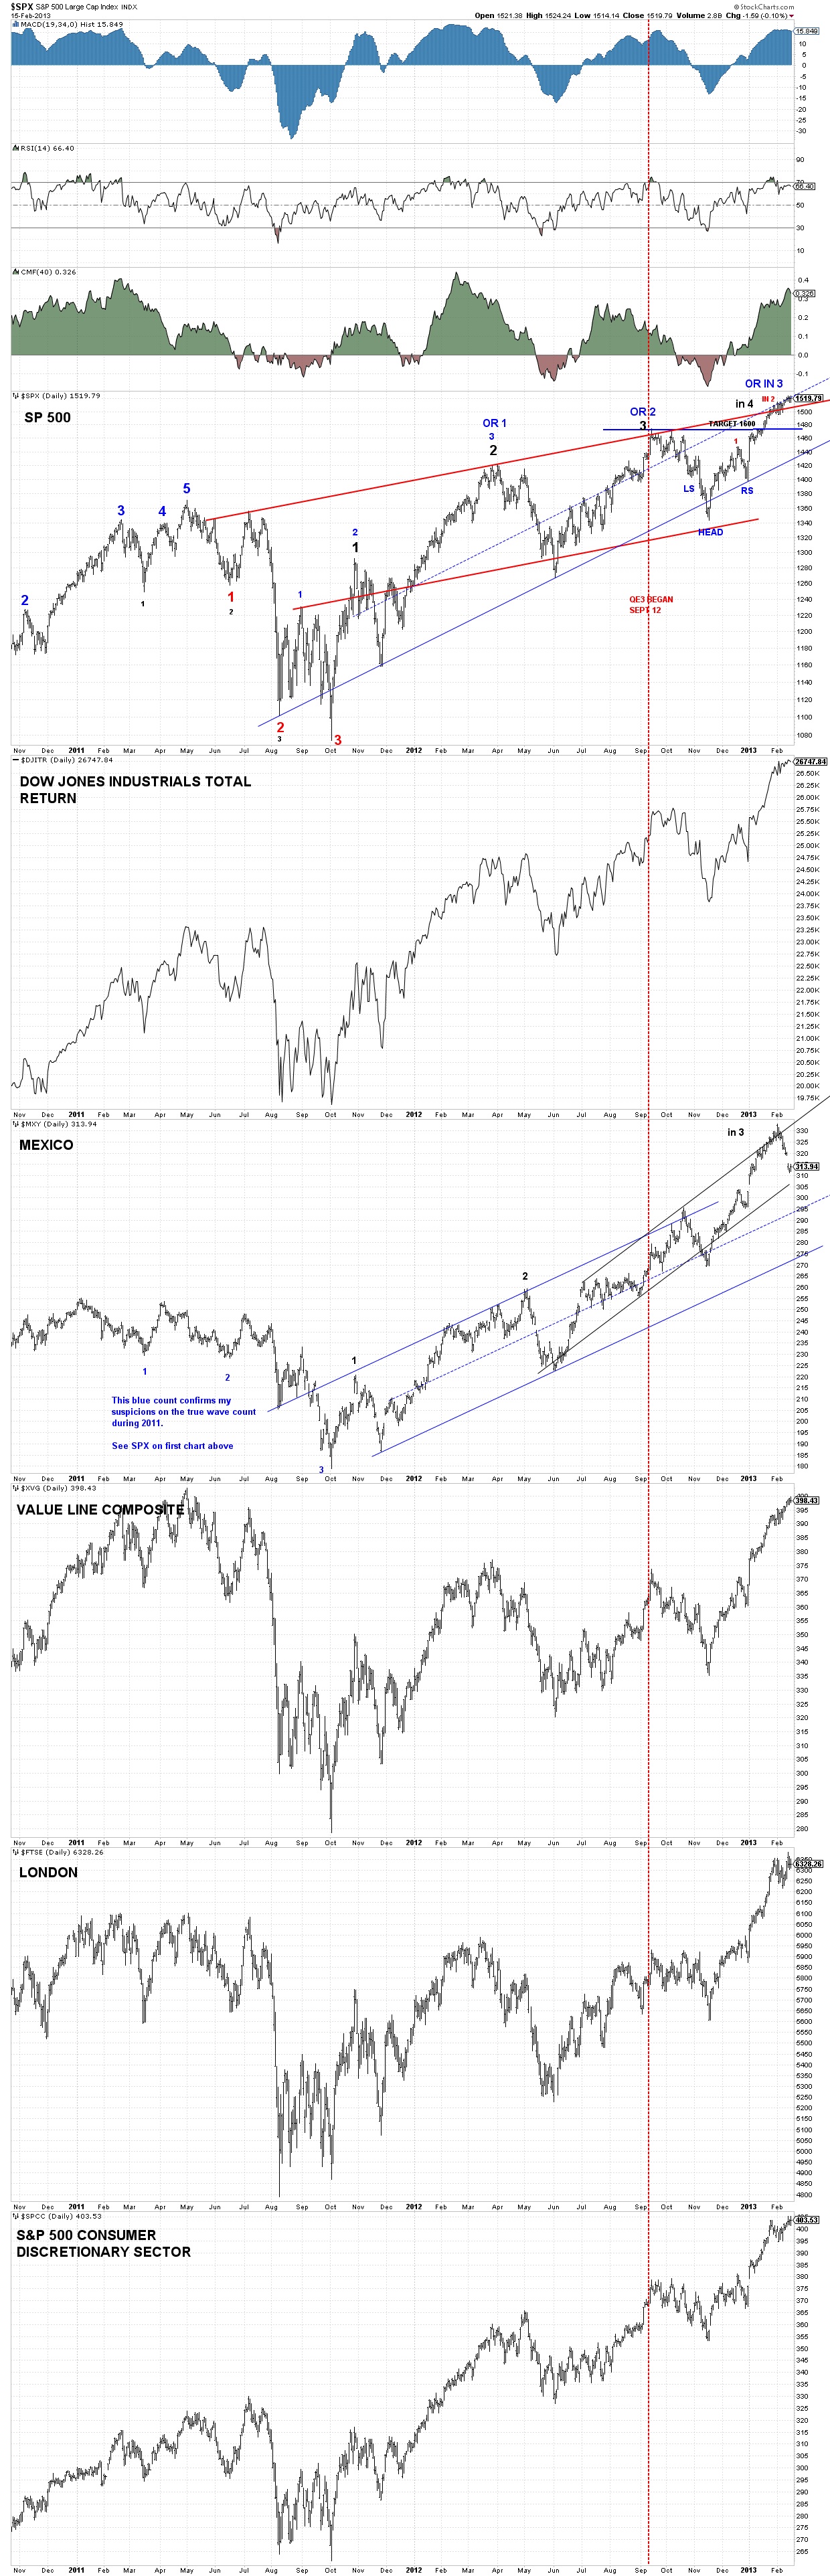
02-16-13 WAVE COUNT DAILY
…………………………………
Rules & Sentiment – PDF files
Rules
Money Management by Walter Bressert (revised by Bob)
Jesse Livermore’s Trading Rules
Bob Farrell’s 10 rules for investing
The 12 Cardinal Mistakes Of Commodity Trading by Walter Bressert
ONE WAY POCKETS (condensed into my words)
John Murphy’s Ten Laws of Technical Trading
Sentiment
Memoirs of Extraordinary Popular Delusions and the Madness of Crowds
…………………………………
Hurst Cycles
Straddled troughs – 16 February 2013
Posted on February 16, 2013 by David Hickson
One of the issues that newcomers to Hurst’s Cyclic Principles struggle with the most is that at times markets seem to be showing very little cyclic influence, and they move in a straight line, up, down or flat. Other cyclic theories suggest that cycles come and go, that a cycle will move the market for some time and then simply disappear. Not so with Hurst cycles. Periods of straight-line movement are explained by the way in which multiple cycles combine, and by the fact that the amplitude of cycles varies greatly.
It is all very well to understand why things happen, but the true value of this understanding lies in being able to forecast turning points in the market and trade accordingly. For the past 7 weeks the US markets have been “flat-lining” in an upwards direction and providing us with a challenge: when is the peak going to form? The answer is provided by identifying the subtle clues that the market gives us when the cycles all but disappear from view.
I have been developing this theme for three weeks, and so if you haven’t been reading regularly, make sure that you catch up with past issues. The process begins with identifying the dominant cycle, then finding the subtle troughs of the shorter cycles, and finally one needs to distinguish these subtle troughs as either hidden troughs (that is my term for them, you won’t find it in your Hurst glossary!) or straddled troughs (that is a Hurst term).
This is how I differentiate between the various types of subtle troughs:
Subtle troughs are low points in the price movement which are the troughs of a cycle, but price does not fall into or bounce out of the trough to an extent (or duration) commensurate with the magnitude of cycle that is forming the trough.
Hidden troughs are subtle troughs which occur during an extended bull or bear move, and form little more than a blip in the general move (which is the dominant cycle’s move). The implication of a hidden trough is that price will rise or fall further, depending upon whether it occurs on the way up or the way down. Often a hidden trough on the way up is followed by a straddled trough in the cycle one degree shorter. For example a hidden 80-day cycle trough is often followed by a straddled 40-day cycle trough.
Straddled troughs are a specific form of a subtle trough usually more prominent than a hidden trough. The distinguishing characteristic of straddled troughs is that price action is fairly (rarely perfectly) symmetrical around the straddled trough. The implication of a straddled trough is clear: price will form a second peak (symmetrical with the peak that precedes the straddled trough) and that will be the final peak of the move.
I should make it clear that straddled troughs were defined and discussed by Hurst. The concept of hidden troughs is my own, and so it is not pure Hurst theory, but an extension of Hurst theory based upon my observations.
Here is an infamous example of a straddled trough:
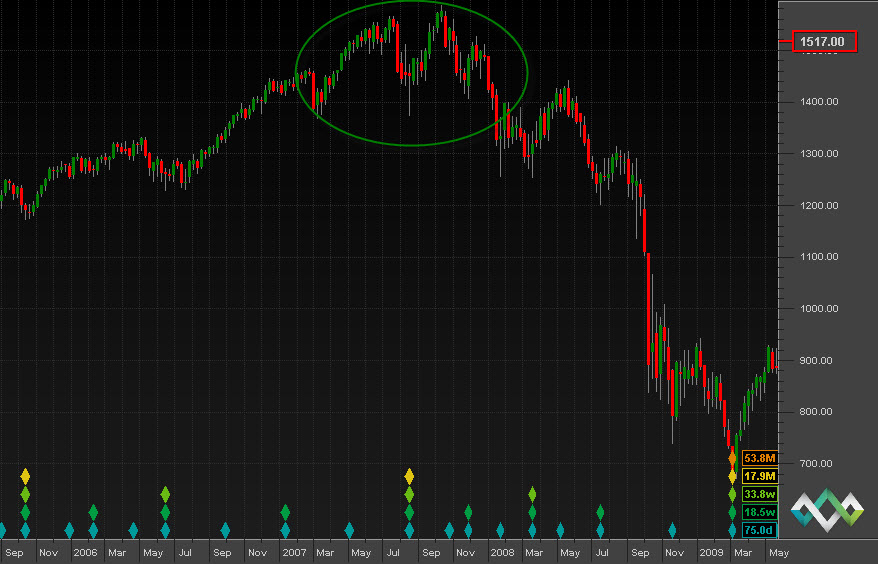
The green ellipse highlights the symmetrical price move surrounding the straddled 18-month (at least) trough of August 2007.
Here is an example which brings all of these elements together:
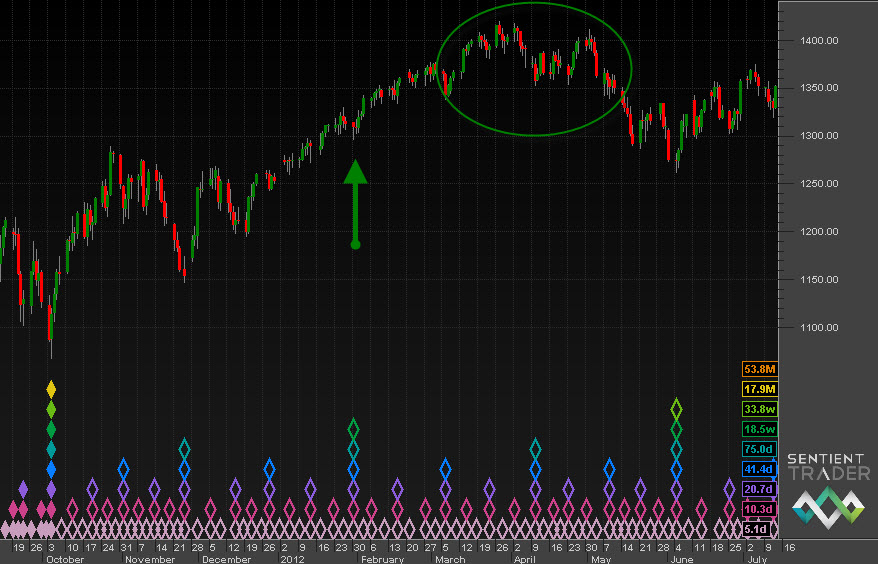
The dominant cycle is the 40-week cycle. Note the hidden trough of the 20-week cycle marked with a green arrow, and the straddled trough of the 80-day cycle with the fairly symmetrical price action surrounding the trough highlighted with a green ellipse.
What is happening in the markets now? Two weeks ago I identified various dominant cycles. In stock markets around the world we are expecting a subtle trough of the 80-day cycle to form. Some of those troughs will probably turn out to be hidden troughs, and some will be straddled troughs. Last week I showed some markets from Europe because they provide interesting variations on the theme.
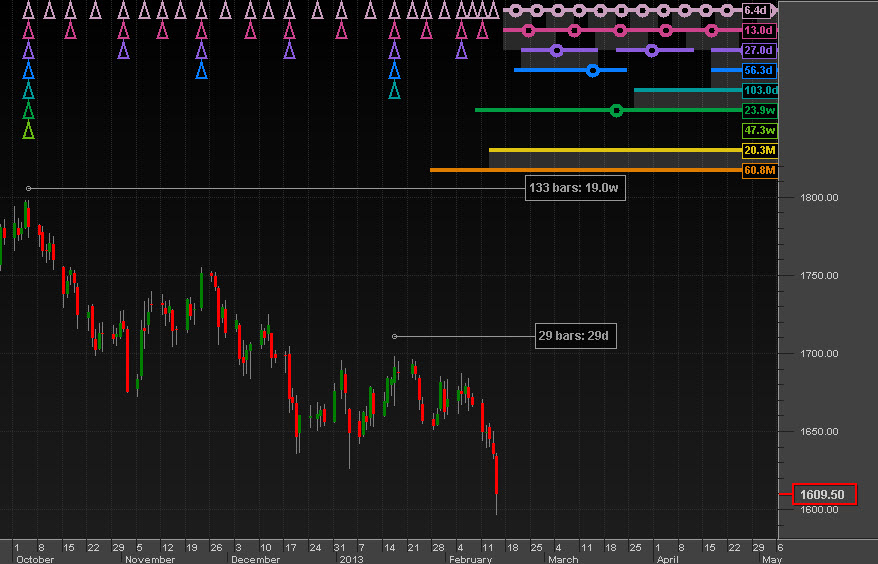
FTSE
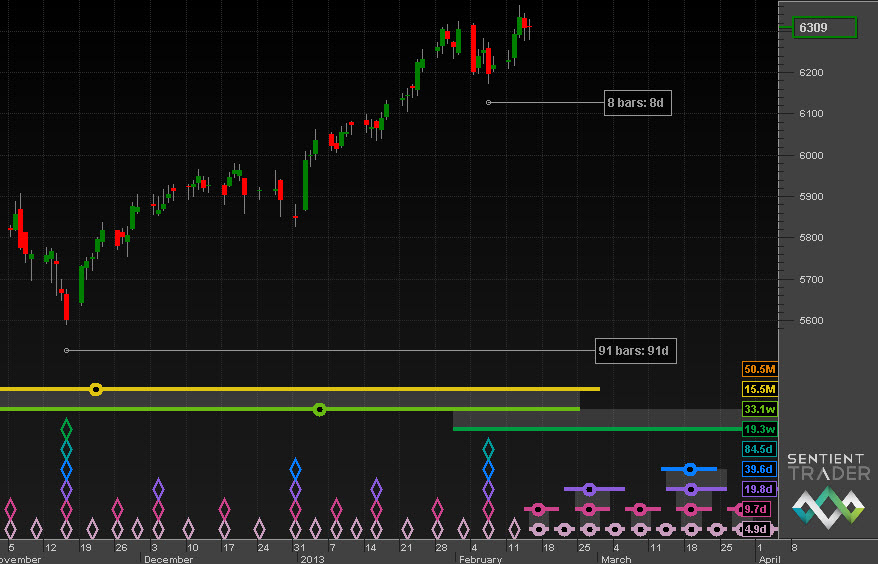
Note how the 80-day cycle trough is looking very much like a developing straddled trough.
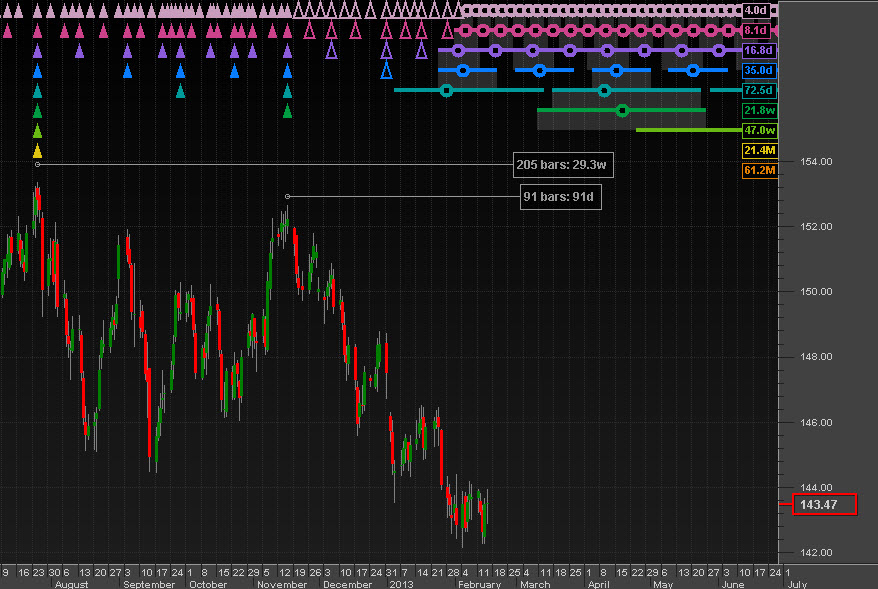
DAX
Hidden on the downside
Here the 80-day cycle trough is looking more like a hidden trough on the downside, indicating that the bearish move has only just started.
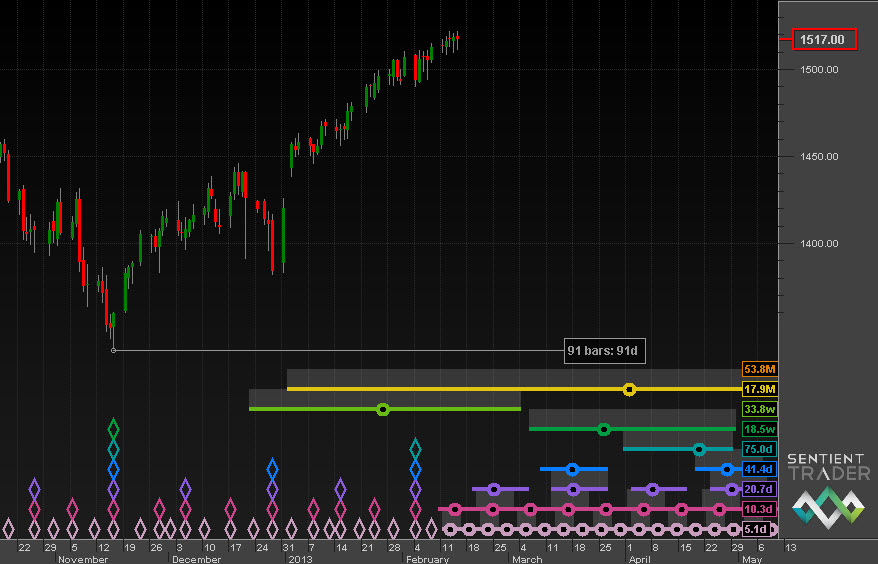
Last week I suggested that the S&P 500 formed its subtle 80-day cycle trough on 4 February. That trough is a good example of a hidden trough, implying that price will extend upwards (as it has done), and we should look to a possible straddled 40-day cycle trough in the middle of March. The peak is imminent, and in the next few weeks we should see the strongest move down since the end of last December as price heads down into that trough.
Nasdaq
A hidden trough
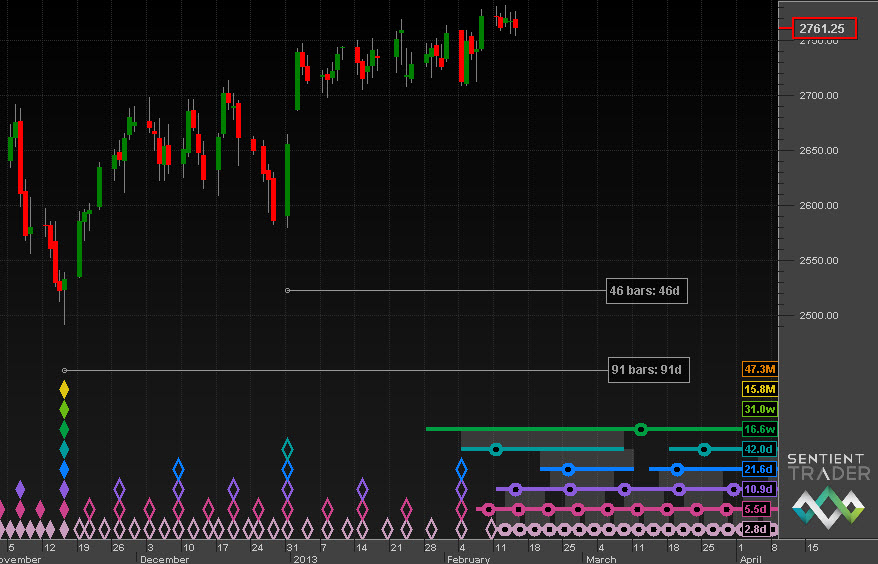
I am tracking the alternate analysis in the Nasdaq which positions the 18-month cycle trough in November of last year. The recent subtle trough on 4 February is a trough of the 40-day cycle, and looks as if it will be a straddled trough, although the recent dominance of the 10-day cycle is causing a good deal of short term volatility while the market effectively moves sideways, making the identification of the longer cycle troughs particularly tricky.
Euro/US Dollar
A straddled trough?
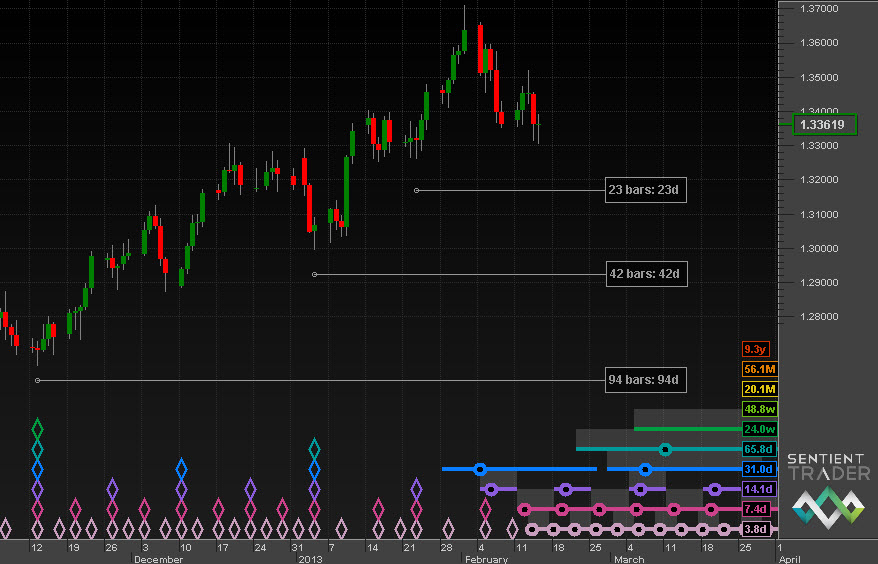
The Euro is forming good clear cycles and so the only subtle troughs here are at the 20-day and shorter level. The 40-day cycle trough is expected to form now.
Gold
No hidden or straddled troughs
Gold is analyzed “inverted”, with synchronized peaks, and so here it is the peaks that might be subtle (depending upon cycle dominance and the amplitudes of the various cycles). The 80-day cycle peak which formed in mid January was not very subtle, but it does qualify, and looks as if it is proving to be a (not very) hidden peak. That implies a further downwards move and the possible formation of a straddled 40-day cycle peak in the next few weeks.
30 Year US Bonds
A straddled peak?
The 80-day cycle peak in Bonds is looking like a subtle affair on 7 February, and thus far the price action has been very symmetrical which indicates that the peak could well be a straddled one.
Crude Oil
A straddled 80-day peak
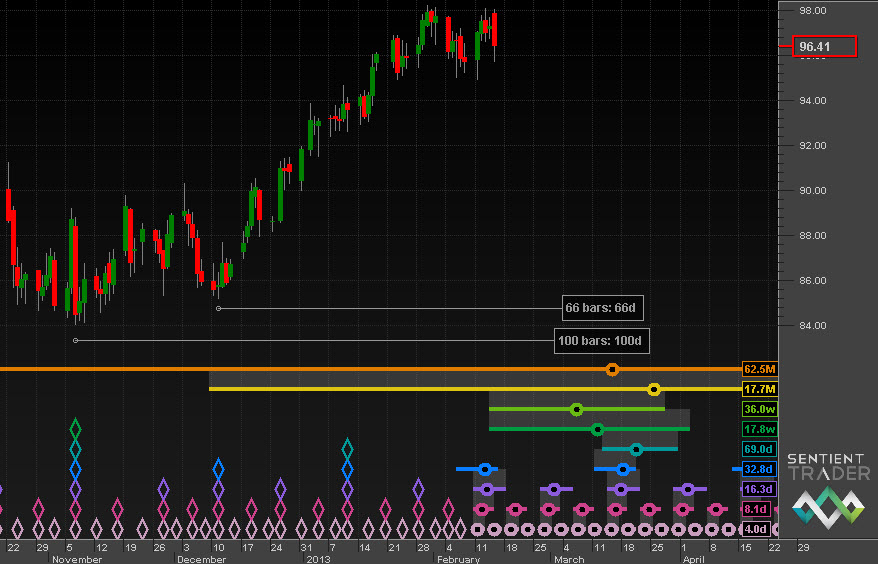
Crude Oil was expected to form a subtle 80-day cycle trough, and the exact placement of that trough is difficult to determine (as is usually the case with subtle troughs). The most likely scenario is that the 80-day cycle trough was a hidden trough in early January and that the trough which formed this Monday, 11 February was a straddled 40-day cycle trough. That would indicate that Crude Oil has formed its peak and is now headed down to the 18-month (perhaps 54-month) cycle trough expected in March. Compare this chart to the second chart in today’s post. Here too we see all the elements coming together: a dominant cycle, a hidden trough and a straddled trough.
US Dollar Index
A straddled 40-day trough
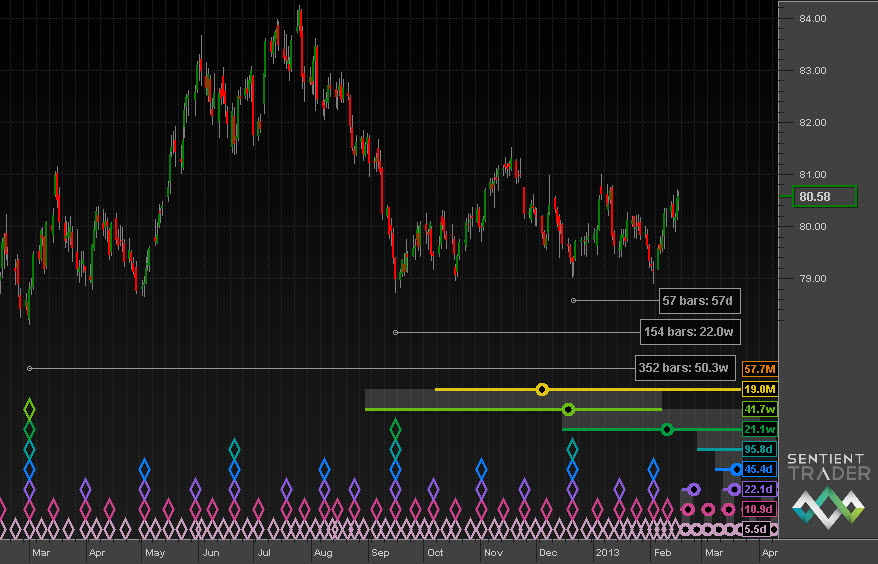
As discussed last week the 18-month (and possible 54-month) cycle trough might well have formed at the beginning of February. There have been no subtle troughs here recently, and as mentioned last week we must watch this bounce for evidence of the recent trough magnitude. Here is the less bullish possibility, that we have another downward leg to go before the formation of the 18-month cycle trough:
Analyzing financial markets according to Hurst’s Cyclic Principles is a constantly fascinating process. The greatest challenge is getting the analysis right when the markets are not exhibiting the clear and obvious cycles that newcomers to the “art of analysis” expect.
The US markets are closed on Monday, and with peaks imminent in those markets caution is definitely in order.
Have a great week, and profitable trading!
P.S. If you are just getting started with Hurst analysis and trading, we have a “getting started” special running for the month of February.
The previous Hurst cycle outlook was provided by SentientTrader.com. They have a very good cyclic software package. You should take a look at the different products they offer.
…………………………………
WORDS OF WISDOM
These are market axioms and quotes that I have published before, but since few people probably take the time to read them on the right margin, I’m publishing them again. I’ve picked up these quotes through the years and found them interesting, plus many are absolutely true. Often, it is the fate of the novice to not recognize these truths for a long time. Clever quips are just that, clever quips. If you have a good quote, send it to me and I’ll post it.
- “The essence of investment management is the management of risks, not the management of returns. Well-managed portfolios start with this precept.” – Benjamin Graham
- The time of maximum pessimism is the best time to buy and the time of maximum optimism is the best time to sell.- John Templeton
- Buy on the cannons, sell on the trumpets.- Old French Proverb
- Rule #1: Never lose money. Rule #2: Never forget rule #1 – Warren Buffett
- The four most dangerous words in investing are “This time it’s different”. – John Templeton
- “This time it’s different” was prevalent during the bubble of 2000. In 1929 it was called “New Economics” – Bob
- History always repeats, only the details change. – Edson Gould – (others have stated it differently).
- If you have trouble imagining a 20% loss in the stock market, you shouldn’t be in stocks. – John (Jack) Bogle
- Stock are bought on expectations, not facts. – Gerald Loeb
- Emotions are your worst enemy in the stock market.- Don Hays
- Herd Mentality – Men, it has been well said, think in herds; it will be seen that they go mad in herds, while they only recover their senses slowly, and one by one.- Extraordinary Popular Delusions and the Madness of Crowds
- Herd Mentality -Cases such as Tulipomania in 1624–when Tulip bulbs traded at a higher price than gold–suggest the existence of what I would dub “Mackay’s Law of Mass Action:” when it comes to the effect of social behavior on the intelligence of individuals, 1+1 is often less than 2, and sometimes considerably less than 0.-Extraordinary Popular Delusions and the Madness of Crowds
- I made money by selling too soon.-Bernard Baruch & Baron Rothschild
- If all you have is a hammer, everything looks like a nail.-Bernard Baruch
- The main purpose of the stock market is to make fools of as many people as possible.-Bernard Baruch
- The hardest part of a bull market is staying on.-Anonymous
- Markets can remain irrational longer than you can remain solvent.-John Maynard Keynes
- Return of principal is more important than the return on principal.-Anonymous
- Hope is your worst enemy in the market.- Anonymous
- Don’t catch a falling knife.- Anonymous
- Spend at least as much time researching a stock as you would choosing a refrigerator.- Peter Lynch
- When you realize that you are riding a dead horse the best strategy is to dismount.- Sioux Indian Proverb
- Don’t ever make the mistake of telling the market it is wrong.- James Dines
- Wall Street never changes, the pockets change, the suckers change, the stocks change, but Wall Street never changes, because human nature never changes.- Jesse Livermore
- Never buy a stock that won’t go up in a bull market. Never sell a stock that won’t go down in a bear market.- Anonymous
- Nobody is more bearish than a sold-out bull.- Anonymous
- The public is right during the trends but wrong at both ends.- Humphrey Neill
- Never sell a dull market short.- Anonymous
- “I sell euphoria and buy panic.” The way he determines that is to wait until prices start gapping in the charts. Gapping on the upside is euphoria, while gapping on the downside is panic.- Jimmy Rogers
- Cut your losses and let your profits run.- Anonymous
- Don’t marry a stock. Every stock must be sold.- Anonymous
- Often times WHEN you take a position can be more important than WHAT you take a position in.- Bob and others
- “If Santa fails to call the bears will roam on Broad and Wall!”- Lucien Hooper
Clever Quips
- A bubble is a bull market in which you don’t have a position.- Anonymous
- A buy and hold strategy is a short term trade that went wrong.- Anonymous
- Let Wall Street have a nightmare and the whole country has to help get them back in bed again.- Will Rogers
- Bulls make money, bears make money, pigs get slaughtered.- Bob’s Grandfather & others
- P/E ratio – The percentage of investors wetting their pants as the market keeps crashing.- Anonymous
- Those who can, do . . . Those who can’t, teach . . . Those who can’t teach, work for the government.- Anonymous
- Wall Street is a street with a river at one end and a graveyard at the other.- Anonymous
- Never check stock prices on a Friday, it could spoil your weekend.- Anonymous
- Money talks, but all mine ever says is “goodbye”- Anonymous
- Don’t gamble. Take all of your savings and buy some good stock and hold it until it goes up, then sell it. If it don’t go up, don’t buy it.- Will Rogers
- October, this is one of the peculiarly dangerous months to speculate in stocks. The others are July, January, September, April, November, May, June, December, August and February.- Mark Twain
- Economists have predicted 14 of the last 3 recessions.- Anonymous
- Market Correction – The day after you buy stocks.- Anonymous
- In 2008 stocks were a good buy . . . . . Goodbye Mercedes, goodbye yacht, goodbye vacation home, goodbye . . . Ed Hart (modified for 2008)
…………………………………
- Click on any picture or chart to enlarge it
All Rights Reserved © ™
