2014 Tweets by Bob
 03/06/17 . . . by Bob Karrow
- My charts consist of all the items that Paul Desmond warned about in his paper, “The Warning Signs Of Major Market Tops”, which you can find at the following link
WAVE COUNTS
- If you aren’t familiar with my unorthodox wave counting method, there is a simple explanation at the beginning of the glossary. The glossary also contains lots of other details (explanations) that don’t appear in the blog.
TWEETS
- A lot of visitors to my blog are looking for information on T-Theory ®. The below link will take you to the index of all of Terry’s comments during the period Dec 2003 to June 2011. There are a considerable amount of charts and audio material from Terry Laundry in this section.
- If you are looking for the ability to make your own predictions using T-THEORY ®, I would highly recommend Terry’s Encyclopedia on T-THEORY ®
- Order the T Theory® Encyclopedia from Paula
EDSON GOULD
Dec 2014 – 130 TWEETS

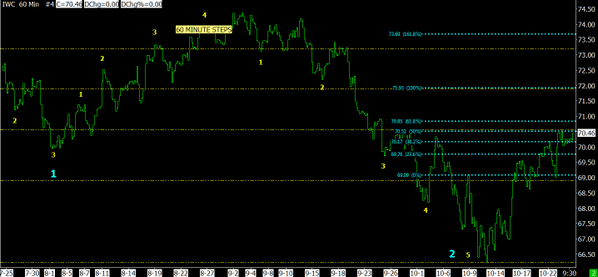
#StockMarket #Investors I think we are in last step down since Dec 26 and most of the step is probably behind us. pic.twitter.com/ZLZhAd13Xc

Did you see #investors taking #profits that aren’t #taxable until 2015? I saw a lot of that today. Next up, is the #decline over???
#Yen – Chart 1 – recovery after 2 steps down. Chart 2 – beginning of a downtrend? Watch yen closely for trend changes pic.twitpic.twitter.com/mE4bxyp1mt


#NASDAQ chart looks to be in the final stages of its present decline. In 3rd step down and waterfall taking place pic.twitter.com/QGVvHc9fQl

#futures #charts, #SP500, #DJIndustrials & #NASDAQ have short term lower lows. First lower low since Dec 16 #reversalpic.twitpic.twitpic.twitter.com/y0u7ip0TTl


Jeff Saut is growing cautious looking for a 1st quarter #correction in the #StockMarket. That viewpoint seems legitimate to me too.
Remember small downtrend in the #yen I showed late yesterday. Present look at it. #StockMarket and yen in lockstep. pic.twitter.com/db8fzXijqG

Bookmark the link for the #yen seen below. Us this link to watch movement of the yen. It’s a great reference for our #StockMarket.
#Yen click link below investing.com/quotes/japanes… This #chart is the inverse of MY yen charts. It moves in the opposite direction of our market
#Yen chart in almost lockstep with our #StockMarket. Notice small decline late today. Need to watch for more decline. pic.twitter.com/LSiKobeONW

Likely be a continuation of uptrend for most of this week. Beginning the following week, there “might” be a small decline. More later.
Since there is not much to report on recently, I’ve been working on an automated method of trading. Something I have NEVER done before.
#Yen has small #trend change & a small decline expected in #StockMarket. Count looks like #yen has 2 small steps down pic.twitter.com/qMdaoDV1R8

#Yen chart with an #andrews #pitchfork showing #resistance at the mid-level line. pic.twitter.com/kDqiJqVgVR

Happy Holidays There is no change in the outlook since the bottom signaled on Dec 16th. The surprising result is the speed of the uptrend.
30 minute chart of #YEN & #SPX. Trades in same direction as US #StockMarket. Compare 2 charts for direction & timing. pic.twitpic.twitter.com/r6T4OiydPx


No one likes information overload because it confuses the reader. If I don’t post it’s because nothing has changed, or I kicked the bucket.
Page 8 on my charts at #StockCharts is new. It compares 17 sector #AdvanceDecline lines. Look at the other pages toostockcharts.com/public/1169350
Market rose today & has been rising for 5 days, yet puts dominate. Turning bearish during a strong move upward seems bold & maybe stupid
CBOE PUT/CALL WAS 1.31 (131 PUTS BOT FOR EVERY 100 CALLS) ISE CALL/PUT WAS .70 (70 CALLS BOT FORE EVERY 100 PUTS) ??? pic.twitpic.twitter.com/JqaspSmwVw


Not much to comment on since the recent bottom. No resistance at the old peak of Dec 5. This time of year is hard to beat until after Jan 1
When I say this is the end of a “3” wave count, that’s me saying that a reversal has, or will take place. That wasn’t made clear on Dec 16
After a 4% rally in 2 days, I would have thought the call/put ratio would be higher. 148 calls for every 100 puts. pic.twitter.com/ock5gmxBLk


$SPY hasn’t had back-to-back gains of 1.95% since March 2009. Could happen today.
An interesting leading #indicator of #business conditions. See how it performed at the 2007 peak & 2009 bottom pic.twitter.com/333Grhf6lB

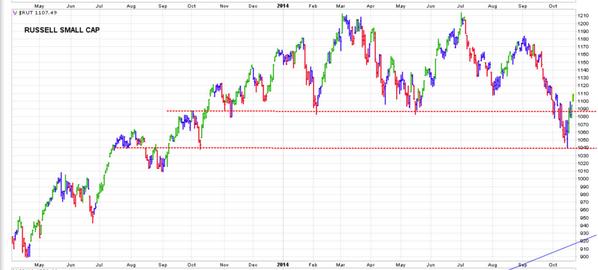
Russell Small Cap ($RUT) is close to prior high in late November. They now have greater relative strength than Lg Cap pic.twitter.com/wN1T3OZ0LZ

I would expect resistance to appear at the old #StockMarket peak (Dec 5). The wave count will determine how long the resistance will last
“If Santa fails to call . . . the #bears will roam on Broad and Wall.” – Lucien Hooper Now the #bears are running for cover on #WallStreet
I nailed the #StockMarket #bottom 2 days ago. Compare today’s #chartwith the chart from 2 days ago (see Dec 16th) pic.twitter.com/k3neCmVGiY

Early yesterday I said, “it must break the downtrend since Dec 5” Duhhhhh, I think we broke the downtrend with Dow up 600 points in 2 days
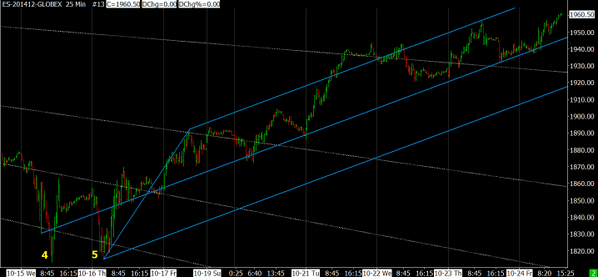
The decline stopped today at the 38% retracement level measuring from the Oct. bottom. pic.twitter.com/ELmcERmudC

No trend break after step 3. We are in a 5 step up? But when you lose track of the count on the upside, that’s great. pic.twitter.com/6ZYx5Gdd4v

The decline after step 3 should break the trend that began from the bottom near “1”. Then should begin purple 2 up. pic.twitter.com/QunFyvqrSE

Current rally looks like other rallies that occurred on the way down since Dec 5 That’s gotta change for good bottom pic.twitter.com/RODIdlbpyz

If the rally breaks the downtrend, will it go on to new highs??? More on that later. pic.twitter.com/lzTKOaS6QY

For this rally to be the end of a completed step down, it must break the downtrend since Dec 5. Hasn’t done that yet. pic.twitpic.twitpic.twitter.com/7VPkmbBRTo


First objective is to see the #StockMarket rally above yesterday’s highs. The rally is very slow & taking its time to make a higher high
Yesterday, I tweeted “We should have completed the present step down in the #StockMarket“. Market #DoubleBottom after that & rallied again.


#JunkBond are NOT making new lows today. That’s an encouraging theme. pic.twitter.com/yO5GxxUukv

Presently, most of the indexes are trying to make new lows. We’ll see if they thrust downward or wander around near this morning’s low.
This is the completion of 3 steps down. If the rally doesn’t materialize, it would mean we will get 5 steps down. pic.twitter.com/GJTlNowXkU

We should have completed the present step down in the #StockMarketFailure to rally significantly would be a bad omen pic.twitter.com/qYgVMGvcBq

#JunkBonds (JNK) are falling at a faster rate. pic.twitter.com/AHefBwYMsB

Weekly #unemployment #claims are not going in the right direction. In this #chart, the claims are shown inverse pic.twitter.com/GiaxugfiCJ

An expanding triangle (#ExpandingTriangle), or #megaphone in the $SPX #SP500 pic.twitter.com/02CayBM37w

The #ADX is approaching a buy zone. This signal isn’t valid until the ADX reverses direction and moves deeper. pic.twitter.com/QP6uOdutUa

The shorter term #oscillator is in the #OverSold zone pic.twitter.com/VTPSW1lUhe

The longer term #oscillator is in the #OverSold zone pic.twitter.com/1jZEdwtZHl

If Santa doesn’t get his butt over to Wall St. soon, it’s gonna be: “If Santa fails to call . . . the #bears will roam on Broad and Wall.”
One more new low & we should rally. The rally should carry back to the 2055-60 area. If not, things will get worse. pic.twitter.com/RFm20E4q6G

U.A.E. Sees OPEC Output Unchanged Even If Oil Falls to $40
#WaveCount indicates should have 2 more declines & then rally after the 2nd decline. It should produce a decent rally pic.twitter.com/wMtAhjuVPk

PAGE 4 CHART 3 – #RYDEX #SENTIMENT Money not moving into bear funds or money market funds. Sentiment is feeling safe pic.twitter.com/UYt9HyeqgT

PAGE 3 CHART 2 – – WEEKLY UNEMPLOYMENT This weeks #jobs report didn’t make for good reading. Jobs chart is inverted pic.twitter.com/PnyRXyt79h

PAGE 2 CHART 8 – – AVERAGE PRICE RELATIVE TO 52-WEEK HIGH from my #StockCharts at stockcharts.com/public/1169350pic.twitter.com/3pWSaLCY9n

PAGE 2 CHART 6 – – #SPX ENVELOPE, SHORTER TERM #OSCILLATORSShort term #OverSold & almost over sold in long term pic.twitpic.twitter.com/iSsw0XgIAn


#DowTheory warning with a non-confirmation in the #Transportation Index PAGE 2 CHART 0 – – DOW THEORY pic.twitter.com/KPPkW5jdqb

PAGE 1 CHART 9 – – STOCKS ABOVE 20 DAY MOVING AVERAGE from my #charts at stockcharts.com/public/1169350 pic.twitter.com/eRwZVSBMcH

#Chart with a name similar to “PAGE 1 CHART 7” or one that has a white background means it comes from my #StockChartsstockcharts.com/public/1169350
PAGE 1 CHART 7 – – % ABOVE 200 DAY MOVING AVERAGE Lower peaks in these charts while indexes move to higher highs pic.twitter.com/PvICxX351u

Declining #AdvanceDecline line peaks versus a rising #Wilshire 5000 index. pic.twitter.com/0jy1KCJiBl

Lower high in the #AdvanceDecline line versus the #ValueLine price Index. This #chart from stockcharts.com/public/1169350pic.twitter.com/gUKb2SAg3i

#Oil prices plunging, #investors are worried #oil #debt issuers can’t meet obligations, predicts #default rate will double to 8% next year.
Some #hedge fund’s are making money on #oil‘s plunge. Any large unanticipated move can cause #bankruptcy. That can affect the entire #market
The #ruble tumbled to a record low for 2nd day, #Russia’s #CentralBankintervened to slow the rout for an economy verging on recession.
The #FED gets very uneasy when #inflation drops below 1%. We could be seeing below 1% figures in the months ahead.
FED should become more dovish after oil prices plunged in recent weeks. U.S. is NOT moving in the direction of its 2% inflation target.
US oil drillers idled the most rigs in two years as they face oil trading below $60 a barrel & escalating competition from suppliers abroad.
#Inflation #trends measured by #bonds & #commodities. #Trends show here before government figures (lagging indicator) pic.twitter.com/UrL8R0pRE3

The #SP500 has strong relation ship with #Vanguard FTSE All-World ex-USA stock index. When will it get back in step?? pic.twitter.com/Sn1bdiC89Q

While the U.S. economy is in much stronger shape than foreign economies, it isn’t immune from foreign stock trends.
IEA cut its forecast for global oil demand for 5th time in 6 months. It attributed lack of demand to weakening global economic conditions.
Other central banks are beginning to throw money at their economies. See a trend yet??? As long as prices don’t decline, there’s no problem.
The deflation cure is to throw lotsa money at the problem. One hiccup, the US and Japan have been throwing lotsa money for some time.
Central banks like a “little” inflation, but when faced with a hint of deflation, they get frightened. The solution to deflation is to . . .
It’s the out of control decline in oil that has me unsettled. I don’t like looking a gift horse in the mouth, but there could be problems.
Lower oil prices is like a tax cut to the consumer and they should spend more money and create a good Christmas season for business.
BUT when prices are cut to gain market share, because they can afford it due to higher profits, others will follow to retain market share
I’m a technician and this is a fundamental problem (??) Oil has an impact on most products. Lower oil prices translates into higher profits.
Oil just keeps falling. The chart shows the last 10 days where oil fell from $70 to about $57. pic.twitter.com/yJPskV7Rlu

#Yen is falling today & that means that our #Stockmarket is up today. #MarketTiming has been almost perfect recently pic.twitter.com/kl0konXz1a

#Junk #bonds are still declining, probably due to their holdings in #oil#shale. No profits means default. pic.twitter.com/QhIqn9rHFD

Today’s #LargeCap #StockMarket #index decline has not made lower lows. Smaller caps are stronger again today. pic.twitpic.twitpic.twitter.com/Y5dehyVKy7


The #Yen is rallying & the #StockMarket is declining. The opposite move relationship is not exact in time, but close pic.twitter.com/exnRvkx4mb

Oil is having a hard time finding time for a rally. It’s just keeps falling. Don’t try to catch the falling sword. pic.twitter.com/5x7Vo0SyQn

Crude could fall to as low as $40 a barrel amid a price war or if divisions emerge in OPEC, said an official at Iran’s oil ministry.
Energy accounts for as much as half the cost to produce food & metals, commodities will keep dropping, say Societe Generale SA and Citigroup
Small caps are performing better than mid & larger cap stocks. Small & Micro cap have made up all they lost on Mon pic.twitpic.twitpic.twitpic.twitter.com/RVEWFhJOoY


“If Santa fails to call, the bears will roam on Broad and Wall.” – Lucien Hooper
“Think of it this way. Lower oil prices are to America what low labor prices were to the BRICs!”… Sara Eisen
#ISE #Sentiment was tilted towards the put side today. 66 calls for every 100 puts. pic.twitter.com/ALhEr31q09

Small triangle showing at the close today in the #DowJones Industrial futures. pic.twitter.com/JEFBT6mw7z

60 minute ADX “may” need more decline to complete the rally signal. This ADX is less reliable than daily ADX. pic.twitter.com/pPej7pJt2K

I’ve shown this #SmallCap #WaveCount before & still don’t know if it’s valid. It hasn’t been invalidated yet. pic.twitter.com/2UwdQJr7TG

Recent lower high in the #NASDAQ, #Transportation #Index, #Financialindex, #Utility index. Others made recent highs. pic.twitpic.twitpic.twitpic.twitter.com/qdV34MrFQt


#WaveCount in #LargeCaps since Oct low appears different & MAY only have 2 steps up. One more gasp for a 3rd step???? pic.twitter.com/oGAbo8vVxn

The apparent #WaveCount in the small caps since the October lows. pic.twitter.com/WXMkKHV5yx

Daily envelopes showing the longer term boundaries of these indexes. Prior chart envelopes were 60 minute bars. pic.twitpic.twitpic.twitpic.twitter.com/SsNyV0HfZq


The envelopes have done a good job of showing upper & lower boundaries of the indexes followed. pic.twitpic.twitpic.twitpic.twitter.com/eNuE6cZILk


Emerging markets have not shown the same strength since the October lows, lotsa relative weakness. pic.twitter.com/Mf0FFydhjp

Upper left section of chart has symbol, time interval for each bar, price, today’s net change, today’s % change pic.twitter.com/B3gvneQumG

#StockMarket & #JunkBond weakness, while a nice rally is going on in #TreasuryBonds pic.twitpic.twitter.com/KELz4xlLUn


#JunkBonds #Bond are having lotsa weakness & are lower than their Oct low. Likely due to defaults coming in oil shale pic.twitter.com/HztzsmCmQJ

Interestingly, the #SmallCap #stocks #index are not as weak as the #LargeCap. pic.twitpic.twitter.com/mf6Ht9PM6K


As expected, the #Yen is rising. Our #StockMarket has had an opposite correlationship with the Yen for some time. pic.twitter.com/oPoJaO9Q29

NASDAQ doesn’t have a meaningful lower low yet. If it happens, we are only in step 2 down pic.twitpic.twitter.com/dTtuQ2qjMT


Hindenburg Omen has been unreliable at predicting tops, however it has been triggered prior to every major top. – Mike Burke on Hidenburg
High levels of new lows, relatively high levels of new highs has triggered a Hindenburg Omen for the past 6 consecutive trading sessions.
Junk bond ETFs may have a significant exposure to debt in oil shale projects, which may default on their debt because of low oil prices
Advisor who isn’t regurgitating typical market babble from Wall St. Original thinking makes him interesting to me. bloomberg.com/video/milton-b…
I’m unsure how much (if any) I will be tweeting this week. Got lotsa irons in the fire at the moment. That’s why I posted lotsa charts today


Daily #ADX gave a sell signal last week & is now moving away from the signal lines. See ADX rules on Page 2 Chart 7 pic.twitter.com/l38TYf5oZ1

Upper line of #Pitchfork for Russell micro-caps is stopping the advance pic.twitter.com/4bW17ujX4b

#Charts are #Russell large-cap, mid-cap, small-cap & micro-cap. Strength dwindles from larger caps to smallest caps pic.twitpic.twitpic.twitpic.twitter.com/B7MFNNbicx


Many indexes gapped down today. Dow Jones Industrials didn’t decline proportionately today. Charts are #SPX & #DJIApic.twitpic.twitter.com/fmC75Cu7jB


#BankIndex made double top at last week’s high, the recent peak is below September high. Banks gapped down hard today pic.twitter.com/qIiV2Hdl5d

Junk bonds had a heart attack last Friday and today (Monday). pic.twitter.com/uUD96C8lJz

If there is going to be stock market weakness, it should come this week & next week. Seasonality has upward bias after that – Jeff Saut
Freaky Friday: More Disturbing Behavior From The #StockMarket – Dana Lyons
If shoppers don’t turn out for Christmas & after Xmas sales, then Wall St can have a heart attack. Gift cards don’t count in sales figures.
Retail sales disappointed & Wall St had heart attack. Lower gas prices, more jobs means higher sales, shoppers are waiting for the good deal
Looking at charts in last tweet, waiting to see lower lows in small caps to signal something significant is happening (probable).
Small cap shows 3 steps up, NASDAQ has 2 pauses & a correction, SP500 & DJIA show an uninterrupted rally until today pic.twitpic.twitpic.twitpic.twitter.com/SucU9DLLoh


Nov 2014 – 102 TWEETS
Yen is rallying & IF continues, US market should correct. They have had a close inverse relationship for couple years pic.twitter.com/6P8NCBWLcQ

Funny but sometimes true. I buy big ticket items during a recession when sales are slow and discounts are very big pic.twitter.com/1iTz0rhDtq

Scenario #2 would take years to complete. If true, a great buying opportunity equivalent to March 2009 occurs during correction after cyan 3
Scenario #2: finish yellow step 5 in cyan 3, begin 35% correction, followed by bull market cyan 4 & 5 pic.twitter.com/zYUsLWYBjd

One scenario based on the wave count, finish yellow step 5 in cyan 3 and begin a major bear market pic.twitter.com/suHk4sldgg

This is the wave count as I see it presently, beginning in 2009 pic.twitter.com/2f03eaFVCV

Last 3 days have been small fluctuations, caused by Thanksgiving. Last 3 days were inside, outside and inside days pic.twitter.com/bQ24Hrqcpz

According to Goldman Sachs, for every 0.50% slowdown in the world’s economic growth, it only affects U.S. GDP growth by less than 0.13%
Is the downward #pitchfork going to hold the upper line??? Purple Bar = #OutsideDay Yellow Bar = #InsideDay pic.twitter.com/7l9IU43KJA

The SKEW is rising again and is at warning levels for a correction. pic.twitter.com/94G7uNkfGE

My public chart link on StockCharts is: stockcharts.com/public/1169350/There are some interesting charts at this link that should be followed.
According to Sentient Trader, the Oct low was a 50 month (4 year) Hurst cycle low. pic.twitter.com/T07XBzVsz5

Sentient Trader predicts 80 day Hurst cycle low in Jan & 40 day cycle low within a week pic.twitter.com/BKCSVRzBcJ

Long Term Viewpoint U.S. #Stocks are 2nd Most #Overbought In History – Dana Lyons pic.twitter.com/0dDOxbz7b2

Interesting cycle for peaks, showing a peak anytime presently pic.twitter.com/6k2LDwRv3J

#JunkBonds, #JNK in a downtrend, looks like 2 steps down completed. The latest & smaller decline shows 3 steps down pic.twitter.com/PV2AUoF4BX

Today #SP500 touched the #peak of the envelope. The #rally should slow more, or decline pulling back from #envelope pic.twitter.com/8QdY7XE1Ki

When the small caps show a significant higher high above the 11/13/14 peak, it will signal step 2 up from the Oct bottom.
I was thinking about posting this chart yesterday showing small caps were oversold & could rally, today they rally pic.twitter.com/gWQpLeb26a

See the relationship of 30 year bond rates to the US #dollar on the chart PAGE 4 CHART 6 at #MyCharts stockcharts.com/public/1169350
A strong dollar creates low inflation, but does that carry over to 30 YEAR RATES, which were declining long before the dollar was strong???
After WWII we had low long term interest rates. This created economic growth & stocks that went up for decades. Future deflation or growth??
The long term cost of money indicates that historically something unusual is going to take place. What is it & when does it take place???
Would you loan money to the Treasury for 30 years @ 3% – NO. But if you thought deflation was going to take place, you would loan the money.
THE PRIOR TWEET SHOWS THERE ARE NO INFLATION EXPECTATIONS OVER THE NEXT 10 YEARS.
The 2.32% yield on 10-year Treasuries compares with 0.80% on 10-year German Bunds & 0.50% on 10-year Japanese government bonds.
Small cap showing the end of a step up, while large cap shows no break in trend . . . yet pic.twitpic.twitter.com/I4tCUp26LX


Daily charts of small & micro caps are declining & #SPX is not correcting . . . yet pic.twitpic.twitpic.twitter.com/v1Y1Vs8iNF


Yen chart, 5th step is not complete but it may be forming, which ends larger 3 down. Yen rally should develop at 3 pic.twitter.com/kfFqOMbhoQ

#SP500 above their 200 day moving average have hit a wall and #DJIA is declining. In general most stocks have slowed pic.twitpic.twitter.com/zoHjK27s0X


Other than larger caps, advance decline lines are struggling. Large caps made new highs, showing a selective market pic.twitpic.twitter.com/9U7cZtgkUu


Japanese economy slipped into recession in the 3rd quarter, a surprisingly poor performance. GDP declined by annualized 1.6% in 3rd quarter
Orange County is recycling wastewater into drinking water by 50%. The filtered water is pure, it goes straight to the reservoirs – – YUMMY
Lower gas prices couldn’t come at better time of year for retailers. They should have good Christmas season, if not, it’s big disappointment
World economy is in its worst shape in two years, with the euro area & emerging markets deteriorating & in danger of deflation – Bloomberg
#MicroCaps & #SmallCaps are losing their relative strength in the last couple of days pic.twitter.com/kvTGf5EPUX

Current average price relative to the 52 week high low, expressed as a percentage – This index is still trending down pic.twitter.com/YanC5vb1ni

Current deterioration in the number of stocks above their 20 day average #NASDAQ & #NYSE pic.twitter.com/5BdVka3Jrr

#NYSE & #NASDAQ indicators high / low and high – low for each index pic.twitpic.twitter.com/r4oTkT186Q


Showing dwindling upside momentum in the new highs for various indexes. This is “PAGE 1 CHART 5” of my charts. pic.twitpic.twitter.com/NJaQp6HBdw


My charts on #StockCharts is at stockcharts.com/public/1169350 I update the pertinent red, green alerts & #TrendLines about once per week
4) Thursday’s 0.93% loss in the Russell 2000 was the 4th worst ever on a day the Nasdaq 100 made a 52-Week High – @JLyonsFundMgmt
3) On Thursday NYSE Breadth was the 3rd worst ever for a Dow Jones Industrial Average 52-Week High – @JLyonsFundMgmt
2) On Thursday breadth on the Nasdaq was the 2nd worst ever for a 52-Week High in the Nasdaq Composite – @JLyonsFundMgmt
1) On Thursday breadth on the NYSE + Nasdaq was among the worst ever on an up day in the S&P 500 – Dana Lyons
My thoughts are that the #index #futures could #rally on Sun – Mon one more time & then correct. But nobody bet the farm on that #prediction
Indications that we could get a small #correction in the first half of next week #Market is so strong that predicting a correction is crazy
@Stock_Trend_Chg #yen 30 minute chart looks like it’s in a 5 step #WaveCount
#Russell #Microcap index in both charts with a RSI on #1 and a stochastic indicator on #2 pic.twitpic.twitter.com/SKy3kMg2QC


Possible wave count on the falling #yen The Yen has been falling in perfect tandem with our market rising. pic.twitter.com/Ff3xPRWpNx

I’m cutting down the number of charts that I have in Sierra Charts. If I don’t have the time to look at each chart every day, it’s junk.
An #EMA #MA #trendline for buy and sell points. pic.twitter.com/vOkEm6hfw4

A “possible” wave count, which is probably step 1 of 3. The trend break will determine when this step is broken. pic.twitter.com/KxNn7hKcFv

A disparity is occurring presently. A slowing of the advance is enough to cause this small non-confirmation. pic.twitter.com/kOvs7UNl1A

I posted this chart some days back. When prices met the max envelope line, the advance slowed considerably. pic.twitter.com/hwUWMcqS6K

Not a month since blastoff on Oct 16 & the #SPX has gained more than 12% Not tweeting much lately as I wait for something new & significant
No MAJOR divergences in my charts, but the market is VERY overbought Jeff Saut is cautious short term, but very bullish for the long term
The Yen is falling again. This has translated into higher prices for our market. QE has shifted from USA to Japan. pic.twitter.com/2Q5NmBQBov

Friday was day 17 of the buying panic that began on Oct 16. Buying panics “normally” last 17 to 25 days. Trading top is due – Jeff Saut
Yen chart 1, SPX chart 2 Yen is moving up today. If it continues next week, watch our market’s response. pic.twitpic.twitter.com/R5t7QBt8hJ


Ukraine Liveblog: Intense Shelling In Lugansk Region. interpretermag.com/ukraine-livebl…
Ukraine’s MFA: Russian invasion — 30 trucks, radar equipment, 32 tanks, & 16 howitzers entered Ukraine near Lugansk bit.ly/1wCcCya
DJ Transports have achieved their measurement level from the inverse head and shoulders formation formed since 2007 pic.twitter.com/WikL01jl4H


“& buy an asset in the 2nd currency” They would buy stock & bonds denoted in the 2nd currency. This is important buying power for our market
Carry trade is like shorting the yen. One way is to borrow the yen, trade the yen for another currency, & buy an asset in the 2nd currency.
Large caps are pushing ahead and smaller caps are farther behind. We’ll see if the market can breakout and make significant higher highs???
Long inverse head and shoulders in the transports is almost at the projected level. pic.twitter.com/7h4U7iVVBS

#Futures in recent minutes failed to make new high. “IF” market closes for a loss today, we would have a reversal day
Today’s comparitive market action between #SPX #futures and #NASDAQfutures. pic.twitpic.twitter.com/Bbp78AFf7D


Two possible gold wave counts. Yellow wave counts see an end in sight, but cyan count says bottom is long ways off ?? pic.twitter.com/IkA4ZCX52a

#fibonacci fan line based on 2000 peak and 2003 low pic.twitter.com/1lGzi11BH4

#RUT Russell small cap chart with possibly valid trend line. pic.twitter.com/z4FCGTCHol

Won’t be clear if we are are ending step 3 for awhile. It ain’t over until its over. pic.twitter.com/6P9iW2uGpq

#SPX chart #1, #DJIA chart #2 Touching upper envelope means slower going upward or down. pic.twitpic.twitter.com/kych4vvvVg


Measurement prediction after recent lows. Almost made it to the predicted high & missed by 3 #SPX points pic.twitter.com/Zse5RJJCxp

Going into a small 3rd step up in #SPX #futures. We’ll see if breakdown takes place afterwards or something lesser. pic.twitter.com/hkTJRRsW4d

Junk bond recent weakness. Junk bonds have always been the canary in the coal mine. pic.twitter.com/wbako4kMBu

#LargeCap chart #1, #MicroCap chart #2 Smaller caps are edging downward quicker than the larger caps pic.twitpic.twitter.com/6VJVKjrweZ


Our QE program has ended, but Japan’s QE still goes on with a recent boost upward on 10/31.
Yen chart #1, SPX chart #2 The #yen and #spx since late 2012. Oct 2012 saw the end of a correction. pic.twitpic.twitter.com/EUn6Do52Bk


On a positive note, the #yen is still falling making a new low today. Falling yen is positive to a rising market here pic.twitter.com/Wp76HiQlO5

Junk bonds are falling again. Most indexes haven’t made significant new highs, some haven’t made new highs. Meaningful? Maybe, but be wary
A correction could finally take place in the market. But it’s possible we could be having a high level correction presently. We’ll see later
1st chart is SPX, 2nd chart is SPX futures Look at 2nd chart, the advance has made little or no headway since 10/31 pic.twitpic.twitter.com/lXxIfcx7MG


Lots of pessimism after the strong rally. Ratio calls/ puts was 81 or for every 100 puts bot, there were 81 calls bot pic.twitter.com/9mF4sv39PK

Explaining Quantum Mechanics, with more weird stuff ???sciencedaily.com/releases/2014/…
“emotional low” followed by rally, then 6-8 weeks of consolidation, SPX declines & tests the low & sometimes breaks below low – Jeff Saut
V-type bottoms are rare, & that’s what we saw on Oct 15/16th. Typically what happens is a decline into an “emotional low” – Jeff Saut
Nikkei with downtrend line and 2009 pitchfork. Recent uptrend in Tokyo attributed to declining Yen pic.twitter.com/3tigZQXWnd

Look for Republicans to win back Senate leading to upside blow off in the market, which I would use to take some profits – Jeff Saut
#History always repeats, only the details change – #EdsonGould Edson Gould’s #FindingsandForecasts articles stock-market-observations.com/category/2-eds…
Super Secret Indicator DJUA participated in correction. Previously it rallied during a correction. Attention needed. pic.twitpic.twitpic.twitter.com/9orc4G2Pcu


Super Secret Indicator DJTA participated in correction. Previously it rallied during a correction. Attention needed. pic.twitpic.twitpic.twitter.com/EkDmOC3pFO


Super Secret Indicator DJIA participated in correction. Previously it rallied during a correction. Attention needed. pic.twitpic.twitpic.twitter.com/Dx0saoG30F


Maybe we will have a blowoff phase (lasting months) before we have a market correction. Money trumps EVERYTHING.
The Yen (green area) is shown INVERSE to match the stock market direction. The YEN could be a BIG deal in our market pic.twitter.com/Ytp9pHPOD1

Previous tweet – you can see that the falling yen affected our market for a lot of months. This “could” mean our market will rise for months
Keep your eye on the Yen for direction in our stock market. Yen fell after BOJ increased monetary stimulus 10/31/14 pic.twitpic.twitpic.twitter.com/b8Q0IVrUXY


Oct 2014 – 320 TWEETS
One of the measurements targets today’s level. pic.twitter.com/mdT168v7a3

Russell lg to micro cap are on the envelope limit or exceeding the limit. Beginning of slower rally or minor reversal pic.twitpic.twitpic.twitpic.twitter.com/KeM24KxjxH


Hard to count rally so I’ll resist trying to count because it’s been wrong. The channels are trying to tell a story pic.twitter.com/dvSimeXkTl

Upper yellow trend line was tested and crushed. Blue pitchfork midline is still in force. pic.twitter.com/uKnNEBn2c2

Dow Theory Buy signal occurred today. Does this mark a parabolic phase or blowoff? We won’t worry about that for now. pic.twitter.com/BrzwAWsYVg

Smaller caps still leading off of the bottom. They lead market down and now lead upward. pic.twitter.com/k2qH2U6SjP

#Chart is still relevant, penetration of trendline today wasn’t important. Now we’ll see if top line is in force pic.twitter.com/HSj0YCL11v

Nighttime activity for #SP500 #futures pic.twitter.com/Tlw4txM3qN

Comments indicates confusion on how I count steps. First, it’s NOT Elliott Wave. Read the link to understand. stock-market-observations.com/category/3-rea…
#Nasdaq ended the day with 2 steps down. Lg caps only have 1 step down. More steps to come? pic.twitter.com/XYJNgxrcU6

How the chart ended the day that I was watching closely today. Support came where expected. What happens tomorrow??? pic.twitter.com/4sMEXylu1a


So what happened with the FED? We are “possibly” in a downtrend but unproven until we see lower lows. Presently, it’s a sit and wait game.
Market could rally and then correct, or correct after FED statement without a rally. Market does everything to fool you. That’s way it works
Failed to draw trend lines on prior chart. pic.twitter.com/I7XlMBjMxG

Junk bonds (JNK) fails to participate in rally recently. Obviously forming a triangle. Watch for breakout, up or down pic.twitter.com/RGCS0Y7siU

What is unexpected price action??? Lower lows and lower highs are very good ones.
All reasons to be careful, but don’t abandon ship yet. Wait for a good reason to take your profits and that means unexpected price action
The #NASDAQ is very close to the peak before the recent meltdown. Trading with a lower high at the moment. pic.twitter.com/ywBpla3kWy

1st chart #SP500, 2nd chart #DJIA, 3rd chart #Nasdaq. Failure today to make high on 3rd chart. WATCH CLOSELY TOO pic.twitpic.twitpic.twitter.com/CkTS9F3CCf


A chart I’m going to watch very closely today. If there is disappointment in FED statement, chart will be important pic.twitter.com/yHzRMF3qVu

@taxfreelt I don’t use Elliott 4 my counts. I count the thrusts up & down. Translating into Elliott, we are probably in short term 3 of 5.
Does the present advance show we are only in 2nd step up??? A real possibility. pic.twitter.com/WBvMACvk8X

#SP500 breaking last downtrend #fibonacci lines, showing uptrend #fibonacci lines are now relevant pic.twitter.com/znxNCd2OYW

Sweden’s Decision to Cut Key Rate to Zero Shows Low Inflation Is Trumping Financial Stability Concerns
Financial Sense website, Chris Puplava recently quoted central bankers who expressed view that ending stimulus right now could be premature
If market continues advancing up to FED announcement, expect market to advance after announcement. Sometimes the post advance can be brisk
A nice breakout to the upside for the micro cap and small caps. DJ Transports at a new high today. JNK is lethargic pic.twitpic.twitpic.twitter.com/Xg3M9uN4rp


@Stock_Trend_Chg The uptrend may not be finished yet. Another knock on last week’s highs and then correct. Significant highs not expected
Jeff Saut has a very good record, but my question is where is he at & who is doing his updates ???? I hope everything is OK with Jeff.
advise some caution here and it may make sense to wait for a better entry point for any new purchases – Jeff Saut
Due for another round of selling, but not all the way down to the recent lows if current strength is to be believed. – Jeff Saut
What happens if Republicans win the Senate? Voters are pissed & anything is possible. It might be one of the problems bothering stock market
Good looking 2 steps down in #JunkBonds #Junk #bondspic.twitter.com/Z8tLDCnhlr


Elon Musk said “With artificial intelligence, we are summoning the demon.” Biblical said MarketWatch, I say he realizes the future problems
In the small cap wave count below, we would expect the rally after step 2 to be higher in time and price than what occurred in step 1.
At the moment the symmetry looks good in the small cap wave count, but that can be destroyed easily. Presently, it’s just a “what if” idea.


Smaller indexes show more than 1 step down. Large caps show 1 step. Meaningful? We’ll find out soon enough. Charts follow in next tweet
If market slogs through here without SIGNIFICANT new recovery highs. It could represent 3 steps up and then we might resume the decline.
The volume is falling, the volume is falling This happens every time after heavy liquidation & doesn’t mean anything. pic.twitter.com/tUpTAZIOOQ

Today the smaller cap step count is easier to determine than larger caps pic.twitpic.twitter.com/UGIlOxWrr8


Market is having problems making a significant #HigherHigh. This is exactly where we would expect resistance to occur pic.twitter.com/vIrlaSFFNO

Downtrend #Fibonacci fan lines is still working and has turned market down pic.twitter.com/VTjk4HHhbG

Market is breaking short term uptrend channel – ending the count for this wave pic.twitter.com/QiY1MjHlFh

Since rally began, market hasn’t traded below mid-line, today it broke thru & has resistance to mid-line on upside pic.twitter.com/j6q5sKa9OJ

True #deflation is a huge problem to overcome. Japan represents a modern problem in deflation, while the US in the 1930s was the standard
True deflation turns into the opposite of inflation. Consumers wait to buy because they know they can buy for less in the future
Deflation from a lower demand, like the EU – can be big trouble. Deflation from a boost in supply, like the U.S. gas boom is beneficial.
My early investment history on my blog. Some of it’s goofy because all newbies screw up badly – sooner or later. stock-market-observations.com/2013/12/05/124…
#EdsonGould writings on my blog. These articles probably can’t be found anywhere else on the internet stock-market-observations.com/2014/07/20/eds…
#TerryLaundry‘s #TTheory® lessons on my blog courtesy of T-Theory® Foundation. stock-market-observations.com/category/terry…
Terry Laundry’s T Theory® lessons on my blog courtesy of T-Theory® Foundation. stock-market-observations.com/category/terry…
Edson Gould writings on my blog. These articles probably can’t be found anywhere else on the internet stock-market-observations.com/category/2-eds…
History repeats because people remain the same & continue to make the same mistakes over & over. On Wall St, fear & greed rule forever
Perfect example of an old book being pertinent today. “One Way Pockets” written in 1917 and as true today as then. amazon.com/ONE-WAY-POCKET…
Don’t make the mistake that if a book isn’t relatively new, it isn’t pertinent. I made that mistake early in life and it was a big mistake.
“Memoirs of Extraordinary Popular Delusions and the Madness of Crowds.” is free because the copyright ran out (1852). Great History book.
Download a free book about crowd behavior. “Memoirs of Extraordinary Popular Delusions and the Madness of Crowds.” books.google.com/books?id=NmEOA…
CNBC ratings match public participation in market. Naturally novice will follow CNBC & eventually lose in long run pic.twitter.com/S2l65TMC3V

Thankfully not everyone follows CNBC & find it to be nothing but Wall Street gloss and cheerleading. Good for them. pic.twitter.com/0MJLPFXDvF

Why do so many listen faithfully to talking heads on CNBC? Only a couple of talking heads know what they’re doing. The rest are THE CROWD
If you bought the rally as directed, hold on tight. The hardest part of a bull market is staying on. – Anonymous
The market had it’s best week since January 2013. That was a kickoff surge in the market. Is it true again?
Individual people have all the rights, the masses have none – at least the NJ ebola scare nurse thinks that’s true.
Nurse at N.J. Airport Criticizes Ebola Reaction – USA, when I was a kid with measles, health dept. posted our house with red QUARANTINE sign
Why did the EU just do a bank stress test? USA been doing that since 2008. But we all know in similar situations, they’ll fail, test or not
These banks must/will raise capital quickly as the EU is in danger of recession. Bank failure’s can only make an EU recession worse.
France & Spain had no bank stress failures, while Germany had 1 bank fail. Greece, Cyprus, & Italy had the most failures.
EU – 123 banks in 22 countries went thru stress test, 24 banks failed but should have been 34. Weakest EU countries had the most failures.
What the FED will do next week by Mohamed A. El-Erianbloombergview.com/articles/2014-…
Major correction from the peak would carry back to the peak of large step 2 (May 2011). That has good symmetry to it pic.twitter.com/yl7lVB25Er

I can’t discount that we just finished step 4 and not step 5. More upside to go if we just finished step 4. pic.twitter.com/UYHZdwA4NH

Strongest period of the 4 year Presidential Cycle, starts late October of the 2nd year running through August of the 3rd year – Mike Burke
65 month #cycle from important bottoms pic.twitter.com/ajjPnYKnfI

#Wave #count in the #DJ #Industrials since 2009 pic.twitter.com/Lrjsx8deEG

#Fibonacci lines in #MicroCap since 2009 pic.twitter.com/TwTrg1MzSJ

An interesting #chart showing all of #step 3 since 2011 pic.twitter.com/IUy485HX3X

One example showing the possible ending of the #BullMarket with a 5 count in the #NASDAQ #composite pic.twitter.com/hEVjck7JqU

#Envelopes doing their job of showing limits of #uptrend and #downtrendpic.twitpic.twitpic.twitpic.twitter.com/ptpPkZHpBK


#Envelopes doing their job of showing limits of #uptrend and #downtrendpic.twitpic.twitpic.twitpic.twitter.com/SXG0WKVI44


Look at the #DJ #transports go on a tear to the #upsidepic.twitter.com/jFkuZ2ktBy

Not much of an #uptrend in this #EU #Currency #ETFpic.twitter.com/2JleNZGkzq


#Pitchfork for #nasdaq since 2009 bottom pic.twitter.com/aLUo7TcQyu

#DowJones #uptrend lines since March 2009 bottom pic.twitter.com/a69FSH4KeP

A possible #trendline containment in the #DowJones #industrialspic.twitter.com/OklV9J7vkZ

#SmallCap & #MicroCap #index appear weak compared to lg cap. Lg cap recent correction looks like a blip in #uptrendpic.twitpic.twitpic.twitter.com/go7EEW66O9


Upside #projetion levels from recent bottom pic.twitter.com/8TBuAdBIEG

#Projection levels from prior #downtrend may still create resistance on the #upside pic.twitter.com/aXLmJ6rGDL

#Fibonacci lines from #downtrend #peak that may cause resistance in the #SP500 #Futures pic.twitter.com/KlEa3TnXKt


#Fibonacci lines for #DowJones Industrials #Futurespic.twitter.com/xOUybcdj6S

#Fibonacci lines for short term #uptrend in #SP500pic.twitter.com/c60uYW5VSh


#retracement & #projection levels match at present price. Obvious consolidation level after 5 #steps up pic.twitter.com/YVwWFiHc3T
#pitchfork in this chart for micro caps with a declining RSI line. The declining line could be setup for a correction pic.twitter.com/1jT2ItzbT8

Notice the #declining #RSI line in this #chart for the #sp500pic.twitter.com/6XduLiQm6T

Fibonacci lines that appear valid as they are support and resistance. pic.twitter.com/FFc7NOHVFi

2 steps down tonight. Good sign if market won’t retrace & allow another good buy point. Be aware of all alternatives pic.twitter.com/WI1egNYhuJ

THE PARTIAL SOLAR ECLIPSE OVER NORTH AMERICA OF OCT 2014live.slooh.com/stadium/live/t… pic.twitpic.twitter.com/yCmCmd1Mcz


Chart 1 – large caps, chart 2 – micro-caps. Small caps don’t have as much rally power as large caps. pic.twitpic.twitter.com/7n5L91tdqM


Bears are surprised at the rebound as they fail to understand how ADDICTED the market has become to liquidity.
@Stock_Trend_Chg Uhhhhh . . . mostly less than 3 days. If this market breaks further away from the the Tue top that would be a good sign.
@Hoefgeest that was made famous in the USA during the Vietnam era

Multiple 90% Down Days Since 2012 Post: tmblr.co/Zyun3q1SpBoNtpic.twitter.com/X2pUcqfAZ2

I think I failed to mention that today’s correction is probably not finished. It should be done in 3 days or less.
My gut says this isn’t the end of the #BulMarket, it’s an example of “what if” thinking. The #megaphone peak is probably several years away
@wekim77 My gut says this isn’t the end, it’s just an example of “what if”. I think the megaphone peak would be several years from now
If worst case #WaveCount scenario is correct, things don’t go to hell immediately. Hell takes awhile to arrive & tops take time to evolve
If purple 3 is correct, cyan 3 is automatically generated & white 3 is automatically generated. Purple 3 is important pic.twitter.com/GSSdN3jWlI

#Chart with worst case scenario for the #WaveCount showing #BullMarketis over?? Count to purple 2 is correct then??? pic.twitter.com/XWk4kCw1KQ


The sky is falling . . . the sky is falling pic.twitter.com/rQjveQZjFw

SP 500 has hit a Fibonacci retracement level. These can be levels for the market to take a breather. pic.twitter.com/h4gHuPVVZz

Potential support and resistance 2nd chart shows levels above current prices pic.twitpic.twitter.com/ZqHPUjSf5y


“With central banks more concerned about a return to recession than about asset-price bubbles, they have little choice but to step back in”
PAGE 2 CHART 4 – – SPX ENVELOPE SHORTER TERM OSCILLATORS Short term oscillators hit overbought, but we know market doesn’t have to turn now
The upward angle of the rally changed today. It has a much steeper angle presently. We’ll see if that’s meaningful pic.twitter.com/1NGfA8kUt9

Well that looks like a good rally Rally began last Thursday & it’s more than 3 days old, we “could” not should, have a short correction here
Investors in $3 trillion of assets have been warning of the potential for “stranded assets” — oil projects that turn unprofitable.
Roughly 3 million more barrels a day are being produced now in the USA than in 2011.
Most shale regions are profitable below $80, including the Bakken & Eagle Ford formations. Eagle Ford would still be profitable at $50 oil.
Bond holders who have loaned money to oil prospectors are getting worried they won’t get paid back.
Crude prices near $80 a barrel, about 25 percent of the synthetic crude produced from the sands is no longer profitable,
Sweden’s Submarine Whodunit Brings Cold War Back to Baltic Sea
Oil at $80 a Barrel Muffles Forecasts for U.S. Shale Boom
. . . become the biggest oil producer in the world by 2015 When pigs fly.
International Energy Agency predicted in Nov, the US would pass Russia & Saudi Arabia to become the biggest producer in the world by 2015
Oil dropped to $79.78 a barrel on 10/16, the lowest since 6/12. At that level, one-third of U.S. shale oil production would be uneconomic !!
We had mini retest on 15th & 16th, but larger one “could” take place. I will be ready for anything on another retest pic.twitter.com/QmUTQY0IGC

Now I’m more interested in the quality and probable longevity of this rally. Seems OK so far. Hasn’t finished step 1 up yet.
We could have more downside, steps 4 & 5, but it doesn’t seem likely at the moment. It’s more likely that this phase of decline is finished.
Lotsa damage done to this chart that had formed higher lows for a little over a year. We’ll see the quality of rally pic.twitter.com/BSWbfmABBN

Watching to see if we get higher highs in this index. That would indicate better things ahead. Otherwise . . . pic.twitter.com/k5aLS64C8i
A pitchfork to watch because of the diversity of this index. pic.twitter.com/7nGJ2q50Xx

Money market funds zoomed upward in assets but bear funds never got in gear. Wonder why, raises other questions?? pic.twitter.com/5LMBAoxmXv

Smaller caps continue to outperform as they lead the bounce upward. pic.twitter.com/9nHQUQskUg

Volume spike on Wednesday. Climactic day is probable. Only question is how far does rally go? For now we won’t worry. pic.twitter.com/KaLFd9XsVG

Deepest longer term oversold in volume since 2012, same oversold in advancing issues since 2013 & 2012 pic.twitter.com/8jbzZZaHJd

@wekim77 Count got goofy at purple 2, cuz chart shows purple 3, which automatically generates green 3 & end of bull market. Don’t like count
Looks like we are getting the typical bounce around the +-500 level in the summation index. pic.twitter.com/MWYXN5CxIQ


The bounce above 20 day MA has been quick in the NASDAQ and NYSE. It has a way to go before reaching the “norm” pic.twitter.com/JgTCvYtkI0

Put call ratio has worked itself in buy territory and has been there a few days. pic.twitter.com/COMBHsuvf9

The downside count for the recent decline showing the SP 500 during trading hours only. pic.twitter.com/ol9REWWrsZ

Prior tweet count, the count after purple 2 could all be one correction. That looks good at the moment.
Long term count since 2009. Count gets odd at purple 3, which generates green 3 (bull market end). Possible, but??? pic.twitter.com/RYZl9ovwJg

Potential pitchfork trend lines on the SP500 futures. pic.twitter.com/tR4XAmrTZc

Prior tweet shows the possibility that another step up could take place, step 5. I’m not fond of that count, but it’s certainly possible.
Pitchfork gave support near the bottom. pic.twitter.com/0yFy6MpQW6

SPX consolidating at 200 day MA line. pic.twitter.com/beBc6w15Vf

Lotsa RV stuff to do next couple of days, so I’ll post later (after close likely). Lotsa stock stuff needs my attention, but market OK temp.
ADX red/green lines have turned, a buy zone had occurred. If lower price should occur, it’s probably not meaningful pic.twitter.com/BWWSy4Wbky

I’m BACK I had no cell signal for the last several days, no Verizon or ATT, had no idea what happened in the market. Nuthin’ to say yet.
A neutral reading on put calls from ISEE. I don’t like it. pic.twitter.com/ylBxHdvsU1

I have Sierra charts & a data feed. Lotsa nice charts, but too many & the obvious can elude me. I eliminated some charts to focus better
For any newbies out there, click on the chart to enlarge it so you can see the detail
Significant indexes have penetrated lower line of envelope indicating rally soon pic.twitter.com/SpS3TO8aPQ

Significant indexes have penetrated lower line of envelope indicating rally soon – one more envelope chart next tweet pic.twitpic.twitpic.twitpic.twitter.com/tBPkIIglXz


Significant indexes have penetrated lower line of envelope indicating rally soon – more envelope charts next tweet pic.twitpic.twitpic.twitpic.twitter.com/iMwXEc1TDo


Small caps led this market down and should lead the market up. We’ll see.
Just saw Russell small cap (RUT) & it indicates decline may be finished for now. It has higher highs. pic.twitter.com/HRRTZqxPSp

1st higher high is 1893 (futures). Meaningful higher highs is at 1970 (futures) and should be a channel break pic.twitter.com/QJ91BvjQr8

Current step only shows 4 steps down. Channel break determines when step is finished though. Watching carefully pic.twitter.com/KiWhvpyHN2

I’m looking for higher highs which will indicate that a step is finished & a channel break has taken place. A higher high is way up there
A different downside measurement. 2nd chart is further downside projection on the same measurement settings pic.twitpic.twitter.com/ODH0eHKfmj


Wonder if market is more worried about ebola than government. Think what ebola outbreak in USA & EU would do to trade. Restriction galore.
The 30 minute ADX peaked & began falling indicating a rally The daily ADX has not begun falling & no rally indicated pic.twitpic.twitter.com/kTHyMIOZWM


Intraday put call figures, CBOE and ISEE. They aren’t heavily tilted towards the puts, just leaning that way. pic.twitpic.twitter.com/T5SSrawd2N


I’ll be looking at todays put/call figures. They should be lopsided towards the puts. CBOE Futures Exchange Reports Busiest Week In History
One thing is for sure . . . It ain’t over until it’s over. I’ll work up some measurement charts for where we might go on the downside.
Prior tweet shows the possibility that there is more to go after this step is finished. Strap your helmet on tight & batten down the hatches
This chart shows that we are possibly in larger step 2 down. If true, 3rd step could be a waterfall or double bottom pic.twitter.com/54il3uMHmi

1st chart is JNK bonds, 2nd chart is TLT bonds Abandoning junk bonds & taking refuge in T-bonds during this fiasco pic.twitpic.twitter.com/ygspefm4gz


The 1st chart shows 2nd step down. Large cap charts are messed up for counting. See 2nd chart of SP500 pic.twitpic.twitter.com/TcU08VuYGF


The daily chart is probably the best place to look for the correct count. Likely we are in 3rd step down, BUT if “could” be in larger step 2
Often times I’ve seen Fibonacci lines crushed in waterfalls. I usually have to redraw steeper lines after normal looking lines are ruined
But this is a happier looking chart becuz it shows that we MIGHT have a downside target for the moment. (more) pic.twitter.com/9PFxCgMUlU

I remember that day in #1987 & the FACES of the floor traders! Many were wiped out & couldn’t believe it. I wasn’t even in on that day.
HISTORICALLY, in 1987 market fell over 20% in 1 day after several large daily declines prior to climax day. 1987 was a disaster for market.
Can you spell WATERFALL? And this might not be the worst part, logically we should rally after today, but logic doesn’t always win out.
Not quite as many bears as yesterday, but still heavy shorting by way of the puts. pic.twitter.com/vh5qQXBmA3

John, what did you think of the team’s execution (Tampa Bucs)? “I think it’s a good idea” – John McKay Gotta love that sense of humor
@PelicanPierre @spirocks And the Rams executed that game plan perfectly.
Risk management to me has always meant run like hell when you’re convinced the bull market has ended. Gotta arrive at that conclusion timely
@taxfreelt I don’t label like Elliott, but using that terminology, we “could” be ending 5 since March 2009. Too early to be definite
And now I’m going to go outside & play with the other kids. Maybe a game of kick the can – did you ever see that particular “Twilight Zone”
Look at the big rally in bonds. This is why junk bond sentiment has been declining since January. pic.twitpic.twitter.com/TbaEmhdMSP


Another junk bond etf with no sign of a bottom showing. pic.twitter.com/CQdAfMgX11

Junk bond decline since late June peak pic.twitter.com/m24lEEyN80

NASDAQ pitchfork beginning in 2009. Notice the common overthrow prior to the end pic.twitter.com/N3bzq2apoL

On prior tweet #chart, a decline to the lower line would be a 20% decline. Lower line begins contact points at the March 2009 low.
Channel defining bull market since March 2009. It’s common to have an overthrow surge at final stage of bull market. pic.twitter.com/AlHpTYaZlh

Pitchfork on the SP500 since June 2012 defining step 3 of step 3 since March 2009. pic.twitter.com/QMruwQRptR

ADX extreme levels, red on red & green on green are rally points. Dissimilar color contacts signify a decline pic.twitter.com/1qJEnbxKfD

If market takes out recent bottoms by signifiant amount, we could have waterfall finish? Lotsa blood & panic on the street when that happens
If step 2 bottom is completed, these are possible rally stopping levels. pic.twitter.com/3BEep4Nkvh

Chart indicates another step down before the fun is over. If step 2 is finished a bigger rally than 1 will take place pic.twitter.com/ZGuvCZB21G


If it’s a 3 count decline, we could have several bottoms before a real rally takes off recovering 62% of the decline. pic.twitter.com/LGZ1A1BGYv

Fibonacci fan from peak of 9/19/14. This chart could be a 5 count decline with more to go. But let’s say it’s a 3 pic.twitter.com/0fKwvQklcN

Interesting, but crude cycle chart. If correct, the pain might not last too long before a large rally begins. pic.twitter.com/SCk0uXfQN1

Also keep in mind that I’m a rambling’ senile old man that can barely put a thought together in a coherent sentence. Just a stupid old fart
I gotta stop, cuz I’m starting to sound like perpetual bear Robert Prechter These charts are just theoretical possibilities not fact – yet!
Now let’s look at a chart from 1928 to present. I have to stop this or I’ll have a heart attack pic.twitter.com/bG0iR2t038

That was a pretty scary chart from 2009 to present! Now lets look at an even scarier chart!! I’ll never sleep again! pic.twitter.com/CRLIPCgJkN

Oct is Halloween month & let’s look at somethin’ scary. If count is correct on this chart, it’s means trouble ahead pic.twitter.com/07lJkmgzDc

I certainly like the idea of a rally occurring on the heels of Dow Theory sell signal from 10/13/14. In 2007 the rally was 62% of decline.
All the reasons that I used for a rally yesterday worked out for today’s rally. Accidents do happen and I can get things right occasionally
Lotsa bears out there. 54 calls bought for every 100 puts bought today. pic.twitter.com/He3l7u8c02

Waterfall declines can easily occur in this climate. If we have a big washout the chances of the decline being finished are good. BUT . . .
#Tickersense is showing a ton this morning. If I see a bunch of shorting on this bounce, I’m going to turn very #Bullish. – Mark Young
The uptrend for #Russell 50 is not broken yet. Big caps are late to the party. pic.twitter.com/ydy6oXZNoN

Sequoia fund is on or near a buy point. Sequoia is closed, I recommend it about 2 weeks before the fund closed pic.twitter.com/Fnh80pnRiI

Cook’s tick indicator says we have entered an area of a possible rally. This index can go deeper before rally occurs pic.twitter.com/YEbcW1ScJK

#Investors are fearful enough to move more money into money market funds, but bear market funds are not in vogue yet. pic.twitter.com/lGpAeD4DGx

The #ADX indicator has crossed into extreme territory. Buy signal isnt generated until the red & green lines reverse pic.twitter.com/W35vN7tZzT

The #SP500 has penetrated the lower edge of its envelope. This is the deepest penetration since Aug 2011. pic.twitter.com/lORnZYi6Dz

These longer term #oscillators are at the same level as Nov 2012. pic.twitter.com/BPD9RV9bSn

Summation index has hit minus 500 & that’s an area of a possible rally. Remember it’s an imprecise target for a rally pic.twitter.com/XL9fZcQeJq

More internal signs that the decline is slowing. pic.twitter.com/gB4Fg29UWO

Is that green I see on the chart for the last week? Maybe it’s showing a “possible” rally. Size of the rally??? pic.twitter.com/Rin43eCcoI

After 2007 #DowTheory sell, market rallied & regained 62% of the short term decline. If rallied similarly today, expect rally to 16,914 ???
#DowTheory sell signal in Nov 2007. Chart is similar to present. Immediately after #Dow sell signal market rallied. pic.twitter.com/16OFbxOIFu

#DowTheory Sell Signal, but of what magnitude? Jeff Saut says 10-12% decline & no more, based on rising earnings (??) pic.twitter.com/9F5OsxUwXV

Raymond James’ research of 1025 stocks says that average stock was down 19% from its 52-week high with many stocks down a lot more than that
#Russell 1000 #index making contact on Aug 2011 bottom (significant bottom). Other times it just gets close to edge pic.twitter.com/yRBPuB5PuE

#Russell 1000 #index nearing a contact with envelope. This #index doesn’t make contact except on a significant bottom pic.twitter.com/JkkiVsOCKx

Past #Russell #midcap #index contacts with envelope. Contacts were 2011 & 2012. A contact doesn’t happen very often pic.twitter.com/v8SF0pIYK6

#Russell #midcap #index in contact with lower envelope. pic.twitter.com/67kyQgBS2x

Past envelope contacts of #Russell #smallcap #index. Volatile penetrations of envelope “can” denote a final bottom. pic.twitter.com/W8iQhr4olQ

#Russell #smallcap #index touching the lower edge of envelope. pic.twitter.com/t7TPlobcWV

Past example of #Russell #microcap #index touching lower edge of envelope. pic.twitter.com/TF9Q0JZx6D

Example of contact #Russell #microcap #index with lower envelope. Contacts don’t denote final bottoms, just a bottom pic.twitter.com/qwxpzZ1wNl

#NYSE recent example of lower envelope contact. Notice that it doesn’t stay long below the lower edge before rallying pic.twitter.com/1lY18qwKTo

#NYSE stock index is on the lower edge of its envelope. #Rallies begin on or near the lower edges. See next tweet. pic.twitter.com/XPpOBCPBay

A #pitchfork on the #Russell small caps (#RUT) that looks valid at the moment. pic.twitter.com/o9khTYyE9y

NASDAQ #fibonacci fan that is also working well since 9/19 pic.twitter.com/ADt5tXbr4M

#fibonacci fan that is working well for the entire decline since 9/19/14 to date. pic.twitter.com/IhHHZvz6Z4

I wonder when they will panic and announce the next round of QE. – from Mike Burke
It was an explicit admission that, among QE objectives, were manipulation of the equity and forex markets. – from Mike Burke
The Fed governor replied that QE had been successful because the dollar was down & the stock market up. This statement was revealing because

Everyone on TV saying they are “buying this dip” but no one asks if they raised cash in advance. Can’t buy a dip unless you sold some.
Watch Mon & Tue for panic & reversal signs. The larger decline will spend much more time on downside, but market zig zags B4 the big bottom
Is a panic waterfall decline ahead for the market? Could a panic be like a 800 point day? Panics usually occur nearer the end than beginning
Nearing the 200 day moving average. Coincidentally at the same time the lower edge of the envelope is approached. pic.twitter.com/xctEEZRznr


Nearing lower edge of envelope for SP500. Historically a penetration of lower envelope generates a rally. pic.twitter.com/EKPXbfnQTJ

Head & shoulders formation broken in German Dax index. pic.twitter.com/l0gWLLhVmM

Head & shoulders formation broken in Russell small cap index. Maybe a move lower & return to neckline in a rally. pic.twitter.com/DYx30Mczdn

@Stock_Trend_Chg Oil target may be as low as $50 based on wider interpretation of converging symmetrical triangle. Takes time to accomplish
No news on Fri except import prices & 4 FED speakers. Futures are down and almost making a new low. Pivotal moment here, go lower or rally?
Check out PAGE 5 CHART 4 – – ENERGY – – ADV DEC + UP DN VOL + HIGH – LOW + BULLISH % At link stockcharts.com/public/1169350… So ugly may bounce
Oil broke to the downside with an eventual target of $65. Sounds great as long as deflation isn’t part of this chart. pic.twitter.com/Kj1Fc2M2zI

$ are moving into money market funds but little interest in bear funds. These will be at peaks near the price bottom pic.twitter.com/arzraag8DT

Junk bonds are canary in the coal mine with the economy. Economy is great & getting better??? Other than QE ending, anything else in play???
Junk sentiment turned down in Jan & TLT (T-bonds) have outperformed junk bonds since then pic.twitter.com/rXqDCAc1aW

The Yen is telling the Nikkei where to go. The Yen is inverted in this chart to match market direction. pic.twitter.com/ARwWoXKZP4

Volatility is still leading prices to the downside. After we get a rally we’ll see what volatility will tell us. pic.twitter.com/yXf71KH0jV

Perhaps this is the best picture of the wave count. We’ll see later if it’s true. pic.twitter.com/UxYjNFRaCu

Tiny penetration of Russell small cap (RUT) head & shoulders. Need larger break down to be sure. pic.twitter.com/qVkZk68XYW

IGNORE EARLIER TWEET ON WAVE COUNT. I POSTED THAT BEFORE LOOKING AT ALL MY CHARTS. Senile old farts are allowed to make mistakes! Right?
Over 90% declining issues, but declining volume was about 81%. Not a 90% day but bad enough to “possibly” warrant a day or so of rally
And ditto on this chart PAGE 1 CHART 9 – – STOCKS ABOVE 20 DAY MOVING AVERAGE
While this chart is showing resistance PAGE 1 CHART 8 – – PERCENTAGE ABOVE 50 DAY MOVING AVERAGE On following linkstockcharts.com/public/1169350
Check out this chart PAGE 1 CHART 7 – – PERCENTAGE ABOVE 200 DAY MOVING AVERAGE On the following link stockcharts.com/public/1169350
Dow Theory chart. The early August low is what we are watching closely. pic.twitter.com/Si5JSsZuFA

Dow Theory has more to do before a signal of consequence takes place. The Transports are near Aug lows, but Industrials have further to go
NYSE high low are taking a breather for the moment, no follow through today on the lows. pic.twitter.com/IvyaWu5jJw

Advance decline line is still leading prices downward. A/D line is below early Aug A/D bottom pic.twitter.com/pQRuMeJTHi

Yesterday was the best day of the year & today was the worst day of the year. Déjà vu all over again cuz this happened in last bad market
The decline in SP 500 futures since Oct 6th to today. Can you see the wave count mentioned in the prior tweet? pic.twitter.com/RQzkDfyyO0

This small part of the overall decline began on Oct 6. A nice channel break after 3 steps down (one of the steps sub divided into another 3)
We’ll see if Mr Market wants to do damage quickly or slow & deliberate. Both usually have a waterfall ending, which can be fun for shorts
Microcap & small caps made new lows today, but large caps fell short of new lows. If Lg caps make significant new lows expect lotsa damage
Looks like 4 steps down completed and we’re probably declining presently into 5th step down for today’s decline. pic.twitter.com/Rjl7tFhMZ1

A “possible” cyclic low is forecast for the first quarter of 2015. I’ll run Hurst Cycle software to see what major bottoms it’s predicting
BUT, market “could” muddle around a series of insignificant lower lows. I wouldn’t expect that to be take place. (More)
If market takes out recent lows, it means another leg down is underway & it would be step 2 of 3 steps. If true, more damage is “possible”.
SOME indexes made moderate channel breaks of the recent decline, but MOST didn’t have a channel trend break. (Continued)
Looks like 3 small steps down this morning. Should have a rally from here. That’s not assured until channel break. pic.twitter.com/pKokTviRwe

Go Chargers! 31 – 0 winners today against the Jets Chargers finally have great coaching, a great general manager & it’s beginning to show
@wekim77 If a complex formation ends the market decline that began in 2013, it will take lots of time to develop. Patience advised long term
@wekim77 Yes on end step 1, but smaller cap indexes show 3 stabs downward for a WEIRD finish?? OR there’s more to go for a complex finish
@Stock_Trend_Chg An uncompleted head and shoulders turns into a consolidation pattern, instead of a negative breakdown in prices.
Russell small cap (RUT) came close to completing its head & shoulder top. Projected low would be June 2013 bottom pic.twitter.com/0gpjXSGdhf

If the larger steps down are valid, we could have another decline before we attempt new highs. That decline would not begin for awhile.
Some of the indexes look like we have only completed 2 larger steps down. Larger step 1 down began in March 2014
Beginning on Sept 19th, the decline appears to be over. A subdivision into steps 4 & 5 could mess up this forecast. No sign of 4 & 5 yet.
Looks like one continuous step down in the broker dealer index. Similar look in bank index pic.twitter.com/4sbBOBLnP0

3 nice steps down in the semiconductor index pic.twitter.com/eUW8bF1T8Q

3 well defined steps down for SP 500 & DJIA, expect more rally to come pic.twitter.com/Y86IZUHoPK

Another nice pitchfork for Russell small cap index ($RUT) pic.twitter.com/IgYGfxL03m

Really well defined pitchfork in automobiles pic.twitter.com/op3IlirNyk

Mike Burke says: Seasonality turns positive next week May see another low early next week, but, if lows decline a bottom will be in place
This is an interesting relationship, palladium divided by gold. Why it works takes a little research. Think about it pic.twitter.com/8IYtvG74Mc

Yen started rising and Tokyo Nikkei fell out of bed, 2.6% yesterday and .5% tonight.
Since June 2013′ London has formed a pattern of higher lows. Today it broke below an important low. Significant!!! pic.twitter.com/620sviRV7s

I show all of these charts of small & mid-cap indexes that have weak prices & weak internals. While the large cap indexes refuse to follow.
Investors aren’t rushing into bear funds or money market funds. Both of these rise during a decline, but not yet. pic.twitter.com/KJ6fXxFGQO

SP 500 is touching its 100 day moving average. This MA has contained all declines since late 2012. pic.twitter.com/lntu7b9Ije

McClellan summation index & it’s oscillator. Surprisingly oscillator is not at an extreme level like the end of July pic.twitter.com/s2Mz5WHQp4

Up down volume for small caps looks precipitous pic.twitter.com/h2hbE9W9fH


Percentage of stocks below the 200 day moving average is getting low. This chart is the small and mid-cap indexes pic.twitter.com/VZu80tGzKy

Showing larger wave count to downside. Haven’t gotten to the other charts yet, may be more goodies later. pic.twitter.com/cJOrpGyAi5

ISEE call put ratio was 48. For 100 puts bought, 48 calls were bought. Year’s low was on 8/1 & the ratio was 43. Bearish attitudes are high
Market is oversold and staying oversold. That is the direct opposite of what had happened on the way up, overbought and stayed overbought.
Still in larger step 2 down. This chart gave a warning yesterday of more problems ahead. pic.twitter.com/Hex29riZWA

Sep 2014 – 278 TWEETS
That’s all my charts and comments for now. youtube.com/watch?v=gBzJGc…
Long term declining #trendline for Tokyo. pic.twitter.com/7O4IBKMcew

Chart of London #FTSE since 1998 with an upward wedge beginning in 2008 to the present. pic.twitter.com/zzUbhSdCaH

Value Line index since 1980 showing triple top, current pitchfork, and descending line for bottoms. pic.twitter.com/dRYRu8YD1U

Long term chart of #SP500 since 1980 with the wave count from 1982 to 2000. Large steps green III, IV & V are labeled pic.twitter.com/vzuEMPyzRH

Either a long consolidation pattern, or the epitome of a sawtooth top. pic.twitter.com/VpMr117Khk

#Russell2000 (#RUT) has a possible #headandshoulders formation with the neckline a little below present prices. pic.twitter.com/8MYrlyjbJp

#SP500 on bottom line of pitchfork. Breaking of this line “could” denote end of step 3 since Oct 2011 ??? pic.twitter.com/ngymzayzgw

Internals on utilities sector is not as weak as prices indicate. Strength ahead for utilities??? pic.twitter.com/dRB1eY3qcF

Internals on materials sector is much weaker than the price indicates. More weakness to come in materials??? pic.twitter.com/C2TKE7DEYS

But some investors are moving into money market funds showing a little fear. pic.twitter.com/6pJqdTOCM6

Chart shows what investors are doing with their money. They are still #Bullish and refuse to move to #Bears funds pic.twitter.com/XGaS6Gatme

GE is still leading the way down amongst the blue chips. pic.twitter.com/618pNTVZxB

Small caps are still leading the way down. I would expect this trend to reverse when we have a good bottom. pic.twitter.com/kwMV1qiWQh

New low without a new low in prices. Negative Divergence. pic.twitter.com/mFMaDYGwSb

#Stocks keep going below 200 day MA while having a tepid #rally. #Chart is percentages of stocks below MA in an index pic.twitter.com/Gv1N3EBJXH

High low difference got better today instead of following advance decline line down. My Charts stockcharts.com/public/1169350pic.twitter.com/2PLltWr7Nc

New lows in adv dec line today without price low in large caps. A negative divergence between adv dec line & prices pic.twitter.com/pVckTtddpG

“Futures on U.S. and Asian stock indexes fell after a slump in oil prices and the worst quarterly drop for global equities since 2012”

It is important to remember that all market cycles have two halves. streettalklive.com/index.php/blog… pic.twitter.com/kYptY0ftcn

We’re now exactly 1 month away from the Oct Fed meeting & end of QE3. Most saying it’s diff this time (from QE1/2)… pic.twitter.com/ckYbgWVFDs

My favorite reach for yield indicator under more pressure after Gross announcement, still much more to go IMO. $PHK pic.twitter.com/JUaXliJwG6

Absolutely stunning reversal in Brazil this month. 20% peak to trough decline. $EWZ pic.twitter.com/ojytf2ZDaf


We had a lower low in small & mid-cap indexes today. Could be showing we haven’t finished current & larger step down pic.twitter.com/VDOO89V56L

Be Aware and Be Cautious – until you know otherwise.
But if we break the decline’s lows, you’ll know step 3 down is underway (scenario 2). It could be a waterfall event. pic.twitter.com/eFvRseeVIe

We haven’t made new low since 9/25 (Thu). The rallies have been muted, but until step 3 up is finished, we are in rally mode. (continued)
2 scenarios likely. 1. We rally up to old highs 2. We have completed ONLY 2 steps down and will decline into 3rd step (continued)
Hmmmmm, I have this decline counted as 3 steps down (double bottom 3rd). No new lows since 9/25 (Thu). (continued) pic.twitter.com/veV5YGko8H

#history always repeats, only the details change – #EdsonGould Many Edson Gould’s #Anametrics #FindingsandForecasts articles are on my blog
NOT A GOOD TIME, BUT I MAY BE BUSY WITH OTHER THINGS FOR A COUPLE OF WEEKS I’ll try to tweet important stuff after each day’s market close
“it is worth mentioning that a stronger dollar is an effective tightening of monetary policy.” – Jeff Saut
Headline: “U.S. Stocks Drop Amid Hong Kong Protests”. Why would the #stockmarket decline because of Hong Kong. Bad reasoning for headline.
Look at difference between the wave count on SP500 futures (here) versus SP500 chart (actual index) in prior tweet. pic.twitter.com/rLwoPMP1oY

SP500 chart shows 4 steps down. The 4th step could be a double bottom. Failure on upside means 5th step coming. pic.twitter.com/20Y3dNP2Hd

“Might” be the end of step 3 down since 9/19. Higher highs needed for confirmation of step 3 ending. 5 down or worse? pic.twitter.com/53OpV0HetX

Since 9/19, large caps have 3 steps down & the small caps are missing a step. That means maybe one more step down of differing consequences
The history of the crash of 1929. The years leading up to 1929 and the stock market’s influence on the country youtube.com/watch?v=_YgzVt…
FED paper called “A Brief History of the 1987 Stock Market Crash with a Discussion of the Federal Reserve Response” wp.me/a1DRwF-32f
The two video clips posted of stock market crashes has NOTHING to do with the present I posted them because I like stock market history
Crash of 1987, news clips throughout the trading day of the largest percentage drop in the stock market since 1914. youtube.com/watch?v=UO-mD9…
Charts & audio from the pits for the Flash Crash of May 6 2010 Fun to listen to the emotional breakdown of narrator youtube.com/watch?v=njwf1F…
During QE3: US National Debt: $16 to $17.7 trill. Fed Balance Sheet: $2.8 to $4.5 trill. Both up $1.7 trill. pic.twitter.com/5bgwDnUpXm

Senator Elizabeth Warren called for congressional hearings into allegations that the FED has been too deferential to the firms it regulates.
9/27/14 – Mike Burke Seasonally there is often a bottom after the 1st week of October.
9/27/14 – Mike Burke New lows are all that matters When a bottom has been reached, new lows will diminish quickly No sign of that now.
9/27/14 – Mike Burke For the past 40 years average returns for the coming week have been negative by all measures.
Short sellers have a 12 million share position in Alibaba, a week after the company priced the world’s biggest-ever initial public offering.
Put in $25, Get $10,000 Back. Your Bank Becomes a Casino US banks of all sizes could start tempting savers with savings promotion raffles
Goldman Sachs is changing a policy addressing conflicts of interest to bar investment bankers from trading individual stocks and bonds.
Trend channel break will indicate that step 3 in larger step 3 (began in Oct 2011) is finished. Significant correction will then take place.
An alternate wave count for larger step 3. If true, this count indicates a return to old highs would take place. ???? pic.twitter.com/QQoetTSUmH

A long term wave count since 2009. The only question is whether larger step 3 is finished. pic.twitter.com/HfWTTlcN2F

Fibonacci lines in effect presently for the SP500 and a wave count pic.twitter.com/rMzkgfOkt2

Russell micro cap decline since July 1. Apparently finished step 2 down, it’s not conclusive with a trend break yet pic.twitter.com/uxUqslEtq9

That should conclude the decline that begin on Sept 19. Rally now to new highs? That’s the big question??? More later pic.twitter.com/fVQRi1vFik

Collusion between the FED & Wall St in “The Secret Goldman Sachs Tapes” Article bloombergview.com/articles/2014-… Audiothisamericanlife.org/radio-archives…


.@TheCreditBubble has requested this cartoon from the Summer of 1987 pic.twitter.com/OhrdZVcXuq

No fear without a rise in assets of the bear funds or a rise in assets in money market funds. Both rise in bad times. pic.twitter.com/iVp0AMTD3B

The wave count since July Read about my wave count method at stock-market-observations.com/2011/07/02/odd… pic.twitter.com/zvp10ezq0w

If this cycle stays in gear, we should rally soon. The predicted low date is tomorrow, but it’s not unusual 2 B early pic.twitter.com/4iz4ZfXdPl

90% of total volume was declining today Declining stocks were 83% of the total traded Should bounce after an extreme day, if not, watch out


Mark Twain and his stock market advice of when to buy pic.twitter.com/UoTE5JZiTR


The short term wave count & did we finish step 2? It’s possible. Notice the Fibonacci lines are providing resistance pic.twitter.com/LQpZBz5T7W

Jeff Saut has support at 1965 – 1970 for the SP 500. We bounced off that level today.
Was the decline ending in Aug step 1 down? Smaller caps show it was step 1 down. We started step 2 down Fri 9/19/14 pic.twitter.com/sgMwMUZFaM

The first step was Fri to Tue & we are in second step down of 3 steps. My method of wave counting can be read here: stock-market-observations.com/2011/07/02/odd…
Surprise, I woke up & saw the market had crashed, I hadn’t been stopped out, but was making money again. Lucky trade on a chancy wave count
Yesterday I counted a poor looking 5 steps up, so I went short again after the close with a stop above the high. My expectations were low.
60 minute envelope in a bottom area early this morn. Rallies usually take place when the index hits bottom envelope pic.twitter.com/8iJOthzhgi

SP 500 futures have recovered 38% of the decline, while the NASDAQ futures have recovered 61% of the decline. Lotsa strength in the NASDAQ.
Triangle formation in oil has been forming since 2011. Downside projection could be $65. That smacks of deflation pic.twitter.com/dg3aLTmEFo


Looking at the percentages, small caps are doing better than the larger caps pic.twitter.com/wxW5e67jZF

We’re obviously breaking the downtrend that began last Friday. If we don’t make new highs, this decline becomes step 1 down (of 3 or 5).
@focus1234567 Yeah I’m going to bed now & reading my Kindle until I fall asleep. I have a wrist lanyard to keep it from falling on the floor
@focus1234567 I’ve been tending in that direction for a couple of years. Jeff Saut says this bull market has years to run.
@focus1234567 makes a man healthy wealthy and wise. You’re getting up and I haven’t gone to bed yet.
@focus1234567 You ever sleep? Don’t say 2008, it scared the crap out of me the 1st time. But someday large 3rd step down will take place!
50 day moving average of the SP 500 is only about 5 points lower. Doesn’t mean much though.
$65 oil in a couple of years??? I’ll post the chart tomorrow that shows the possibility.
Shorter & longer term oscillators oversold. Only if in a serious decline would I expect the oscillators to go lower, otherwise rally soon.
ES futures look like 4 (of 5) steps, but a trend break is the deciding factor whether the complete step is finished pic.twitter.com/PA6u6wMWOf

Large caps have no steps down & if an intermediate term decline has begun, 3 steps down are coming. This matches the prior chart’s count.
The count in this chart shows 3 more steps down. 3 more steps down puts large caps in gear with this chart. (cont.) pic.twitter.com/kGXEU9OraQ


One of these days, the uptrend is going to end and stocks will slice right through oversold readings. Until then, the trend is your friend.
@focus1234567 I’m watching a small time frame decline (Fri to Tue), which could morph into a larger decline. If true, this is step 1 down.
NASDAQ has rallied off of their lows, while DJIA and SP 500 are on their lows of the day.
Market is breaking down and sub stepping into more steps down. I’ll update the count later in the day.
The indicator in the lower window indicates a rally should be expected. pic.twitter.com/5MWhz3I5GE

The NASDAQ Composite is one of the stronger indexes after hitting its 3 count. pic.twitter.com/Yc7yNHAcfd

The DJ Ind may have just finished their 3 count. We’ll see. pic.twitter.com/HNBOdZWkEw

The 3 count as I see it presently in the SP futures. These are 12 minute bars. pic.twitter.com/FASrwh9hAX

Market weakening and we may be sub stepping into 5 steps down instead of 3. Won’t know for sure until we make a lower low.
We don’t have an end to the recent decline until we break the trend line for this decline. This hasn’t taken place yet.
I count 3 steps down in the futures. If “true”, a rally should take place. If we are in a larger decline, this marks the end of step 1 down.
Lots of trend lines on pages 6 and 7 stockcharts.com/public/1169350
First 2.5 pages of my charts have the best indicators. Lesser indicators follow, not bad or unreliable, just lesser. stockcharts.com/public/1169350
Read about the Elder Impulse System, which is used on my index charts.stock-market-observations.com/2012/01/30/eld…
Page 6 of my charts are daily & 2 hour. Page 7 is monthly & weekly charts. All are displayed in Elder Impulse System stockcharts.com/public/1169350
My charts are shorter & if you’re only interested in indicators, see the first 5 pages. For charts, see pages 6 & 7. stockcharts.com/public/1169350
Gann said that markets tend to top on or around Sep 22nd more often than any other day. This is also the date of the Autumnal Equinox
SP 500 trend line since Mar 2009 bottom. This is not a log chart. pic.twitter.com/Z1z3FPUGvR

Jeff Saut says “I think Dow Theory “trumps” everything because it tells us the primary direction of the equity markets,”
@spirocks If you have a multiple personality disorder, you can lie to both of us
@Stock_Trend_Chg Decent record getting MAJOR inflection points correct
All of the charts displayed today can be seen at My Charts linkstockcharts.com/public/1169350 I have also reduced the number of charts
Trend lines and cycles for Value Line Index since 1980 pic.twitter.com/JX9BIlN4VO

SP 500 trend lines, cycles and wave counts since 1980. pic.twitter.com/7QTgJVMht2

Possible trend lines for Russell micro cap index pic.twitter.com/cARWjtqiT9


Russell top 50 trend lines Index is the 50 largest cap stocks pic.twitter.com/dKPk7MpmKA

Russell 1000 trend lines Index is the largest 1000 stocks pic.twitter.com/VJrVySpcII


Russell micro cap Pitchfork trend lines to the downside pic.twitter.com/KRxCqO7ZIS

Semiconductor index Pitchfork trend lines pic.twitter.com/hSdHoNMJIp

The weekly unemployment claims continues to strengthen. The job claims is inverted from its normal downward trend. pic.twitter.com/WTtczpm7CH


Smaller caps went from leaders in July to extreme laggards. Smaller caps are ready to go negative for last 4 months pic.twitter.com/2wdtWR7cc0

Russell index weakness is spreading from the micro caps to the larger caps pic.twitter.com/UGiKM2HfUe

Emerging market stocks are warning of impending weakness pic.twitter.com/GzjMsfOAOZ

Volatility warnings of an impending market decline. The most recent warning was last week. pic.twitter.com/Te1Td0yuV5

This chart says we are in 2nd step down. See this link for an explanation of my wave counts stock-market-observations.com/2011/07/02/odd…pic.twitter.com/nX5yNbZLjw

Percentage of today’s declining volume and declining stocks was about 85% each. 90% represents an extreme figure.
Longer term overbought oversold oscillators are nearing an oversold reading. pic.twitter.com/couNsIDF98

Lotsa weakness in the NYSE stocks above their 20 day MA. The decline just began, but this is closer to recent bottoms pic.twitter.com/AdROQipslE

Finally weakness is showing in the SP 500 average price relative to its 52 week high low pic.twitter.com/oZoRY0nWH9

Also weakness in the SP 500 for stocks above their 50 day MA. pic.twitter.com/EPev2bcFkI

On the recent peak, the SP 500 was showing signs of weakening for stocks above their 200 day MA pic.twitter.com/NXDkkG9G1G

Stocks above 200 day MA on NASDAQ are growing weaker. Ditto for ALL small cap indexes showing 200 day MA weakness pic.twitter.com/cHFl082AXm

The put call ratio isn’t in sell territory. Is it infallible, no, but it has a decent record of getting calls right. pic.twitter.com/zi4SxLXkv9

NASDAQ high low ratio has been in a correction mode for the last 2.5 weeks also. pic.twitter.com/TyUfL17awA

NYSE high low ratio has been in a correction mode for the last 2.5 weeks. pic.twitter.com/veJ5DHZaip

Cumulative advance decline is now leading the market lower. pic.twitter.com/Vom5uM9fTB

Was last week’s breakout a bull trap?? We’ll find out if we break significant lows. If not a trap, we’ll see more upside before a reversal.
Alibaba’s PE ratio is 60 (at $90). Google PE is 31, Amazon PE is 504, Netflix PE is 165. Is Alibaba in the same class as these stocks???
Alibaba IPO price was $68, reached $97 opening day & now trades at $90. Julian Robertson loves Alibaba. Remember when Google IPO was $85????
Breaking the trend since Oct 2011 is the big Kahuna, after that, a significant market correction can take place. When does that happen???
@taxfreelt Hard to tell, large caps are stubborn, small caps are already in decline. When we break trend since Oct 2011 the rout will be on
Not a good day today. The DJIA is down about half of the decline in the SPX. Smaller the cap, the bigger the decline pic.twitter.com/NkIGoZKABO

Do my charts mean the market is going to decline immediately? No, but . . . And markets usually go much higher than thought possible
Is Emerging Market Currency leading the stock market to the downside??? pic.twitter.com/oai0wmzQ3V


Weekly unemployment claims (inverse chart) are moving lower as economy strengthens. QE ends soon & what happens then? pic.twitter.com/YISi3hNYk3

Japanese Yen and the US bond market are almost in lock step. pic.twitter.com/C51vyqm1x5

McClellan Summation Index has been falling while large cap indexes are making new highs. pic.twitter.com/jDlNc9IsM9

New highs in the large cap indexes, but stocks above their 20 day MA were falling instead of confirming indexes pic.twitter.com/BfLvWTDzdb

Bearish divergent action between cumulative advance decline & large cap indexes, AD line failed to confirm new highs pic.twitter.com/EPMaMjqAFi

Breadth indicators very negative, seasonality for the next 2 weeks is negative. Conditions are in place for a cycle top. – From Mike Burke
Hindenburg Omen occurred on Thu & Fri. Signal not been valid in recent years, but conditions are similar to previous significant declines
The SKEW index has been in an uptrend since late 2013. As the index goes up, the odds of a correction go up too. pic.twitter.com/dy2gfS5UQc

Since Nov 2012 SP 500 has had corrections of -8%, -6%, -4% and -4.5%
My Charts can be seen at: stockcharts.com/public/1169350
My Charts are showing that small & midcap stocks are performing poorly Seasonality suggests that they may outperform in Nov & Dec???

Greed and Fear of Markets The excitement over the Alibaba IPO is in direct, opposite proportion to the fear after Lehman’s failure
Russell 1000 (top 1000 stocks) New intraday high with a loss and an outside day – both potential reversal formations pic.twitter.com/zYi0r4Lv92

Today I’m seeing an outside day on many stock market indexes. Some indexes had new intraday highs signifying – reversal day. Double Whammy!!
NO wins in Scotland and that’s carrying over to Wall Street tonight.
Patience is good in the stock market, but some never learn to wait for the right moment. pic.twitter.com/TIM0mlyqbe

In 2008 stocks were a good buy . . . Goodbye Mercedes, goodbye yacht, goodbye vacation home, goodbye . . . Ed Hart (modified for today)
Market Correction – The day after you buy stocks. – Anonymous
Money talks, but all mine ever says is “goodbye” – Anonymous
Those who can . . . do Those who can’t . . . teach Those who can’t teach . . . work for the government. – Anonymous
P/E ratio – The percentage of investors wetting their pants as the market keeps crashing. – Anonymous
Often times WHEN you take a position can be more important than WHAT you take a position in. – Anonymous
The public is right during the trends but wrong at both ends. – Humphrey Neill
Nobody is more bearish than a sold-out bull. – Anonymous
A buy and hold strategy is a short term trade that went wrong. – Anonymous
A bubble is a bull market in which you don’t have a position. – Anonymous
The hardest part of a bull market is staying on. – Anonymous
This is expiration week for Thursday & Friday. We don’t get the crazy volatility like in the old days, but some volatility is expected.
Market is oversold & should rally more, but SP500 is finding it difficult to rally at the moment. pic.twitter.com/en0doAFVWX

4 day Fibonacci fan is working very nicely showing resistance and support on the SP 500 futures pic.twitter.com/GXYfJDv09Z

Close up view of the John Murphy chart immediately below. pic.twitter.com/NL1siwkqtK

John Murphy Favorite for long term signal Above the zero line is a bull market, below the zero line is a bear market pic.twitter.com/GL3NN0PZWT

Stochastic buy/sell signals for the Russell 2000, ETF is IWM pic.twitter.com/TRYgep49pp

Total market cumulative advance minus declines versus the SP 500. Negative divergence taking place presently pic.twitter.com/44yxufeNMC

Putt / Call Ratio showing moving average extremes for a buy or sell point. pic.twitter.com/4BTnl5nzb8

All of the preceding charts seen here are available at the following link:stockcharts.com/public/1169350
Stocks making a 52 week high in S&P 1500 are in a bearish divergence with index prices, slow topping indication pic.twitter.com/cUife90OTT

Stocks making a 52 week high in S&P small cap index are in a bearish divergence with prices, slow topping indication pic.twitter.com/4jbaL1kcjC

Another chart showing loss of upward momentum in the number of stocks above their 200 day MA in the SP 600 index pic.twitter.com/vbGCVWOJB8

Showing loss of upward momentum in the number of stocks above their 200 day MA on the NASDAQ, slow topping indication pic.twitter.com/RSCXZpBtcJ

My Stock Charts stockcharts.com/public/1169350
Follow my blog – Find some different ideas, papers written by Edson Gould, Terry Laundry, unique wave count theory stock-market-observations.com
Paul Desmond wrote an article on market bottoms, which won the Market Technicians (MTA) Dow Award in 2001. mta.org/eweb/docs/2002…
Paul Desmond’s of Lowry Research lowryresearch.com wrote an article on market tops. stock-market-observations.com/2014/05/27/527…
If interested, you can read about the Elder Impulse System at the following link stock-market-observations.com/2012/01/30/eld…
Usually, the first warning sign that a Bull market is losing upward momentum occurs when the % of stocks rising to a 52-Week High contracts.
Tell your friends, neighbors, relatives, enemies, psychos and the homeless to become a FOLLOWER OF MY TWEETS.
Dow Theory Buy Signal – this is 2 days in a row for a buy signal. It’s not yet a significant new high for the industrials
Dow Theory Buy signal will occur today if the industrials & transports close somewhere near present price levels. It seems to be sure thing
The main purpose of the stock market is to make fools of as many people as possible. – Bernard Baruch
If all you have is a hammer, everything looks like a nail. – Bernard Baruch
I made money by selling too soon. – Bernard Baruch
Men, it has been said, think in herds; it will be seen that they go mad in herds, while they only recover their senses slowly, & one by one.
Emotions are your worst enemy in the stock market. – Don Hays
Stock are bought on expectations, not facts. – Gerald Loeb
If you have trouble imagining a 20% loss in the stock market, you shouldn’t be in stocks. – John (Jack) Bogle
The chart possibly shows 3 steps up. What appears to be 2 close steps is likely 1 step. Step 3 may still be ahead??? pic.twitter.com/JX7NHXEU9l

Yup, that’s me staying at the cardboard box suites behind the Four Seasons pic.twitter.com/gLbhKlDLos

“This time it’s different” was prevalent during the bubble of 2000. In 1929 it was called “New Economics”. – Bob
The four most dangerous words in investing are “This time it’s different”. – John Templeton
The rally today was due after completion of a 3 step decline. Rally may see new highs, but significant new highs??? pic.twitter.com/qm2mzhmapN

Today was unusual prior to a FED announcement. Normal is a flat market. If tomorrow morn. is STRONG to upside, expect more of same after FED
Today was a good bounce for large cap stocks. Smaller caps had half of the large cap gains. See – PAGE 5 CHART 7 stockcharts.com/public/1169350…
Dow Jones Industrials and a Fibonacci fan since the 2000 peak pic.twitter.com/tn7uDDEymG

Dow Jone Industrials since Oct 1928 and the overall wave count since 1929. pic.twitter.com/vdKcCzXTKf

Dow Jones Industrials since 1966 and the wave counts during that period. pic.twitter.com/OOlquAPSJ7

HIO junk bonds has been in a downtrend since Jan 2013 pic.twitter.com/8lzp5MmwcT

Junk bonds (JNK) since 2009 bottom, converging triangle since 2011. pic.twitter.com/pNHnUK9VYU

Trend lines, wave counts, Fibonacci lines for Russell 2000 since late 2009 pic.twitter.com/WEuB7zdiOb

Trend line channel since June 2012 in the SP 500 pic.twitter.com/LHxnfeunkt


Gold ETF & we’re looking for a “possible” break of the current trend channel, beware subdivisions extending the trend pic.twitter.com/kwk9iy5wkk

The count since Aug 8. FED announcements can make counts difficult to follow by wild swings in both directions. pic.twitter.com/9ap9f3rUQI

The Russell micro cap index has a downside trend line still intact. pic.twitter.com/KSeAqfTmlo

A “possible” new trend line? Will the top line hold over next few hours. FED announcement may shred this trend line pic.twitter.com/LslqjW0Lev

SHORT TERM CYCLE Recent cycle lows have occurred 1 day earlier than designated. Yesterday’s cycle low was 1 day early pic.twitter.com/byoQrssNcO

Same cycle as below in present. Cyclic lows have been shallow since 2009. Next cyclic low anticipated around May 2015 pic.twitter.com/tOFBx9gaCo

HISTORY: Crude intermediate term cycle of market action before 2007 peak & after the 2009 bottom. RELATIVELY accurate pic.twitter.com/vittPW3W0u

Rule#1: Never lose money. Rule #2: Never forget rule #1 – Warren Buffett
Buy on the cannons, sell on the trumpets. – Old French Proverb
The time of maximum pessimism is the best time to buy and the time of maximum optimism is the best time to sell. – John Templeton
The market prior to FED announcements consist of (1) FLAT TREND (2) Decisive & CONTINUING moves usually carry through after the announcement
The declining channel that existed since Sept 3rd has been broken on the upside. Fireworks begin for real at 2pm Wed. pic.twitter.com/cITxRHLsea

Cell phone only lanes in China Ever wonder if USA is falling behind technologically & isn’t innovative anymore?? LMAO pic.twitter.com/Mf0cOxbSPm

“The essence of investment management is the management of risks, not the management of returns.” – Benjamin Graham
Not good odds for this month. When the SP 500 was up more than 3% in August and at 12-month high, September was up only 8% of the time.
I know old traders, and I know bold traders, but I know no old and bold traders! – Anonymous as retold by Jeff Saut
Minor breakdown on these trend lines today pic.twitter.com/ReA76BcXTS

Very short term count for the SP 500 Several possible trend lines for the current decline (blue and green lines) pic.twitter.com/6WOV9Xn33N

Stocks fell as investors speculated FED may raise interest rates sooner than estimated cuz retail sales climbed at fastest pace in 4 months
The NASDAQ is not really in a down trend. This is a horizontal formation presently. pic.twitter.com/2fU4nUseNA

An early trend line possibility, we’ll see if it holds up for awhile. pic.twitter.com/FmE1pp5Nc5

Credit above tweet to John Murphy at StockCharts
Stocks favorable with strong $ $ – green area SPX / World Index – black line 1999 decline was from asian money crisis pic.twitter.com/BnFbZwkIei

Credit the above tweet to John Murphy
DOLLAR APPEARS TO BE FORMING MAJOR BOTTOM RISING DOLLAR IS BEARISH FOR COMMODITIES STRONGER DOLLAR FAVORS U.S. STOCKS pic.twitter.com/IQLaORwU1z


Is gold extending down into a 5 count, or making a double bottom? 5 count reinforces deflationary scenario in Europe pic.twitter.com/GaaU1ttObb

Russell micro cap index stopping a decline at the lower pitchfork level pic.twitter.com/ASzWWmtagw

SP 500 over the last month with a 5 count and a correction pic.twitter.com/GcopgmQOI2

NYSE index over the last month But many other indexes have gone to new highs well above the prior high. pic.twitter.com/4YoScLQvcg


Jeff Saut remains cautious & we’re in a secular bull market. His “but” is we could have a correction. He mentions things that bother me too
Shallow trend line in the micro cap Russell index pic.twitter.com/ysVDTwAeNb

Worst case scenario is that the megaphone could be ending soon. No clue which long term scenario is in place.
OIL BREAKS TO NEW LOWS AND TAKES GASOLINE WITH IT. More higher dollar repercussions.
“75% of American Adults are concerned about inflation.” – Rasmussen, August 24
“Eight-Year Loans Fuel Car Sales as Debt Warnings Ignored” “On a 96-month loan it takes 80-plus months before you are back in the money.”
“New-home prices [in China] fell last month. In Wenzhoa, 56% of the homes were abandoned due to falling values.” from Bloomberg, August 20
“We have more leverage and more derivatives risk than we’ve ever had.” from the Financial Times, August 20
Historical steps since 1928. Today we are in a very large megaphone formation. This formation “may” take years to end pic.twitter.com/Xl3pCM9MsE

A significant decline within the bull market channel could label the bull market since 2009 as a large step 1. Followed by steps 2 & 3.
A couple of years ago I became aware of a possibility of a significant decline and still continue the prevailing bull market. (continued)
Recent step history. It would take a large decline to break the channel for the 2009 bull market. (continued) pic.twitter.com/fHIGn62hPc

This looks like a bad news is really a good news event. Bad news means FED might not end QE.???? The step up since Oct 2011 is geriatric.
The count up since 8/7/14 “could” be as pictured. Without a channel break there’s no trend break or reversal pic.twitter.com/ldbKgrk91M

Action by the ECB to weaken Euro to combat deflation would push the dollar higher. This would push commodity prices even lower – John Murphy
Look at the plunging Euro. Euro zone has lotsa problems, wondering how their problems will affect USA (trade) ??? pic.twitter.com/2wBbWTfjGf

John Murphy was showing today how the rising dollar is lowering the price of commodities (including oil) pic.twitter.com/BgGA3at17F

“My Charts” – Indicator Explanation – Page 1 has been posted to my blog, use the link below wp.me/p1DRwF-30N
(Putin’s) . . . reminder that Russia is a major nuclear power. To me, it is pretty eerie our markets can ignore such rants. Says Jeff Saut
“My Charts” – Indicator Explanation – Page 1 wp.me/p1DRwF-30N
Aug 2014 – 81 TWEETS
“Don’t mess with Russia. We’re a powerful nuclear nation” – Putin Republican response is defense $. Given our problems makes it probably OK
I’ll publish the first page of My Charts definitions on Tuesday. Nobody is interested in the stock market this weekend.
I’m going to a do a blog update for the chart definitions one page at a time. This way I can take my time completing the definitions. YEAAA
I’m writing a blog that explains My Charts. What have I gotten myself into? This is going to take a lot of work & I don’t like work. Woe.
John Murphy says: EUROZONE STOCKS ALSO WEAKEN ON UKRAINE TENSIONS AND LOWER RUSSIAN STOCKS
John Murphy says: FALLING EUROZONE BOND YIELDS PULL HIGHER-YIELDING TREASURY YIELDS LOWER AS DEFLATION THREAT WORSENS (continued)
J. Murphy says: RISING DOLLAR & PLUNGING EURO REFLECT WEAKER ECONOMIC CONDITIONS IN EUROPE (continued)
Our “peace dividend” from the 90s is finished. The US’s fantastic & expensive Gee-Whiz weapons are now headed for development & deployment
Gold I thought the June bottom was good, but maybe not. We’ll see after the correction is done. Double bottom??? pic.twitter.com/87OW5yHVd1

Unsure which trend line is valid, yellow or purple? We’ll see. pic.twitter.com/NkSRNfkccR

Looking at this pic, which shows larger cap down to micro-cap. The smaller the cap the better its doing today. (???) pic.twitter.com/cspx088SEo

No newer high and no step up on this index (micro cap). Micros are sensitive to trends pic.twitter.com/xuO2l5orcq

Yesterday said: Wave counts completed with an alternate count showing another step upward??? Got another step upward. Correction now.
@Stock_Trend_Chg Lower lows determine if the count is finished or has one more rally left.
Have a merry Labor Day? Have a happy Labor Day? Have a lively Labor Day? Have a 3 sheets to the wind Labor Day? Have ’em all & stay safe
It will take several days to finish the chart explanations. I rearrange charts occasionally, so a chart you like may change its location
I’m preparing a blog update that will explain My Chart entries. Someone said they didn’t understand My Charts and suspect they aren’t alone
Wave counts completed with an alternate count showing another step upward??? Cycle shows a bottom sometime next week pic.twitter.com/O3hQXMA3vI
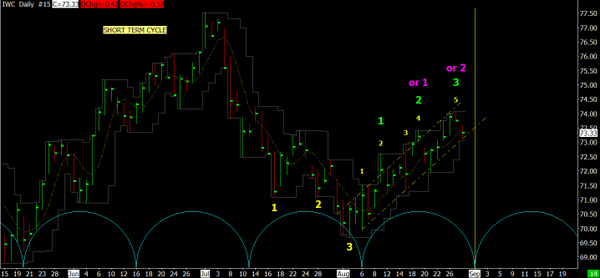
Needing a more descriptive name, I’ve changed my username to Stock_Trend_Chg. Followers should be unaffected & continue following new name.
Chart showing all of step 3 up. Remember that step 3 began with a fake-out low in Oct 2011. pic.twitter.com/lLxDFCHTMj


Jeff Saut sounds more bearish than tentative today. He doesn’t like the continuing failure of another Dow Theory Buy signal.
Putin knows we can’t outspend Russia into self-destructing this time (oil). Putin could possibly do that to us & that might be his end game
“U.S. official says 1,000 Russian troops enter Ukraine” Return to the Semi-Cold War days can’t be good for the deficit.
Dow Industrials and Transports have not made new closing highs. They are close to their July peaks. Many other indexes have made new highs
There are a LOT of people looking for a decline to occur soon. Those people (me too) are almost never right when they become the majority
Presently both the Dow Industrials and Transports are shy of their prior closing highs. In Dow Theory, only the closing numbers are counted
Interesting cycle timing chart. Simple but effective enough. pic.twitter.com/di0R3zJ3t0

If we don’t break through prior highs with a significant rally, Jeff Saut could become bearish. Right now, he is very tentative.
It wouldn’t be surprising to see a replay of the last significant rally. Another Dow Theory buy signal followed by a decline. (continued)
The 5-year to 30-year US yield curve is the flattest since the 2008 crisis, so the bond market is worried about something. says Jeff Saut
We should know if the alternate wave count was correct very soon, because a small decline has begun.
I’m not a Ron Paul supporter or a Libertarian, but I thought this article was interesting. …arketobservations.files.wordpress.com/2014/08/fergus…
“it will just temporarily deflate those bubbles that represent the greatest distortion of asset prices”
“QE never created viable growth, it just inflated asset prices. Likewise, the winding down of QE will not manifest growth,” (continued)
Plunging bond yields prior to 2007 were a mystery. Did they anticipate the 2007-2009 recession?? But global bond yields are plunging again
Here is an alternate count to the same SPX chart below. I’m watching the trend breaks for clues to which is correct pic.twitter.com/Mi2EZc0Z5M

No trend break and we’re in 4th step up in the SPX. New highs are being made on this late rally beginning on 8/7/14 pic.twitter.com/fjGyD7j9lv

In 3rd step up & watching for TREND BREAK with lower lows. Beware of possible 5 steps up. Trend break tells the tale pic.twitter.com/PcqZEqPdVQ

How much does a dollar buy in your state?? pic.twitter.com/R84c4FE6fc

The fan is still working on Thursday. @bobswavecounts
Smaller cap stock are underperforming large caps. Picture shows large, mid, small and micro cap indexes. Note % pic.twitter.com/zJF1SV4w3i

A short term Fibonacci fan that worked well today. This will possibly stop working during the night hours. pic.twitter.com/3cI8dDUosT

The downward blip passed & it was panicky investors reacting to the FED Minutes. We never had lower lows to make us think about selling
Watching for lower lows and lower highs. The count is off slightly for a peak but I never argue with lower prices. pic.twitter.com/cKm36KXLY9

Cycle bottom for May 2015. Cycle has worked onlyl since 2009. Bottoms on 2/2014, 11/2012, 8/2011, 5/2010, & 2/2009 pic.twitter.com/CJJz43dAsH

Fibonacci fan from 2000 peak to 2009 bottom. The 2nd highest line pegged the 2007 peak. Will it call the next peak?? pic.twitter.com/32R4qHD4fi

Another interesting chart. It begins in Oct 1928. The early dates are wrong and should be in the 1900s not 2000s pic.twitter.com/z7Sohibppd


Junk bonds bottomed on Aug 1 and have rallied nicely. pic.twitter.com/bROovj7f8c

Jeff Saut said: A decisive breakout above 1950 would suggest at least a test of the all-time highs and likely more.
You can see the 4th step beginning in the Russell micro cap index. This index is weaker than the NASDAQ Composite. pic.twitter.com/aiN9Z5qYmV

NASDAQ shows 3rd step up, while smaller cap Russell charts show the count as 4th step up. I would probably go with the count on the Russells
The NASDAQ is at new highs and that usually portends well for the market. Need to check the Russell Micro, Small & Mid cap for confirmation
In retrospect, I don’t have a clue where I got that “completed 3rd step”. It was actually a completed 2nd step. pic.twitter.com/62XCaaq9Zu

You can double click on any of the Twitter charts to enlarge them. You don’t need to be stuck looking at the tiny charts inside the tweet.
SKEW index going up again & adds to the prospects of another decline. SKEW doesn’t tell you when market will decline pic.twitter.com/Q7svEbCZgk

It looks like 3 completed steps up. This could be the beginning of 3rd step down, projected to end around Sept 1st pic.twitter.com/lfxoeLlv7A

SKEW is declining quickly indicating a reversal is likely taking place. Another buy point possible on Mon or Tue ???? pic.twitter.com/w85e6W4jt5

SPX retraced 50% of rally beginning in April. DJIA stopped on 200 day line. Outside bar today (one day reversal) pic.twitter.com/mLjuZyRHHr

Dow Jones Industrials shown stopping on 200 day moving average. Penetration should come on a later step. pic.twitter.com/W2P4D3Z54a

Showing the Mickey Mouse cycle chart again. It worked, what more can I say??? I first posted this chart on Aug 7th. pic.twitter.com/hDL88TNKrh

Rising wedge in the last step up is a big warning sign for lotsa downside activity when the wedge is broken pic.twitter.com/Pmd0FgiNW0

Pitchfork dating from late 2012 is still in force. When the lower line is violated the rally from Oct 2011 is over. pic.twitter.com/ahL7B3LwCA

SPX retraced 50% of rally from 4/14 to 7/24. SPX stopped on 200 day line. Tweeted cycle chart on 8/7 showing bottom Thu or Fri & was perfect
“Probably” got that Thu or Fri bottom I mentioned yesterday. “Possible” another step down could take place, if so, no problems on downside
Ragged rally last night and today we’re on the downside again. Check out the chart looking for a bottom Thu or Fri ?? pic.twitter.com/g6c4HzzgfP

Market is struggling trying to get over the yellow line. When it makes it above, market could take off to the upside pic.twitter.com/6diCTZI13C

Market looks sold out and ripe for a rally. We’ll see in a short while.
The decline that began on 7/24 is likely finished. More should follow at a later date. The Fibonacci fan worked well pic.twitter.com/9PCkAtz0PS

NASDAQ is tearing up to the upside with much greater relative strength over the large caps. I wouldn’t bet against small caps presently.
Only a SMALL penetration of the prior low. I’m dismissing the new low cuz of tiny penetration. Only large caps were weak with new lows
This “could” be the steepest decline of the prior two steps. Step 3 can generate waterfall declines and we’re in step 3 down.
Rally finished, DJIA made new low today. SPX & NASDAQ will follow. This should be 3rd step of this decline & end of larger step 1 down.
I finished the last tweet and 1 minute later, market broke out to upside.
I wouldn’t be surprised by breakout to the upside soon. If doesn’t happen, not good sign – or I have the count wrong, always a possibility
Market is significantly oversold, see page 2 chart #1 and #2 (longer and shorter term oscillators) stockcharts.com/public/1169350…
NASDAQ is moving ahead of the larger cap indexes presently. That’s a good sign for the rally. It’s a warning if that changes
A Fibonacci Fan for the decline using the SP futures. I would expect these lines to still have power over any rally pic.twitter.com/JWZu6LTHwU

That last tweet is what you call bottom fishing, but for the moment it’s doing OK.
Looking for a short term rally (3 days??) beginning Friday. It MUST move up with vigor to qualify, better than any rally since 7/28 to 7/29
Jul 2014 – 54 TWEETS
Russell 2000 Then & Now wp.me/p1DRwF-30l
I’m not saying it’s 1987 all over again, only that similarities would exist if Friday we lost more than today. It’s just IF IF IF
As expected, we did get the minor Dow Theory Sell Signal today.
Only IF Friday lost more than 300 points tomorrow, it would remind me of 1987. In 1987, the days got worse until Monday lost 22.6%.
NASDAQ made its low of the day about 30 minutes before the close. The large cap low came just before the close.
And it looks like it’s trying to close on the low of the day. We’ll see how that turns out in another 40 minutes.
We’re probably gonna test the bottom now. Another step down coming or a successful bottom test???
Gold is in 3rd step down since a short term peak on July 10. Reversal in gold possible if it’s not in a 5 step up pic.twitter.com/Y9J4j77Aqa

NASDAQ still stronger than the large cap indexes. Rally has further to go. pic.twitter.com/lL5olHayj1

@bobswavecounts This indicator didn’t CLOSE at an extreme level and that nullified the earlier call for a rally.
Simple 13 day cycle. Next low should be around 8/7 (plus or minus a day or two). A T high is slated around 8/11 pic.twitter.com/nQv7wxS39i

Better rally presently in the NASDAQ than the large cap indexes. That means the rally temporarily might have legs.
An oscillator I follow gave a BUY signal on May 8th and REMAINED a buy until today. This is based on a close in this area of decline.
Did anyone ever tell you that bottom fishing is very dangerous??? Been there, done that.
Small & mid-cap indexes are very weak today. When they show relative strength, we will probably have a genuine rally. No sign of that yet
This decline is sub-stepping and my rule is to beware sub-stepping markets (up or down), because they go for awhile before stopping.
A 3rd version of lower stopping points. All 3 have similar stopping points, but this one is based on bigger bottom. pic.twitter.com/siSjhXls3y

Possible rally coming??? How big will it be??? First of the month is always good for a rally point.
Another version of stopping points during the decline. This version could be more likely pic.twitter.com/awMJ2OVnAZ

If we close in the area where the market is presently, we’ll get a minor Dow Theory Sell Signal. But a minor sell could lead to a major sell
Duhhhhh . . . do you think there is something wrong with the market Possible stopping points during the decline pic.twitter.com/lavPyyfqpp

The small and mid-caps are stronger than the large cap today. An indicator is showing extreme condition today & market has rallied day after
FED announcement is 2:00 PM EDT. More fireworks. The FED can only disappoint the market with its QE schedule. QE is what propels the bull.
What ails the market? GDP was great at 4%, better than anticipated by 1%. Market convinced FED will remove QE as expected, or earlier.
I put a new chart up today. It’s Mark Cook’s Cumulative Tick Indicator and it’s on Page 1 Chart 4. An earlier tweet referred to Mark Cook
A substantially lower GDP would prompt the FED to keep QE going longer than the recent announcements. GDP is 8:30, FED is 11:00, FIREWORKS!
Not saying it’s going to happen, but what if the 2nd quarter GDP comes in well below expectations of 3%??? GDP comes out at 8:30 AM EDT Wed
This is an interesting article. Doesn’t mean it will happen immediately, but it could. Who knows for sure?? marketwatch.com/story/stock-tr…
John Murphy Says SMALL CAP DIVERGENCE IS TROUBLING wp.me/p1DRwF-304
The market has set itself up on Monday to go up or down depending on the prevailing winds. That’s deep stuff there. pic.twitter.com/IWtwFPFQ1H

@cgoodman14 Costco OLD FARTS get out of the way, go home and go to bed.
Record high for Transports but no new high for Industrials. SP500 made high today. Upper line in chart still holding pic.twitter.com/kFfh60QOqA

Took me 3 tries to get that last tweet right . . . duhhhh
% above 200 day MA, top is NASDAQ, small cap, mid cap, SP500, Dow Jones. Damage begins @ small cap & rises to Lg cap pic.twitter.com/sqsG4Zj3m0

My Most Important Discovery by Edson Gould wp.me/p1DRwF-2ZU
2002 MTA Award – Identifying Bear Market Bottoms & New Bull Markets by Paul Desmond wp.me/p1DRwF-2Zu
40 year old articles written by Edson Gould are on my blog, these papers are available EXCLUSIVELY on my blog stock-market-observations.com/2014/07/20/eds…
Internal erosion of large cap stock indexes won’t be seen until near a market top. Erosion small caps can continue up to a year B4 breakdown
Small & mid-cap internal erosion taking place as Desmond explained in his paper “Warning Signs Of Major Market Tops” stock-market-observations.com/2014/05/27/527…
See internals on PAGE 1 CHART 5 to CHART 8stockcharts.com/public/1169350
Large caps might make closing highs today. Internals aren’t keeping up with prices, but internals don’t tell when a breakdown will occur
Watch upper red line, if restricts upward move in DJ Industrials, it’s upward wedge, break below lower line bearish pic.twitter.com/cKzi0h0bpH

Where Now – The 3 Step Rule By Edson Gould (1976) wp.me/p1DRwF-2YP
The Market Now – The 3 Step Rule In Action By Edson Gould (1974) wp.me/p1DRwF-2YA
EDSON GOULD ARTICLE INDEX wp.me/p1DRwF-2Yj
Bonds – Written by Edson Gould (1975) wp.me/p1DRwF-2XS
Oversold bounce is obviously in effect today, perhaps Monday too? It’s not engraved in stone that the correction is underway. Well see.
This is an important wedge to watch for a downside penetration. pic.twitter.com/wnFjkbicrL

Market is oversold and a pause or rally could begin on late Friday or Monday(???). See Page 2 Chart 0 and Chart 1 for chart oscillators.
Since today’s close SP500 futures are down another 10 points. If that doesn’t change, we will have a gap down opening tomorrow. We’ll see
“Intraday” new high in both Dow industrials & transports today, but will close with significant losses for today. Looks like a reversal day
Got the Dow Theory Buy Signal today. If the small caps like Russell 2000 ($RUT) turned up, the outlook would be bullish, otherwise bearish
We could get a Dow Theory Buy Signal today & begin the correction. That’s really perverse, but it’s what I expect, or something close to it
Jun 2014 – 21 TWEETS
6/30/14 – Super Secret Indicator, Cycles & Gold wp.me/p1DRwF-2WF
I think gold may have finally made a good bottom. We’ll see soon. I’m going to trade GDX, GOLD & GLD, gold mining & physical gold.
Page 5 is a new addition to my charts. It’s internals on various sectorsstockcharts.com/public/1169350
Check out “PAGE 4 CHART 2 – – JUNK BOND SENTIMENT – DAILY – ENTIRE STEP 3” to see the obvious count in junk sentiment.
I’m watching to see if the futures continue with lower highs and lower lows.barchart.com/chart.php?sym=…
Terry almost exclusively used the Best Bond strategy for his clients and had excellent yearly returns. My Charts stockcharts.com/public/1169350
On My Charts check out “PAGE 4 CHART 1 – – BEST BOND PERFORMANCE” using tools from Terry Laundry”. Terry had returns of 20% with “Best Bond”
We’re in rally mode after having an apparent 3 step down. The rally “should” stop short of the prior high and have more decline. But . . .
Classic reversal day today (Tue). Now watch support & resistance. First up is the June 12th low. After that, we’ll wait & see
The jury decided to have a correction. The channel of last few days is broken, but is that it, or is there more to come? We’ll wait and see
My recent bout of bearishness was because it looked like we had completed a recent small step up. The jury hasn’t decided that one yet.
Not much of a reversal is taking place today. Let’s wait and see what happens tomorrow.
A reversal is taking place today. The reversal would be more meaningful if the depth of the loss were to deepen. pic.twitter.com/dMKNxZMlhS

My super secret indicators (SSI) show Ind & Trn are in good shape, but the SSI utilities is showing problems. Unsure why or what it means
You need to watch the next reversal to see if it’s going to turn into something bigger. Probably won’t be it might be interesting.
One of John W. Thomason drawings of my grandfather taking company roll call, 5th Marines, China. pic.twitter.com/mLJ2zY2vll

All of my charts are now set up to gauge Paul Desmond’s warning signals.stockcharts.com/public/1169350
Look at “PAGE 3 CHART 1 – Reversal Watch” with Paul Desmond’s comments in mind regarding market tops. stock-market-observations.com/2014/05/27/527…
Look at “PAGE 3 CHART 1 – Reversal Watch” to see how market strength is distributed between different capitalization stocks.
Market doesn’t look like it want’s to go with my scenario so no crazy people should be shorting. This nut job won’t do it b4 Monday if then
IF MARKET DRIFTS DOWN INTO THE CLOSE, A VERY, CRAZY PERSON WOULD SELL & SHORT TODAY. THEY WOULD KEEP THEIR STOP “REASONABLY” TIGHT.
May 2014 – 18 TWEETS
5/30/14 – WISDOM CONCERNING CORRECTIONS wp.me/p1DRwF-2Wl
New blog update and it’s an important one to read, titled “THE WARNING SIGNS OF MAJOR MARKET TOPS” stock-market-observations.com
5/27/14 – PAUL DESMOND ON MARKET TOPS wp.me/p1DRwF-2Vt
Close up chart showing Fibonacci lines based on 2000 peak & 2009 bottom. A line has turned the market back 3 times pic.twitter.com/HkepS6lGys

Chart showing Fibonacci lines based on 2000 peak & 2009 bottom. A line has turned the market back 3 times. (more) pic.twitter.com/dQQDipPXV4

Follow comments on my charts stockcharts.com/public/1169350…pic.twitter.com/XfS4m2RSXF

Short comments on my charts. “TREND CHANGES – Short Term Peak Is Behind Us, RUT 2000 & Banks Almost Below Feb Lows”stockcharts.com/public/1169350
London can be leading index for US markets FTSE is last chart, DJ Utilities (mistake). I’ll fix it when I’m home pic.twitter.com/qex0ybBBgj

Today, London (FTSE) is higher than year ago high of 6,875 & 57 points off the all-time high of 6930 made on final day of trading in 1999.
Previous tweet was John Murphy’s comments for today. He and I are in the cautious camp.
10-YEAR T-NOTE YIELD FALLS TO 7 MONTH LOW, NEGATIVE DIVERGENCE FOR STOCKS, HIGH YIELD BONDS UNDERPERFORM, SMALL CAP WEAKNESS WEIGH ON MARKET
Comparing charts 10.1 & 10.2 with 2007 & 2000, makes recently look like an approaching short/intermediate top. stockcharts.com/public/1169350
1st four pages of my charts are current charts, followed by 2007 and 2000 charts. Page 10 is short term indicators. stockcharts.com/public/1169350
If London surges making a significant new high next week, I would have to re-evaltuate the idea of an intermediate term top occurring soon.
If London turns down on Monday or Tuesday, it will reinforce idea that we are in an area of some type of top, at least intermediate term.
Have expectations the London market will peak before the USA. See charts #60.3 – 60.5. London is very near new highstockcharts.com/public/1169350
Here’s a longer term view of the previous chart on junk sentiment. Each bar represents 60 minutes & begins Sep 2013 pic.twitter.com/UUvdM9e7Hu

Junk bond sentiment continues to be downward and today saw more of the same. pic.twitter.com/5tEqLdoDTj

Apr 2014 – 65 TWEETS
Index charts #2 showing a lack of confirmation of the new high in the Dow Jones Industrials today. pic.twitter.com/8554IQapQR

Index charts #1 showing a lack of confirmation of the new high in the Dow Jones Industrials today. pic.twitter.com/XBoKZw4utj

Industrials have a new high, 16580. Transports had record high recently giving a renewed dow theory signal. No confirmation on other indexes
Looking at history of junk bond sentiment charts, I’m struck by the similarity between the present and May 2011 pic.twitter.com/sgmz68In9V

LNG terminals take time to build, but don’t be surprised when the EU begins construction on these terminals in the future. Russia – kaput
The EU is held hostage to Russia’s gas supplies. Putin thinks EU has no alternatives. I guess Putin can’t spell LNG (liquified natural gas)
The Ukraine is short term neutral, but long term negative for the budget as the prospect of a new leg to the arms race is certainly possible
If the market broke out and made new highs, it would surprise a few people. The “Sell In May And Go Away” is just around the corner.
New blog update today. stock-market-observations.com
4/29/14 – MORE PREDICTIVE HISTORY wp.me/p1DRwF-2UY
New Charts – now including charts for the 2000 peak. Indexes used for longer term where possible. Some unfortunately only have data to 2010
I’ll be tweaking the charts soon. I want indicators with historical prices that date back further. Blanks on the charts aren’t acceptable.
Just posted a blog update. stock-market-observations.com
02/26/14 – NEW – PREDICTIVE INDICATORS wp.me/p1DRwF-2Uf
NEW CHARTS INDEX PAGES 1 THRU 7 MARKET INDICATORS WITH A 2007 COMPARISON CHART PAGES 8 THRU 9 SHORTER TERM OSCILLATORS PAGE 10 INDEXES
NEW CHARTS ARE UP EACH INDICATOR HAS A HISTORICAL CHART FROM 2007 SHOWING THE INDICATOR’S VALIDITY ON A MAJOR TOPstockcharts.com/public/1169350
Nobody rings a bell at the bottom or the top. But are you listening for it???
Charts ready on Friday or Saturday?? New charts have past & present comparisons on long term indicators. Shows the validity of each.
Lotsa work creating the new charts. The format will be a valid current long term indicator followed by its counterpart from 2007. More
Consumer staples are defensive & making new highs now is meaningless. Staples peaked in 2008 & consumer discretionary peaked in July 2007.
The NASDAQ will peak AFTER a MAJOR top. It will peak first before intermediate highs. 2007, NASDAQ peaked a month after SPX, ditto 2000
I’m going to separate my charts into 3 categories, predictive, oscillators and index charts. Using them correctly is up to you. More later.
I’m backdating the indicators on the public chart list to see if they had forecasted the 2007 peak. Only a couple worked well. More later
No new closing high for Dow Ind today. We’ll see if the market declines or hesitates. See chart #30.0 on page 3. stockcharts.com/public/1169350
We did NOT have a Dow Industrials new closing high in April, high is Dec 2013 Wed 04-02-2014 16573.00 Tue 12-31-2013 16576.66
London and Germany are NOT confirming the blue chip advance in the USA. Chart #90.7 on page 8 stockcharts.com/public/1169350
Key Dow stocks are not as close to their highs as the Dow average. Chart #90.6 on page 8 stockcharts.com/public/1169350
The Value Line Index is well below its high. Value Line represents the AVERAGE stock. Chart #90.4 on page 8 stockcharts.com/public/1169350
The TICK has continued lower than its usual reversal point, chart #40.3 on page 4. stockcharts.com/public/1169350
“IF” we got a Dow Theory confirmation signal, it would be interesting to see if things accelerated or stayed slow. stockcharts.com/public/1169350
The percentage of advancing issues and up volume are in a good range.stockcharts.com/public/1169350
Approaching another Dow Theory non-confirmation (4th one) OR a confirmation signal could take place (good news)stockcharts.com/public/1169350
We are longer and shorter term overbought at the present. A correction is likely not far away. stockcharts.com/public/1169350
Volume is declining on this rally. That’s never a good sign.stockcharts.com/public/1169350
Put Call ratio remains on the buy side of the neutral line. That’s troubling development if thinking about shorting. stockcharts.com/public/1169350
The new highs look feeble on this rally, I “MIGHT” think about shorting this rally later (very bad tactic so far) stockcharts.com/public/1169350
Not everybody has the patience to invest in the stock market. pic.twitter.com/ZwtA4MxR5J

I just posted a revision to my public chart list. Some of the charts are new and I hope you like them. stockcharts.com/public/1169350
Look at the chart, you can see that the market is getting oversold. Oversold is like overbought . . . a relative term pic.twitter.com/68phUHOKOE

The question is who will fall into line, bonds or commodities. Bond investors are in general considered more astute than other investors.
Rising commodity prices indicate higher inflation. Presently bonds are in conflict with rising commodity prices. They’ll get in gear later.
Economic curve, bonds peak 1st, stocks peak 2nd, & commodity’s peak last. Bonds peaked mid-2012, stocks peak next. pic.twitter.com/4WxtsBsSU4

If inflation is rising, why are interest rates falling? Rates should move up with inflation. Something is wrong with the supposition OR . .
#1 – Computer trading programs could be outlawed just like “pools” were after the crash of 1929. Computers & Pools are similar in function
Usually market will rally after DJ Theory violation before continuing through the lower lows. I have seen market declines end with a signal.
Some experts said a Dow Theory signal will be generated if we violate the June 2013 lows. That’s about 1,400 DJ IND points lower. OUCH
Today we are threatening the March lows. If we violate those lows, we’ll have a minor Dow Theory signal. (see chart) pic.twitter.com/LwT3ZDCQyc

Since the April peak, we have a daily close with a lower low after a failed rally in both DJ IND & DJ TRN. Today we threaten the March lows.
For me a Dow Theory signal is more of a slowly evolving situation, until it finally breaks the last barrier that creates the signal. (MORE)
Lower closing lows today in DJ IND & DJ TRN. These are minor lows, but the downtrend will likely travel further pic.twitter.com/dtbGlC0cbk

We have lower lows than a few days ago. That means it’s likely another step is in progress. Follow through is important to confirm.
The banking index has turned negative lately. We’ll see if that continues or if it’s just a blip. pic.twitter.com/iRoHfPoJf1

Referring to previous two tweets, we have to make new lows before any of those counts come into play. No new lows, so it’s theoretical
3 dips on NASDAQ chart. 2 more dips & it’s a 5 count. That coincides with 1 dip indexes & their future 3 count pic.twitter.com/8R9CHsaIYj

There is only 1 decline on this chart since the peak. Add 2 more dips & we have a 3 count. NASDAQ count next tweet. pic.twitter.com/lAiGhQ4COr

“The 50-50-90 rule: Anytime you have a 50-50 chance of getting something right, there’s a 90% probability you’ll get it wrong.” Andy Rooney
Regarding a Dow Theory signal, we must correct a lot before violating this year’s lows. Lowers lows are fact, but not major new lows
We’re watching for a Dow Theory signal after seeing 3 non-confirmations. I put a new first page on my charts. stockcharts.com/public/1169350
These reversal patterns appear to be building to a reversal of a significant nature. All we’re used to seeing are 6-8% corrections.
If outside reversal occurs at a resistance level, it’s viewed as a bearish signal. We had early day all-time highs in most indexes today
High & low prices for the day exceeded those of the previous trading session. The outside reversal pattern is a “bearish engulfing” pattern
Closed with outside day in all major indexes and that’s a reversal day. More in next tweet. pic.twitter.com/PAAK3ETU5C

NASDAQ down 82 points. WOW Intuitive Surgical -5.6% Amazon -3.9%. Netflix -4.4% Priceline -3.2% Google -3.4%. Facebook -2.8%
If the market follows through, it looks like we have a reversal day today and it’s an “outside day”. pic.twitter.com/wJ5UR6P5EZ

It looks like the Dow Theory non-confirmations will end soon with a new high in the Dow Industrials. DJ Transports had a new high today.
Mar 2014 – 26 TWEETS
Reversal day in NASDAQ yesterday. Many other indexes struggled to do the same but didn’t form an outside down day. pic.twitter.com/anjPbjiGji

Still wondering if those two Ts are valid for this week???? We won’t know for sure for a couple of weeks.
After recent events, a rally that goes to new highs must be scrutinized for quality & participation. This will tell us is if its for real
The Fed could start raising interest rates as soon as “six months”. Was today the end of the T???
Reposting T chart with a longer time frame, you can see the beginning of the longer T. Match the colors for the T pic.twitter.com/tSL4UGoaOj

Yes, but I will also look at the absolute bottom. I’m reposting the chart with longer time frame, you can see beginning of the longer T.
T theory peak coming this week. Is it valid? Don’t know, but a temporary peak at the old top would seem reasonable pic.twitter.com/EVK5FYWy8t

New lows were down from recent norm to lowest levels seen in the last year. New highs haven’t risen to recent levels pic.twitter.com/4L02ZYHxKF

Tomorrow is the 3rd day of this rally. It will be interesting to see how it goes tomorrow????
Break of Feb lows in both averages would be Dow Theory intermediate signal and break of June 2013 lows would be long term signal.
Dow non-confirmations are caution signals (after lower lows). 10/2012 non-confirm was 1,000 pt loss, 7/2011 non-confirm was 2,000 pt loss.
New high in Dow Transports today. Dow Industrials didn’t confirm earlier transport’s high. Waiting to see if Ind will confirm today’s high
Look at the chart at the bottom of this group (DJ Ind). The new highs are being made by only 20% of the Dow stocks. pic.twitter.com/EkeQWa0JOp

Lots of new intraday highs for indexes, but DJ Industrials still lagging. Gotta look at individual stocks in the Dow & see who’s lagging.
Did you catch my call yesterday that decline had completed a 3 count. Tweeted it B4 futures broke prior highs that were made @ 3pm NY time.
It all depends on the wave count as the market approaches old high. Next step up appears to be a 3. We’ll see.
It’s normal to expect some consolidation at the old market peak (Friday’s high) before breaking thru. But question is, will it break thru???
Ex-President Yanukovych, wanted in Ukraine, didn’t give orders to shoot demonstrators. Absolutely true, cuz Putin said so & he wouldn’t lie?
Surprise, surprise Sgt. Carter, we covered the gap tonight! What happens next, advance or swoon? It could be a completed 3 step rally?
Count NASDAQ actual index & not futures, you can see completed 3 count to the downside. I would ignore my earlier tweet RE: 5th step count
Is the last step down about to take place??? Very ragged formations to count, but 5th step down looks possible.
NASDAQ made successive lows, Tue, Wed, Thu & Sun. Dow & SP 500 did not make a new low today. Will selling intensify on Mon open or rally???
Chart of Fibonacci fan that’s working presently. The futures gapped down 12 points Sun & made a low of down 17 pic.twitter.com/9LneZpVG3h

Here is a partial history of the advance – decline line (as requested). pic.twitter.com/N9utsvTOHf

Here is a partial history of the advance – decline line (as requested). pic.twitter.com/SQkDZVaVSq

I’ve added some new charts to My Charts. Some are on the last page, but there are others scattered though the list stockcharts.com/public/1169350
Feb 2014 – 113 TWEETS
The NASDAQ is weaker than the rest of the market after showing good strength earlier. Lost all gains of last few days pic.twitter.com/3mkMLN85QU

NASDAQ is leading to the upside making new highs for the year, while the SP500 and DJ Industrials have not made new highs today.
It’s obvious I miscounted the steps on this correction. The correct count was revealed in chart of the DJ Transports pic.twitter.com/22TidK5y6M

Late trading continues to carry the SP higher. Someone expects the news tomorrow morning to be good??? Durable goods & jobless claims
Market tried but couldn’t go lower than the Tuesday low. It has a rally going on now & will be interesting to see how long and far it goes.
NASDAQ futures are out of sync with the DJ Industrials and SP 500??? NASDAQ shows 3 steps up since Tuesday bottom. pic.twitter.com/VxdhYIcW0P

Gold is on its way to validating my 3 count and end of decline. It needs to get above the red line to validate trend pic.twitter.com/aLHw2ZU8fJ

Consumer Discretionary HAD been performing badly, but it is outpacing the market on the upside. That’s a good sign. pic.twitter.com/vXlAp5imuZ

Fibonacci line holding back the declines. When this line fails, we should be in for a larger decline. pic.twitter.com/TavX2LBtea

Fibonacci fan line is stopping current advance on one of the lines. pic.twitter.com/QX1eQHXfwQ

Current rise is centering on the one Fibonacci fan line. pic.twitter.com/WzYEPW1MHq

Chart showing rally since Feb 20. Steps are obvious. Just finished step 1 in 3rd step up counting from Tue bottom. pic.twitter.com/S1h5IpGxSq

Corrections in this rally are something. Step 2 up is complete counting from Tue bottom & now in 3rd step up. New high coming, not likely.
We’re in step 3 since Feb 20 low, market is overbought, do we expect sustained new all-time highs, not probable, where to short new highs???
Rally began again at Tue close, now have a higher high than Tue high meaning we’re in step 2 from Tue low, since Feb 20 low we’re in step 3
Rally topped step 2 rally peak (good), but stopped soon after (not so good). We have 3 steps up & are correcting. pic.twitter.com/Fj5p5lw2PF

3 steps down completed this morning, rally has been labored. It needs to make a higher high above the step 2 rally pic.twitter.com/mQCXVf2nCo

02/24/14 – Stay Current With Tweets & Charts wp.me/p1DRwF-2TQ
Monthly chart from the 1963 to present. Fibonacci fan from 1982 low to different peak, restricting upside moves pic.twitter.com/DGtqhS0kRs

Monthly chart from the 1963 to present. Another Fibonacci fan from 1982 low restricting upside moves pic.twitter.com/Jf36ZJoTWC

Weekly chart from the 1989 to present, Fibonacci fan from 2000 peak to 2007 bottom. See fan restricting upside moves pic.twitter.com/RoLfYUkXMG


@wekim77 I use weekly time settings for long term, daily time settings for intermediate and usually 60 (or less) minutes for short term.
That 3rd step up since last night is confirmed with larger correction underway. No iPad twitter password last night & I couldn’t comment
SP & DJI futures, count 5 steps up beginning Feb 3 to Feb 5, Nasdaq counts 4 up from Feb 5, I’ll go with 4 steps up, market still overbought
Minutes ago, we completed a 3 step up counting from last night, do we get 5 steps? Larger scale we have completed 4 or 5 steps up, (more)
When I realized that I had miscounted the steps down, tried to tweet but failed, SP had a 5 step down, ending just before midnight, (more)
Chart of recent action in the March SP contract. Larger step 1 down is evident and tonight’s step 2 down also. pic.twitter.com/f9lTByLdPh

Market ran into trouble tonight & has broken below the Fri lows & is in step 2 down since Friday peak. It might be in larger step 2 down???
But is the correction over?? Not likely. There are more nasty surprises ahead & very likely soon. Probably a trading top underway.
We did make it to 1844.50 (target was 1846) before flameout took place this morning. Probably begun correction of very overbought market
FED minutes are out at 2 PM Wednesday. That could be an upper or a downer for the market.
Is market gathering strength to make it through the 1840 level tomorrow (March contract)?? Market is VERY OVERBOUGHT & rally could be short
The Mar 2014 ES (SP500) futures contract is 1840 (again). Will it make it through 1840 and get to the predicted resistance level at 1846?
Feb 13, said next projection level for Mar 2014 ES futures contract was 1846. Contract hit 1840 today. Will it make the last few points???
Gold appears to have broken a trend line. Was that end of 5 steps down or step 2 ??? Need higher highs to confirm pic.twitter.com/h67A1RbjSy

Looking at my oscillators, they show that market is overbought and should correct soon. Maybe next week if not sooner.
Breaking free of 1820 ES Mar 2014 means next Fibonacci projection level is 1846 for futures. Prior peak was 1846. Funny how that works out
If gold breaks out, what does that mean for the stock market??? Gold began its decline exactly when step 3 up began in the stock market.
Gold breaking out??? Labeled white steps 2 & 3 may be part of larger step 2 down??? Breaking the fan line important pic.twitter.com/YeJBOmHkMG

@wekim77 I think the NASDAQ will make new highs, but the large cap stocks may not. It will be clearer as we approach the prior peak.
100 largest NASDAQ stocks pennies from new high, adv-dec line at new high, up-dn volume line nears new high ???? pic.twitter.com/j52deNby4s

Interesting Fibonacci chart. The 1st semicircle shows bottom, 2nd shows mid point & 3rd shows a top (temporary???) pic.twitter.com/ImqhkmEfYu

Market penetrated resistance of 1808-1813 & needs to close above this level. New chart with leading characteristics pic.twitter.com/FnsxPpadeq

An update to the earlier price projection chart with resistance at 1808 and the present level of 1798. pic.twitter.com/vvqizciplh

A price projection chart. There is another line at 1808 (not shown). pic.twitter.com/c3NT34p9Vh

02/10/14 – Jeff Saut’s Great Comments This Week wp.me/p1DRwF-2TJ
Notice on prior important bottoms, green line spiked upward before or on the bottom. Maybe that’s gonna happen soon. pic.twitter.com/BC4Q0XZS08

Alternate wave count since 2011. This is a worst case scenario. We’re waiting for a channel break from late 2012 pic.twitter.com/qdvRSE70O5

“IF” step 4 (white) is finished?? There is more decline ahead. Rally since Oct 2012 is one long step and still intact pic.twitter.com/hebhblYJTM

Fibonacci fan chart showing the uptrend since last Oct. Notice the market decline stopped on the lowest fan line. pic.twitter.com/ILLHEYlohj

Fibonacci fan chart showing recent downtrend. If this fan is valid, the market could run into some resistance soon. pic.twitter.com/mngWygrs25

Bitcoin prices plunge . . . duhhhhh, that’s what happens when you get involved with a bubble.
Very nice market action.
NASDAQ “IS” leading again. That’s good for now.
We are in the area of a projection point for the SP futures, 1780. Prior peak was at 1784 and we are there again.we’ll see if it’s valid
Now wasn’t that an interesting response to the jobs report. We are back to the bad news is good news market mode. It’s all about the FED.
I’ll likely be asleep when the fun takes place RE; jobs report. I miss all the good stuff. But I manage the moments with buy & sell stops
The NASDAQ has made a new rally high tonight before the Dow or SP. Is the NASDAQ showing new life again as a leader?? We’ll see.
China debt under scrutiny, difficulties in $6 trillion off-balance-sheet trusts & wealth-management products. Sounds like 2008 problems.
China’s policy shifts are a bigger driver of the selloff in emerging markets than the Federal Reserve’s decision to dial back stimulus.
Investors Shift Record Amounts From U.S. Stocks to Bonds. U.S. equity funds had $24 billion in outflows in the week to Feb. 5
Every major country’s stock indexes down after up thrust earlier, SP down 9 points from peak. Interesting if it continues or stops soon??
Futures falling back. Rally must have been news in Asia or Europe & not important. Regardless, watch carefully for response to jobs report
Seen lots of market turns after INITIAL reaction to jobs report is finished. Market has changed direction both up or down after reports.
If jobs report leak has taken place, watch for a flame out after a strong market open tomorrow. If market continues going up, good sign.
Moments ago the SP futures broke upward. Seen leaks on jobs report before sending futures up early, or there is good news in Asia or Europe?
The market is taking a breather exactly where the projection point was anticipated (1769 March ES contract). At 1:15 the contract is 1767.
Possible projection for a breather right now. Next projection point is 1780. pic.twitter.com/Jz5MAIb0Dt

It looks like we are in the 3rd step up from yesterday’s bottom. See charts. pic.twitter.com/ucVyplisdh

We could presently be in step 1 or step 2 up, depends on where you put the bottom. pic.twitter.com/jgmuUh7dbq

Employment report Fri. We “can” get fireworks first, trend change second. Watchful caution cuz market can either keep going, or fade fast.
The market was near the bottom of the envelope that normally confines the market swings. pic.twitter.com/t5f1SMYze1

We got the news this morning that gave the market the kick that it needed. See chart for the wave count. pic.twitter.com/acvLrrAckT

The market is waiting for good news before going up. That’s a crap shoot waiting for good news. I’m taking my small profit and waiting too
I’ve seen lots of trend changes take place after the initial response to employment report. Maybe still down into Fri morn & then reverse??

We’re correcting. Wouldn’t like to see the correction go lower than 50 to 60% of today’s rise. Otherwise it’s another stab at the bottom.
Market stopped on an uptrend Fibonacci fan line. That gives life to the uptrend??? pic.twitter.com/ybbaCNjx0Y

Could have a mini one day reversal if we close up today (above yesterday’s high is best). Market made new low this morning on most indexes
We’ve made a high above this morning high, but we need to go higher than yesterday’s high for higher highs.
Presently, the market is struggling trying to make a higher high. It’s just slogging along slowly. No rapid rally here.
02/05/14 – Bottom News – Watch My Tweets wp.me/p1DRwF-2Tx
Looks like we have the bottom that I tweeted about last night. Now we’ll see if we can get a few days of rally.
I’m watching tonight’s decline to see if we can get another bottom in the area of yesterday’s low point.
Trend lines since 2009. Notice the auxiliary line based on Nov 2008 peak. Funny how those past peaks work out. pic.twitter.com/ilT4h9eUu2

We’re having a rally based on the trend lines. We normally don’t break longer term trend lines on the first attack. pic.twitter.com/l27xvxJvOm


50 day moving average percentage is in the area of where a bounce could take place. Crude timing indicator. pic.twitter.com/FcK4mValVX

The advance decline is not as bad as the up down volume. There is selling intensity in some sectors, but not all. Buy the dip at work???
Nikkei down 14% for the year!!! Wow, that’s a BIG time loss
Tonight, Nikkei fell 610 points, or 4.2%, to 14008.47. Loss was worst single day since 6/13/13, the index is down 14% for the year.
SPX is near the bottom of envelope, only 11 points from the edge (1730). The envelope width is 136 points pic.twitter.com/ypRCIkRTOj

Largest envelope penetration on 1st chart since 2011. Is it significant? Yup, it’s not a typical decline. pic.twitter.com/4pmS6ymL9X

Waterfall decline today. Waterfalls are frequently near the end. As long as the waterfall doesn’t gather momentum.
When this decline ends with a channel breaking rally, there may be 2 more steps down before it’s really finished. It depends. More later.
SPX has up trend line around 1735 Multiple down Fibonacci fan lines around 1720 Last step down in decline will be near prior step’s close
Jeff said: “while a 7% pullback (to 1719) puts the SPX back into major support between 1700 – 1730” We’re at 1741.89, Monday close.
Blog update just published stock-market-observations.com
02/03/14 – Jeff Saut, Hedge Funds, Dow Theory wp.me/p1DRwF-2T7
DJ Industrials break the trend since late 2012. Market oversold. Wave count on this chart is a worst case scenario. pic.twitter.com/slKve6iFEd

Russell 2000 breaks the trend since late 2012. pic.twitter.com/1pMkBgBvXI

Today Dow Transports closed below Dec lows, triggering a MINI-Dow Theory Sell Signal. A full Dow Sell Signal comes at lower levels. Caution


If Dow Trans closes below Dec low, we have a “SMALL” Dow Theory Sell Signal. We had non-confirmation previously. pic.twitter.com/0NA0tkM7at

Looking at prior tweet, you can see why I don’t want step 5 to end, counting since 1932 bottom. Big things could happen after that.
An interesting chart. Chart doesn’t number the years correctly from 1928 to 1949. It says 2049 instead of 1949. wp.me/a1DRwF-2T5
This is getting ugly & deeper oversold. Remember where I said oversold was a relative term? Now I have to look at my longer term charts.
Since we are near the bottom of the envelope on this chart, we could have more rally. pic.twitter.com/wDu9bgsrTH

02/01/14 – Warning Flags Waving wp.me/p1DRwF-2Su
Blog update coming in the next hour. stock-market-observations.com
Jan 2014 – 105 TWEETS
Listened to Jeff Saut’s Friday update & he’s cautious, but not a bear. He’s looking for a bigger bounce before more down can appear.
MADE A MISTAKE !! DJI Dec low = 15739.43 DJI Jan low = 15738.79, BROKE DEC LOW SPX Dec low = 1775.32 SPX Jan low = 1774.20, BROKE DEC LOW
The January Barometer indicates a bad year after a negative January. Watching for a break of the Dec Low in 1st quarter is more important
The Dow Ind intra-day low for Dec was broken yesterday. The Dec closing low is still intact. SP500 was not broken. wp.me/a1DRwF-2St
Jeff Saut thinks we’ll likely have more downside before a bottom is reached. Says a lot of technical damage has been done. Ditto.
Junk bonds had a vigorous rally today. wp.me/a1DRwF-2Sp
I’m going outside to play. I’ve worked enough for today.
Forgot to mention in the blog to watch for higher highs and lows to verify a valid rally. So far that ain’t happening.
Just published a blog update. stock-market-observations.com
01/28/14 – Wave Count wp.me/p1DRwF-2RZ
DJ Tran made new high & not confirmed by Ind DJ Tran broke prior low today. DJ Ind has been making lower lows Dow Theory warnings flying
Wave Counts This is my best outlook for the market wp.me/a1DRwF-2RXThis is my worst outlook for the market wp.me/a1DRwF-2RY
Super Bowl tickets are the cheapest in a decade. Wimpy CEOs & wealthy don’t want to sit in 15-20 degree weather.
1930’s generation accepted their fate quietly and suffered. Today’s generation will throw rocks & bullets in a similar 1930’s situation.
Gallup poll finds two-thirds of Americans are unhappy with the nation’s distribution of wealth An entitled generation that won’t go quietly
Parts of London becoming “ghost towns” because overseas investors buy properties and leave them vacant. Stupid is as stupid does.
Will Apple’s earnings meet expectations today? Naysayers say no, soothsayers say yes. I say don’t care right now, but later I will.
GS – S&P 500 continue down based on Sentiment Indicator, which shows clients hold high net long futures positions & implies negative returns
The CEO of BitInstant, a Bitcoin exchange, has been arrested at JFK airport and charged with money laundering.
What would we do? It’s the end of the world as we know it! Yuk yuk. Justin Bieber, 19-year-old heartthrob could get deported to Canada.
Shiller expert on bubbles, & adamant Bitcoin is a bubble. “It’s just an amazing example of a bubble. No, it’s not such a great idea”
Davos – good times finally about to arrive. Seen stock market character change when that happens. First chapter of several could be ending
Too much money (hedge funds) chasing returns in too few places ripe 4 accidents. Word that differently and you have inflation definition.
Hedge fund unwinding in Treasuries affecting stock market. Dummies sell good stuff to unwind stupid stuff. Currency cuckoo going on.
Wave count “suggests” present decline could end on Monday. Expectation next large rally will end step 3. Don’t know about 5 steps??
And everything seemed tranquil a week ago . . . Or some people thought it was tranquil. I want to see the next meaningful rally.
140 more Dow points and we will be under the Dec low. That’s means trouble. Jeff Saut could have an interesting column on Monday.
Davos – His biggest worry: nobody appeared to be worried about anything at all – Less than 24 hours later, devaluation of the Argentine peso
Looked at gold recently? It “could” have finished 5 steps down. Not convinced yet as channel is intact. Timing is interesting if true.
When something goes wrong, I always worry some idiot had it all wrong & is losing billions. Collapse becomes contagious. Hope all OK.
And another week bites the dust. We’ll see if more chaos develops internationally over the weekend.
More organized declines are normal, ending with a smaller waterfall. Market level now and I’m watching for a break up or down. Up likely??
Worst declines I’ve ever seen were Thursday down, Fri down MORE and crash on Monday. That occurs very very seldom, scary when it happens.
Doesn’t look like my stop is going to be hit at this time. Watching for waffling along a bottom, maybe in a few hours.
NASDAQ clearly shows 3 steps and rallying. Traders will cover shorts here for awhile.
Watch for meaningful higher highs, bye bye short. Watch for Dow penetration of 15,739, indicator says bad things ahead on break of level.
I’m watching for bumping along a bottom. Beginnings could start at 1795. Maybe crushed later. Jan barometer will be negative, bad year.
In bigger scheme of things, this decline doesn’t fix anything. But market is always full of zigs and zags. I lowered my stop today.
Do we get 3 or 5 steps here? We’ve lost 50 points, peak to bottom so far. We “could” get a rally here, but who knows???
Got 3 steps down, but subdivisions can drive you crazy when they start. Rely on channel trend breaks for confirmation of trend.
Saut said if 1813-1808 hit, likely correction under way. That level was smashed today, but not closed under. So it’s still valid.
J. Saut said been raising “some” cash last couple weeks. I thought he said he was buying weakness. Probably has stops set and been hit????
Will it finish off after 3 steps? Or do we get 5 steps? We watch and take our cues from market. Jeff said this is a seasonally weak period
The SP500 is playing with 1808 We are in 3rd step of the decline that began after hours on the 22nd. We are in 2nd step of 3rd step down.
This market is NOT oversold. The McClellan Oscillator sits at +28 & oversold is around -150. The market “could” get more legs if needed.
We finished 3 step down, began after midnight last night. Look at bigger picture to see longer perspective count. No breakaway yet. Fuzzy.
Jeff said seasonal this part of January is not good. He is buying on weakness. I wouldn’t touch it before Friday, even if then???
Dec closing low was 15,739.43. DJI is 16,183, no problem yet. Jan barometer, Dec close 1848, now 1844. Negative now, but EOM ???
Now it’s playing with 1813 level. Jeff says 1808 is support after that. Remember the Dec low rule, no penetration allowed or big trouble.
Confusing, yes but it’s always this way. Agreed stocks could move much higher, but they COULD move lower first. Crushed 1st support.
Transports made all time high in May June 2008. How valuable was that? BUT they were in gear when downtrend first began in Nov 2007.
Listened to Saut today and agreed with some and disagreed with some. Small, mid and spec stocks peak later and are worthless in real time
I like Mohamed El-Erian. He’s a smart guy that I like to listen to. Don’t care to listen to Bill Gross. What’s up with him leaving?
Something is finally happening. I’m watching support levels. 3rd lower closing step on DJI. Of 5 steps? I would guess yes, but watch
The place is a ZOO. Lots of weird people here so I blend in perfectly. I came for the RV show, which is really big. Temp is very pleasant.
I’m in Quartzsite, AZ, population 3,400. About 1.5 million people come here annually mostly in January and February. That’s a LOT of RVs.
We don’t make anything, we just spend money. That’s a hard thing to wrap my warped brain around. We just “service” everybody. Huh????
Consumer discretionary has been a bright light since this rally began. Now it’s dimmer. 70% of economy is discretionary and staples.
How bad can it be with junk bonds going up?? That’s a kicker if you want to be bearish. Consumer discretionary down. That’s bad & bearish
NASDAQ still in narrowing upward wedge since Oct. That’s very bearish if occurs in the last wave up. Are we in last step up? You tell me?
18 days of going nowhere and still counting. Is it a high level consolidation or sawtooth top??? Watch for a breakout or breakdown. More –
Only a few have noticed that I took all but one of “My Charts” down. The one chart is back because someone requested the chart be returned.
I think this chart deserves special attention. Watch for a trend break. pic.twitter.com/T6oD6xCDDD

A trend pitchfork for the NASDAQ since 2009. pic.twitter.com/sTQUwPlGht

Those little yellow specks on the prior picture is the end of a step. 5 steps in total, but it must break the channel to be effective.
This chart looks interesting. It may have finished 5th step down. No one likes gold anymore. pic.twitter.com/agVyeZMcnf

Dow Theory non-confirmation, that’s a negative until it’s resolved. pic.twitter.com/ONyywQuOZ5

Dow Theory non-confirmation, that’s a negative until it’s resolved. pic.twitter.com/sRE7RDOPso

Some day my blog will no longer be found at: stock-market-observations.com It will be found at: stockmarketobservations.wordpress.com
A monthly chart showing how the channel concept illustrated the wave counts since 1966. Future wave counts too??? wp.me/a1DRwF-2RV
01/15/14 – COPYRIGHT ENFORCEMENT wp.me/p1DRwF-2RJ
Here is an interesting Fibonacci chart relating the 2000 peak, 2009 bottom and the near term high. wp.me/a1DRwF-2RI
Watch for termination of the count on chart #20.0, page 2, My Charts. A longer correction should begin there. stockcharts.com/public/1169350
Different interpretations of the current wave count. wp.me/a1DRwF-2RFwp.me/a1DRwF-2RG wp.me/a1DRwF-2RH
Speculation. Low price stocks are out performing the big guys (Dow Jones or SP 500) wp.me/a1DRwF-2RD wp.me/a1DRwF-2RE
We had 3 steps down as seen by this chart. Probably no more decline for now. wp.me/a1DRwF-2RC
QUIET after hours trading. Trendless other than horizontal.
Finally, a higher highs rally at the close. We’ll see what after hours trading does. I like after hours because its slower & laid back
If this decline continued, when would I say, this isn’t tax selling??? Not a clue, other than too far is too much. I just go with the flow
More Jeff: “In fact, the only negative I see is the shrinking number of new 52-week highs.” Things happen for not much reason sometimes.
More Jeff: “all my Advance/Decline numbers confirm a healthy uptrend for the markets. Ditto, Cumulative Points Gained and Upside Volume.”
Jeff Saut said today: “Near-term support exists at 16375 – 16400, yet I do not expect that level to be tested.” Broke through it already.
My Charts stockcharts.com/public/1169350 Page 2, #20.4 – this chart was a kick to short. Dow Theory non-confirmation taking place too. #20.6
Waterfall decline presently. Don’t like that. Either close to rallying with decline over, or beginning of something bigger. Wait & see.
I did like the story about tax selling not taking place in 2013. Selling in early 2014 allows tax to be paid in April 2015.
Don’t ask why I went short, cuz I can’t explain it. It mostly was a gut feeling. I gotta recognize when it will be over & take profits
Beginning fast downside market breaks are always signs of a market that is going deeper. Shorts are finally becoming comfortably profitable
Upgraded again to Mavericks & no problems with Parallels running Windows. I downloaded a newer version of Parallels and that did the trick.
If market continues to rally, it will be another example of bad news is good news. Many will interpret it as FED will not ease QE for long
Uprgraded to Mavericks OS. Apple software worked perfectly but not windows. Made clone B4 upgrade, rolled back to old OS. Try again on Sat
New all-time high in transportation average today. Industrials have to confirm or it’s a negative. It has awhile before it has to confirm.
10 year rate peaked on Wed indicating bad economic news was coming. It came today. Junk bond prices are rising also.
We don’t have lower lows yet, so it’s not a downtrend yet. That will make me uneasy until we see lower lows.
Forgot to mention that I don’t think this is THE top, it’s just A top. Should decline and get 1 more top & then “could” have THE correction
I’ll let you know when it’s in the rear view mirror. Right now it’s just a knee jerk reaction. I gotta be careful for awhile!!!
In this business you’re never sure until it’s in your rear view mirror. Market had been “sick” since the new year. Tax selling now???
I’ve been thinking something newsworthy was going to cause the correction to begin. We “probably” got it this morning in the jobs report.
So, is that it? Can we correct now? I’ve been short a couple of days now. Stupid & daring move in this market. No one said I was smart
Watch for indications of early leak of FED minutes. Are you saying that someone might leak the report??? YUP. And I used to be so naive.
Tax selling taking place now. Pay taxes 4//15 instead of 4/14 on long term gains Any decline could accelerate because of tax selling??
Got a NEW indicator in My Charts. I’m playing with it right now, trying to figure out where I’m going to put it. Looks pretty good so far
Friday is a seasonally bullish day. We’ll see what market does tomorrow. Dow has been up 14 of last 20 years. It could be a rebound day.
The decline was supposed to start Monday, not today!!! I figured they weren’t coming back to work until Monday & then selling would begin
Will a several month short next Monday be a good or bad trade? Volume must rise beginning next Monday, or else it’s bad news for the upside

Leave A Reply