Correction Variations & My Tweets
 9/4/13 . . .
If you don’t understand my unorthodox wave counting method, otherwise continue on . . .
—————————————————
MY FACEBOOK PAGE – To see both my Tweets and Blog updates
—————————————————
Recent Activity:
August 4th – Shorted Sunday evening
August 11th – Covered short & shorted again at higher levels (same day)
August 30th – Covered short & went long
September 3rd – Sold long
Reestablish long when possible
—————————————————
I’ve had 19 Tweets since my last blog update. Read from the bottom up to follow the timeline, from #19 to #1.
-
Market corrected late Sunday then formed a small 3 step up ending on today’s open. Took profits & doing nothing for now except watching.
-
Looks like the Dow will open up about 120 points tomorrow morning after having a nice advance and small correction over the last 24 hours.
-
SP futures are up 12 points tonight Covered my short and went long on Friday and it looks good so far (see earlier tweet) We’ll see later
-
Looks like they tried to scare out my stops (unsuccessfully). Takes more than that to quake my boots, but not a lot more sometimes.
-
Curses, foiled again by the evil Nemesis of Wall St., “The Early Jump”.
-
Covered and have a token long. Close sell stops to liquidate long and short again. Probably just the end of act One. But I’m often wrong.
-
@BobsWaveCounts Always a chance of a 4th and 5th step here, It all depends on whether the market is aiming for Oct or Jan. We’ll see. -
Since Aug 5 secondary indexes show 3 steps down. Large caps look more like 2 steps down. Watching carefully for more telling indications
-
We had the aborted 3rd step up late last night. It stopped at the prior high of step 2 and then fell back.
-
Had 2 steps up since the bottom on the 27th. Large rallies extend the decline timeline further out; the opposite occurs for small rallies
-
NOBODY went short on 8/4/13 (I did). Then John Murphy opined the bull is still intact. HUH?? But it went well for me. Oct-Jan target w/ rallies
-
Gonna have some fun before the end, this is gonna be one mean correction. It’s got a lot of mean in it today, NASDAQ -77 or more than -2%
-
In case you’ve never looked at an enormous book site, take a look at:
Some of these are available for download too.
-
SPX made small break above Mon-Tue highs and DJI is lagging badly. SPX keeps trending higher. Small caps are running higher
-
Couldn’t break the Mon & Tue highs. Not valid yet, but looking at inverse head & shoulders forming???
-
Looking for rally above Tuesday’s high in the DJI and SPX, not small caps. Small caps have already rallied above Tuesday’s highs.
-
Looking for higher highs – a breakout rally above Tuesday’s highs. The rally is a selling opportunity, because we probably aren’t done yet.
-
I just scanned my archive and realized that I’ve been writing my blog for over 2 years. All those words and nothing coherent amongst it all
 Bob Karrow
 —————————————————
- It’s “possible” that we have seen the correction for “the moment”. That means rally, possibly to new highs.
- It’s also “possible” that we have only completed 2 steps down. That means there is another decline before a meaningful rally takes place.
Both possibilities will reveal their true character later. At this moment I don’t know which is correct.
The following concerns the wave count, which creates the possibility that we will see a significant rally before more correction.
The wave count issue dates back to the August and October 2011 bottoms. If the uptrend wave count began at the August bottom, we have a 3 count ending at the peak in March 2012. This 3 count completed the 1st step up. After that, the wave count is self explanatory. See chart below.
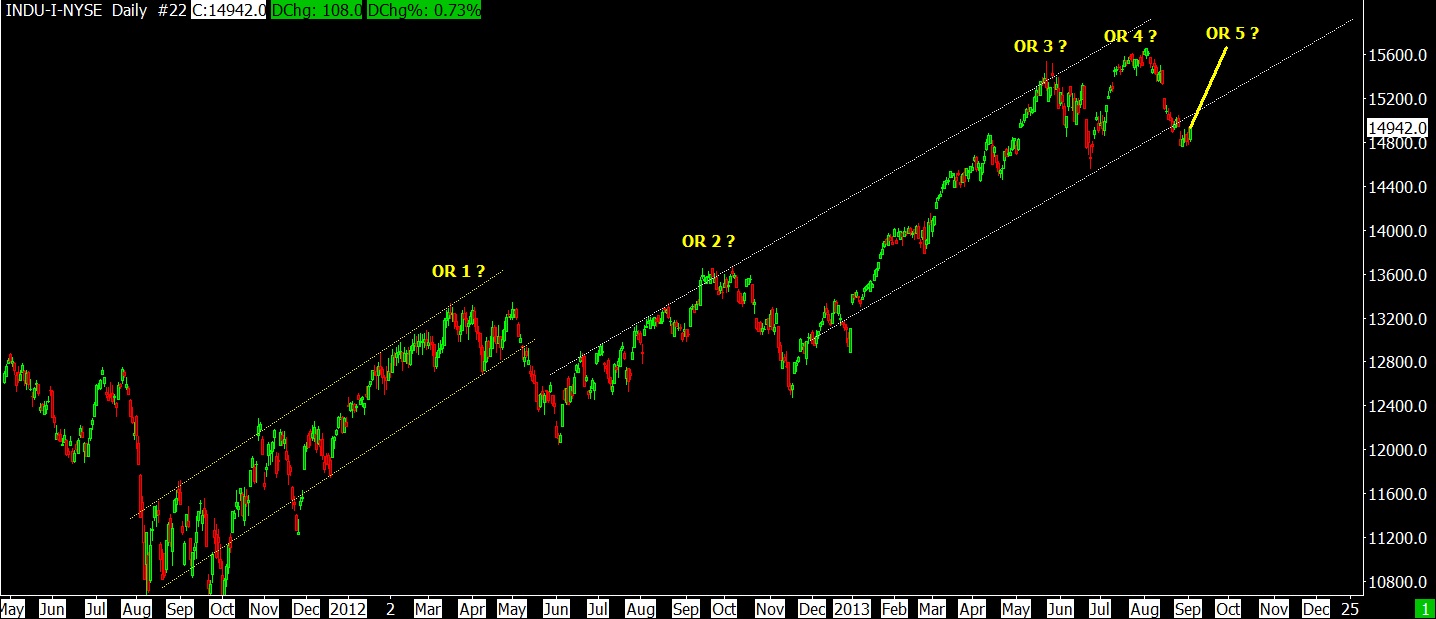
9-4-13 DJ IND DAILY BARS
If this wave count is valid, we would have a 5th step ahead of us. After that, the real correction would begin.
ALSO, a strong rally to the old highs could create another one of those ambiguous points for me where I’ll say (in the future), did we just complete 5th step up, or did we just complete the rally after ending step 1 down???
Regardless, the future market action is the same when either rally is completed. DOWN.
(The voice is John Travolta in 1979 as Vinnie Barbarino on “Welcome Back Kotter”.)
—————————————————
- Click on any picture or chart to enlarge it
- A chart denoted as “ES” is a SP 500 futures chart. YM is DJ Industrial futures, NQ is NASDAQ Composite futures.
Leave me a comment or question just a few inches below here. If it says “Comment”, click on the comment and you’ll see “Leave A Reply”.
All Rights Reserved © ™

September 4, 2013 at 6:28 PM
I don’t have any numbers in mind, but Fibonacci retracement levels can be important. If we get above 62%, that can be an indication that the prior high could be breached.
First we have to get above the last minor significant high, which was on August 26th.
For an uptrend, I’m big on higher highs and higher lows. The concept is so simple that it’s elegant.
Sometimes I can hear the market speaking to me and other times, it doesn’t say a word. I think the more I listen, the more I hear. Presently my life is getting in the way of my stock market listening. I hate when that happens.
Bob
LikeLike
September 4, 2013 at 4:30 PM
High Bob do you have a level where you would get long again and be confident we are in a 5 Th step up?
LikeLike