07/25/13 – New Highs Ahead & Then Watch Out

MARKET MESSAGES
7/25/13 . . .
As we draw closer to an inflection point, I will be updating my blog more often. While we were rallying strongly, blog updates were unnecessary. But now we are approaching the nitty gritty where things are likely to become nasty.
I ran the Hurst cycle software today and it had some very interesting projections. There is already a lot in this issue and fearing overload, I’m going to wait a couple of days and then publish the cycle results. So be on the lookout for the next blog update.
We have been in the 3rd step up since November 2011 (counting since March 2009) and all reversals need to be watched closely for indications of termination of step 3.
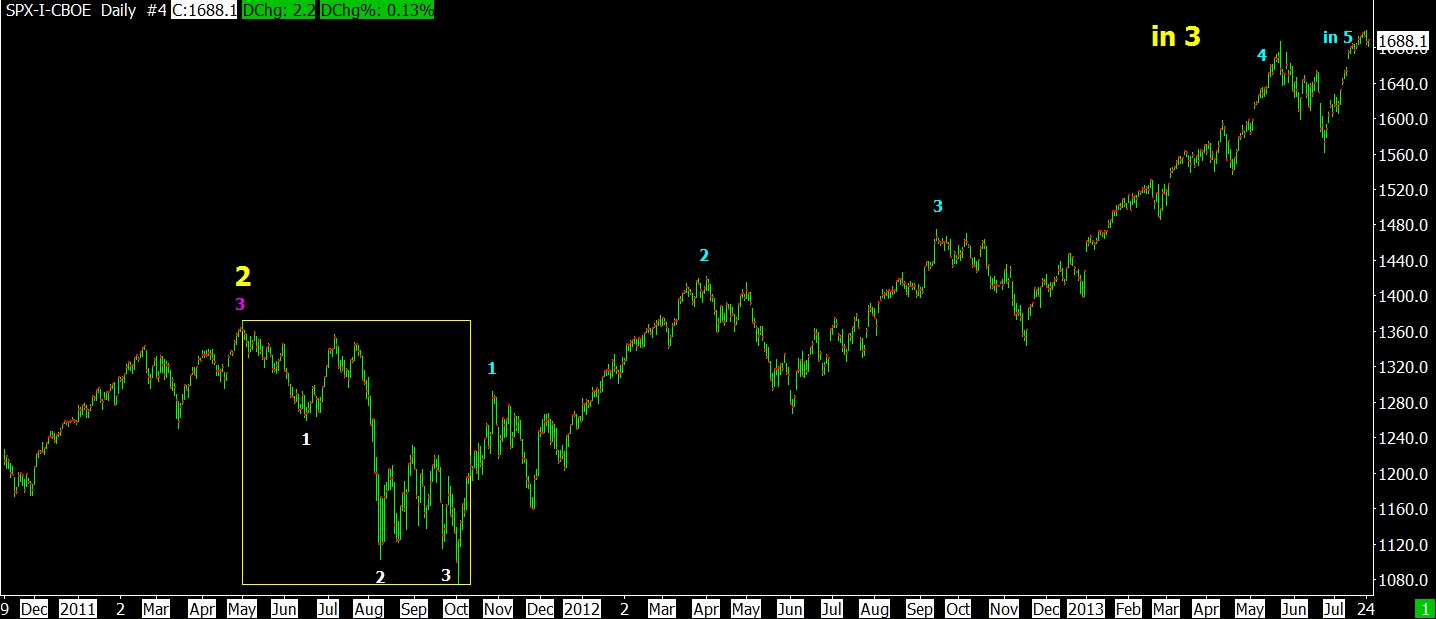
7-25-13 SPX DAILY NOV 2011
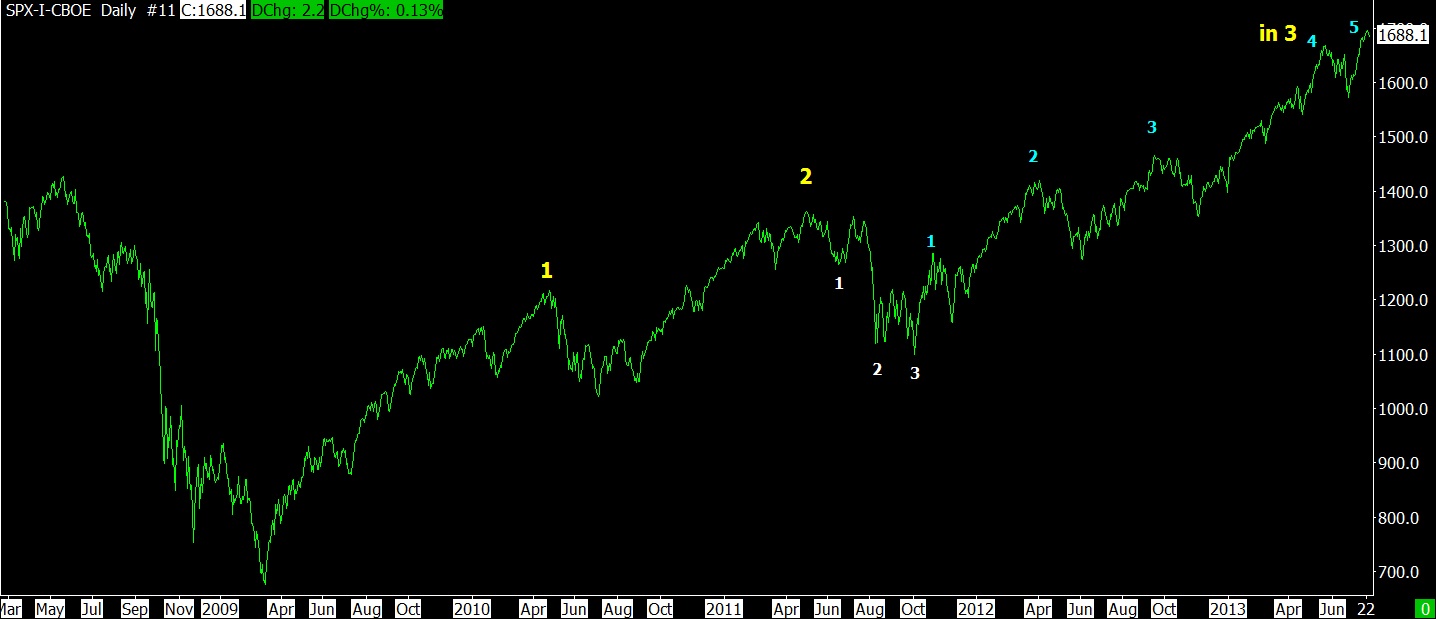
7-25-13 SPX DAILY MARCH 2009
Our present rally began in November 2012 and some indexes show completed steps.
The Russell 200o index (RUT) has a clear 5 step count to the upside since November 2012. But is this step 5 rally complete??? A channel break will answer the question.
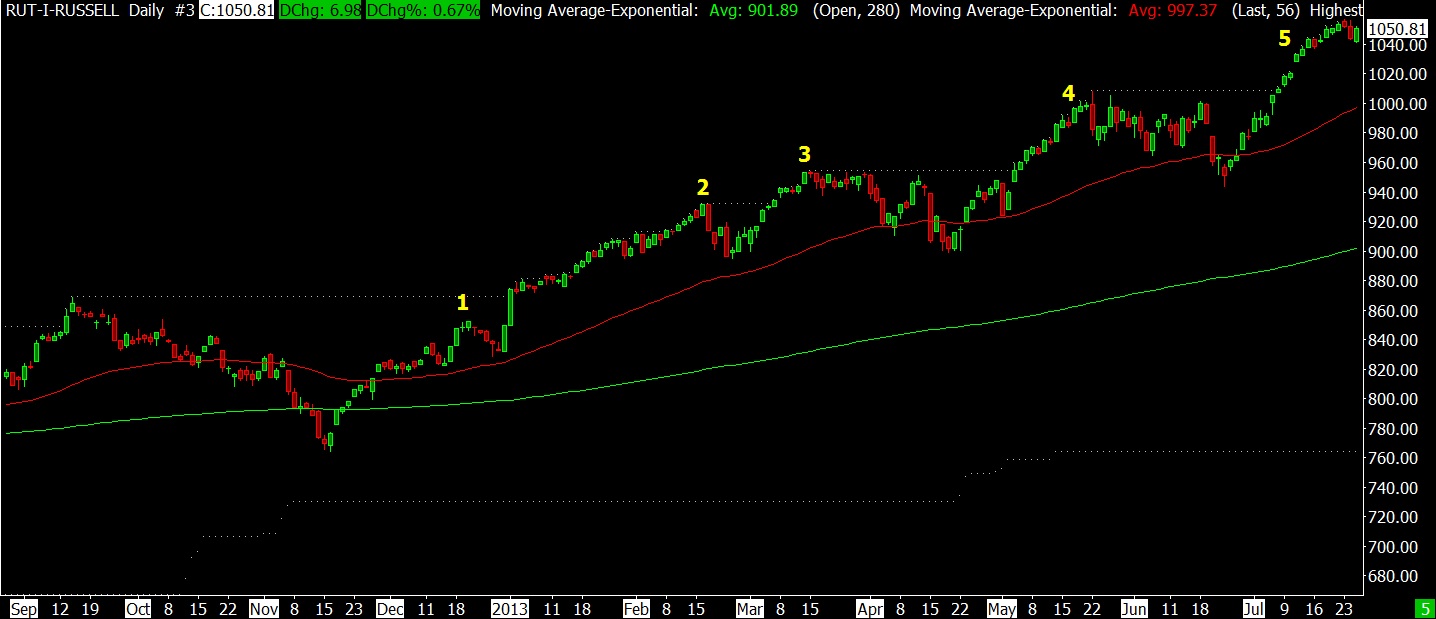
7-25-13 RUT DAILY
We do have a 3rd step channel break in the DJ Transports. This doesn’t preclude a 4th and 5th step up.
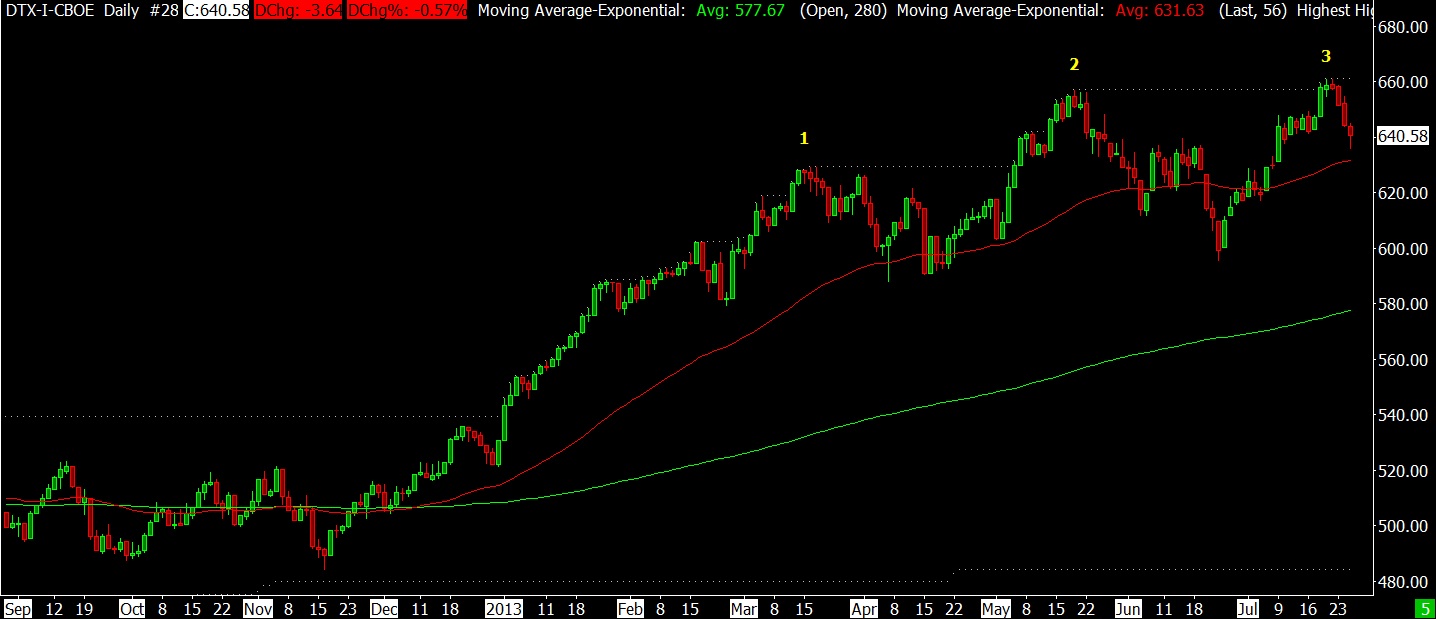
7-25-13 DOW TRANSPORTS DAILY
I find the daily chart for the Dow and the SPX to be ambiguous on the count. On the surface it appears to have completed one long step up and is in the 2nd step up presently.
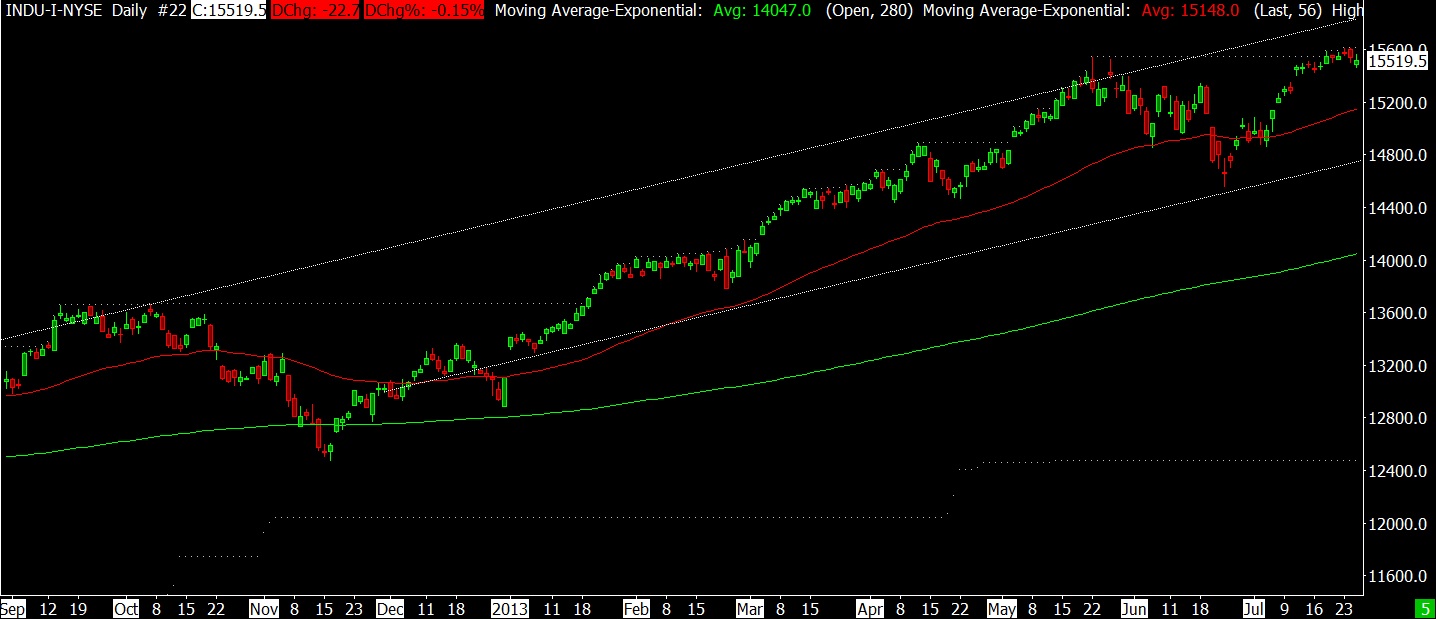
7-25-13 DJ IND DAILY
Ditto the SPX chart.
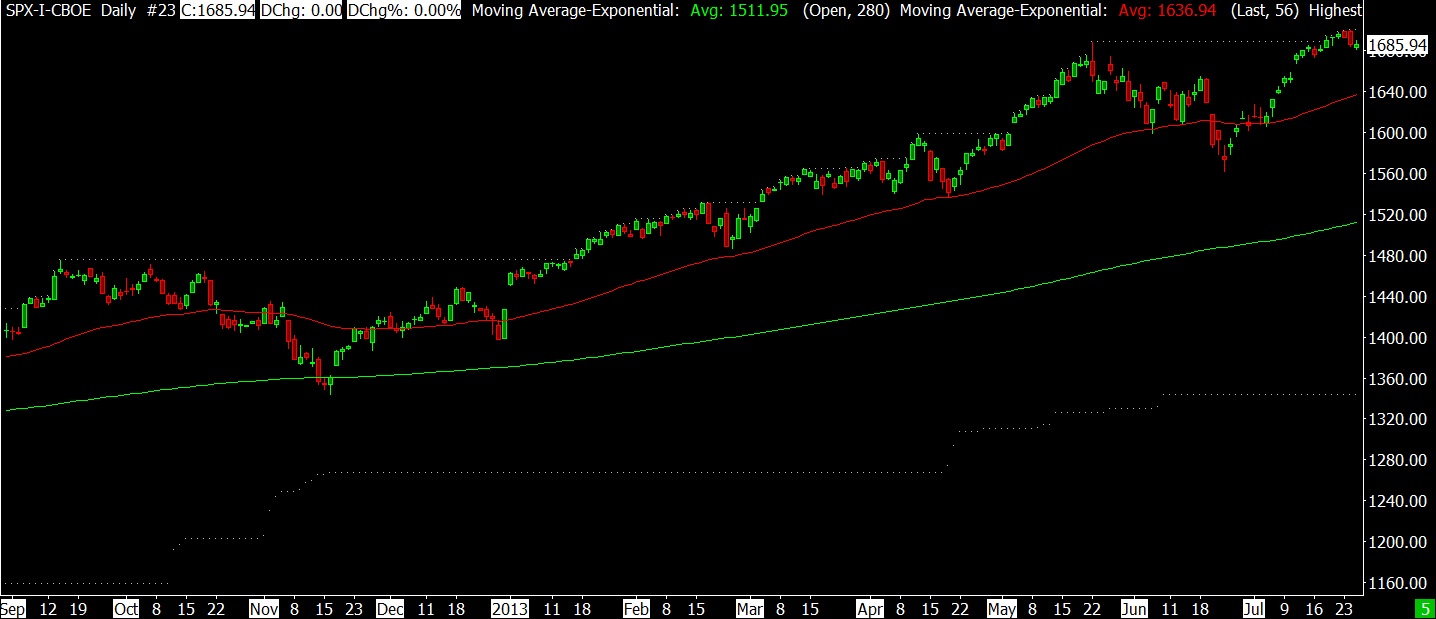
7-25-13 SPX DAILY
Looking at the intraday charts, the major indexes appear to show 2 steps up since the June 24th low.
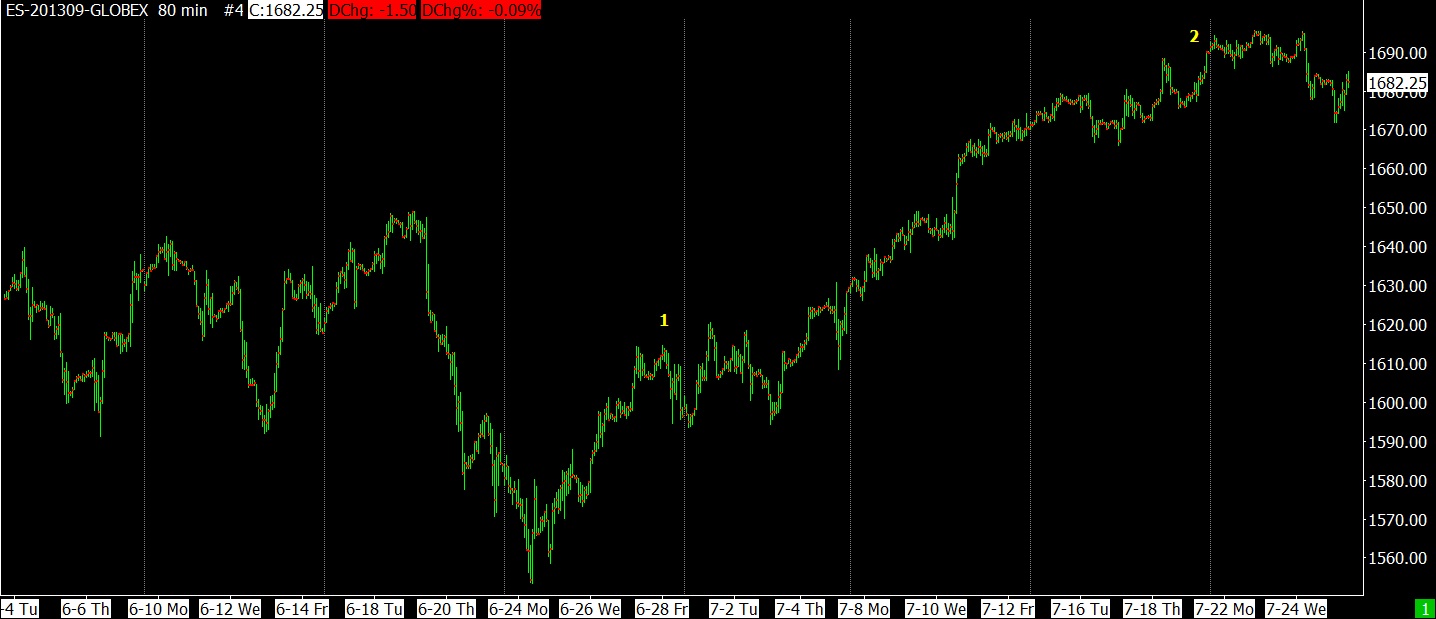
7-25-13 SP FUTURES 80 MIN
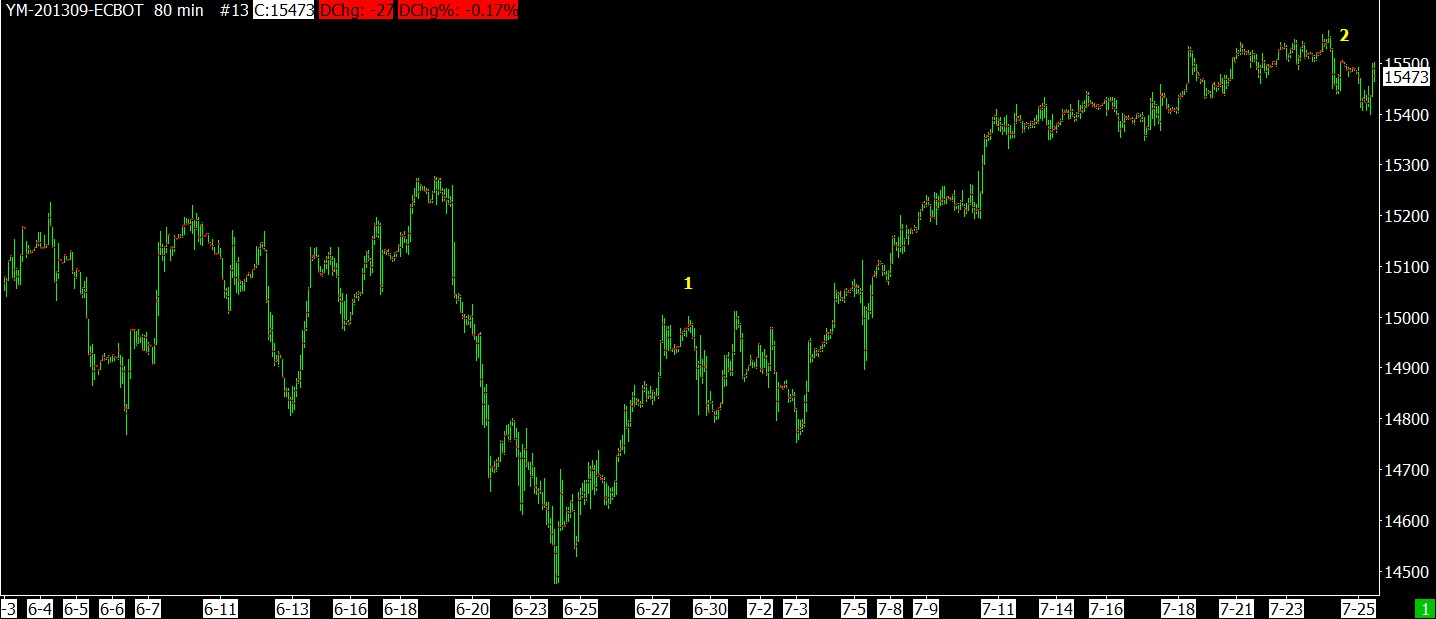
7-25-13 DOW FUTURES 80 MIN
But there could be something different going on in the NASDAQ chart. It has the “look” of a straight line rally with a present trendline break. That indicates the possibility that this index has completed the step since June 24th and is declining. But it could also mean it has 2 more steps left on the upside after it finishes its present correction. Channel breaks will tell the longer term story.
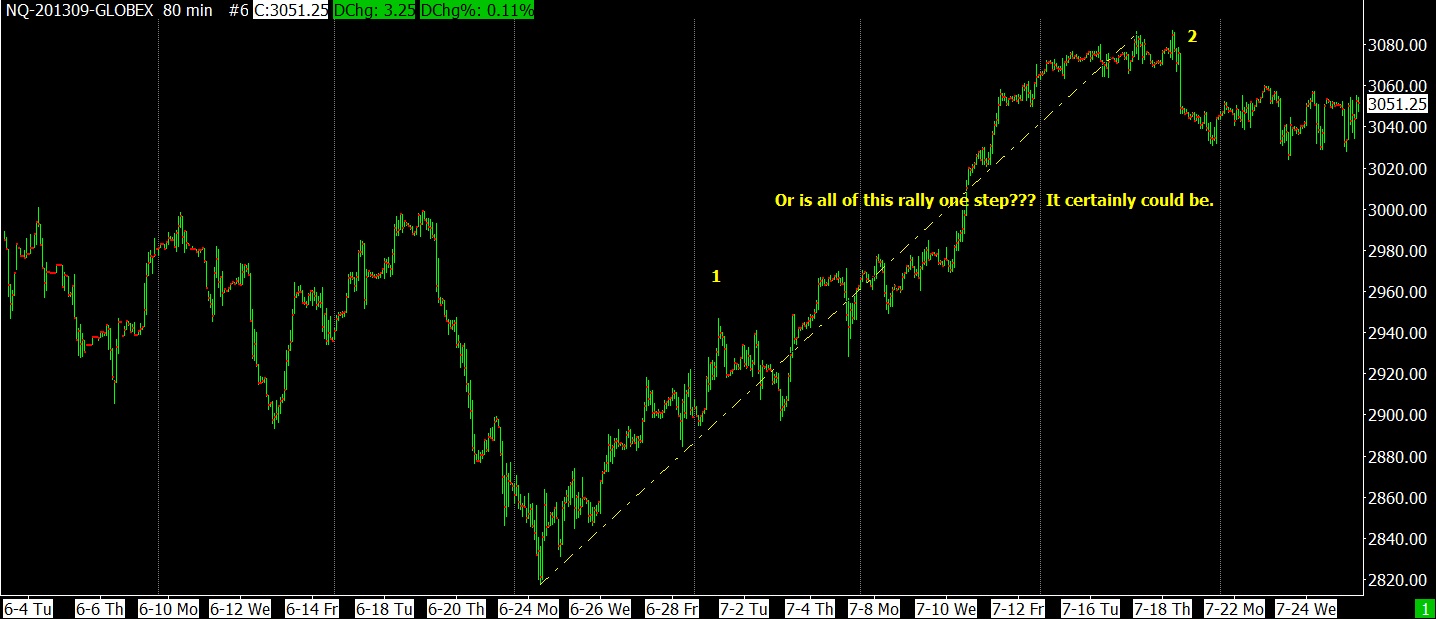
7-25-13 NASDAQ FUTURES 80 MIN
I often use the SP futures (ES) intraday charts because they form a more complete picture than the SP index (SPX). The futures trade nearly 24 hours per day and can reveal more detail than possible with the index. Presently the futures have approximately a 5 point discount to the index. Example: If a support level on the futures was 1680, you would know the same support level on the SP index should be about 1685.
The next chart is an upside Fibonacci fan that showed some good support levels on the downside. There appears to be a completed 3 step count to the downside and a rally is underway.
A question at this point is whether the rally will go to new highs or become an extension of the downside with steps 4 and 5. If the 3 count is complete, we should rally enough to at least break the “look” of the downtrend over recent days. That would put the rally in the neighborhood of the old highs. If we have only completed 2 steps up since June 24th, we should see new highs ahead.
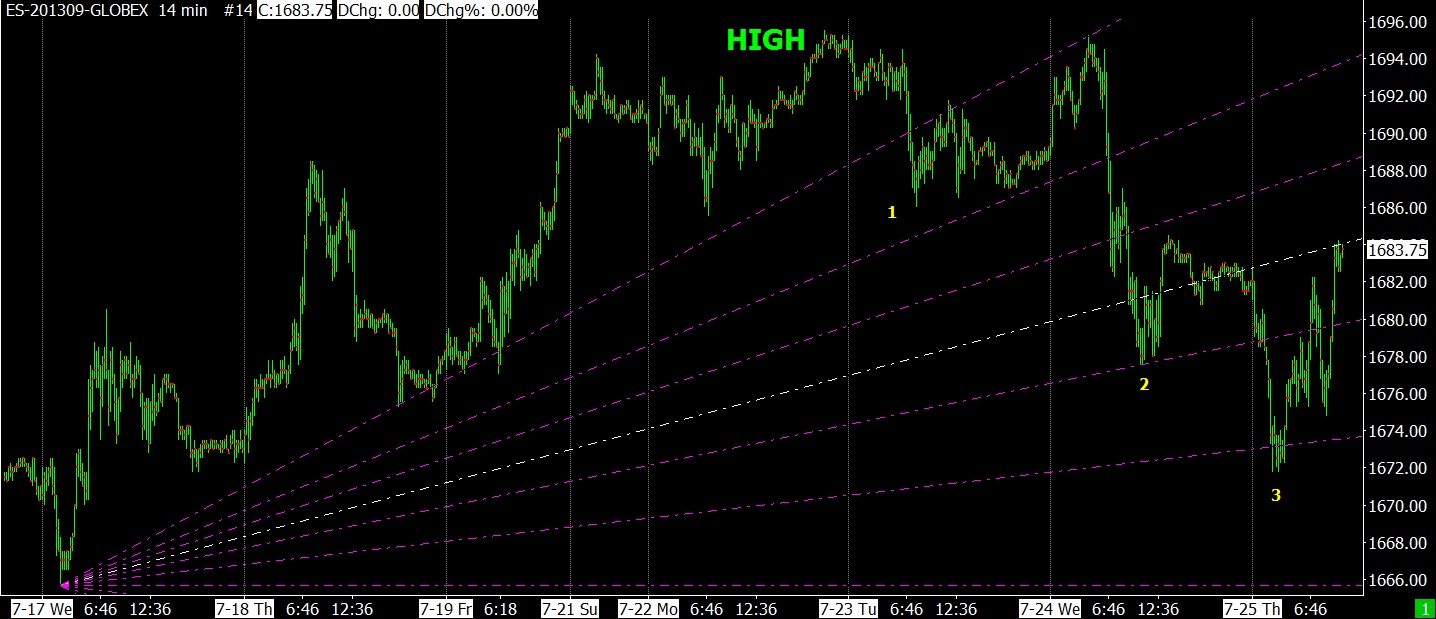
7-25-13 SP FUTURES 14 MIN
The NASDAQ futures began their present correction earlier than the Dow and SPX and traced out a 5 step decline, while the Dow and the SP had 3 step declines. The 4th and 5th steps in the NASDAQ futures did not result in lower lows.
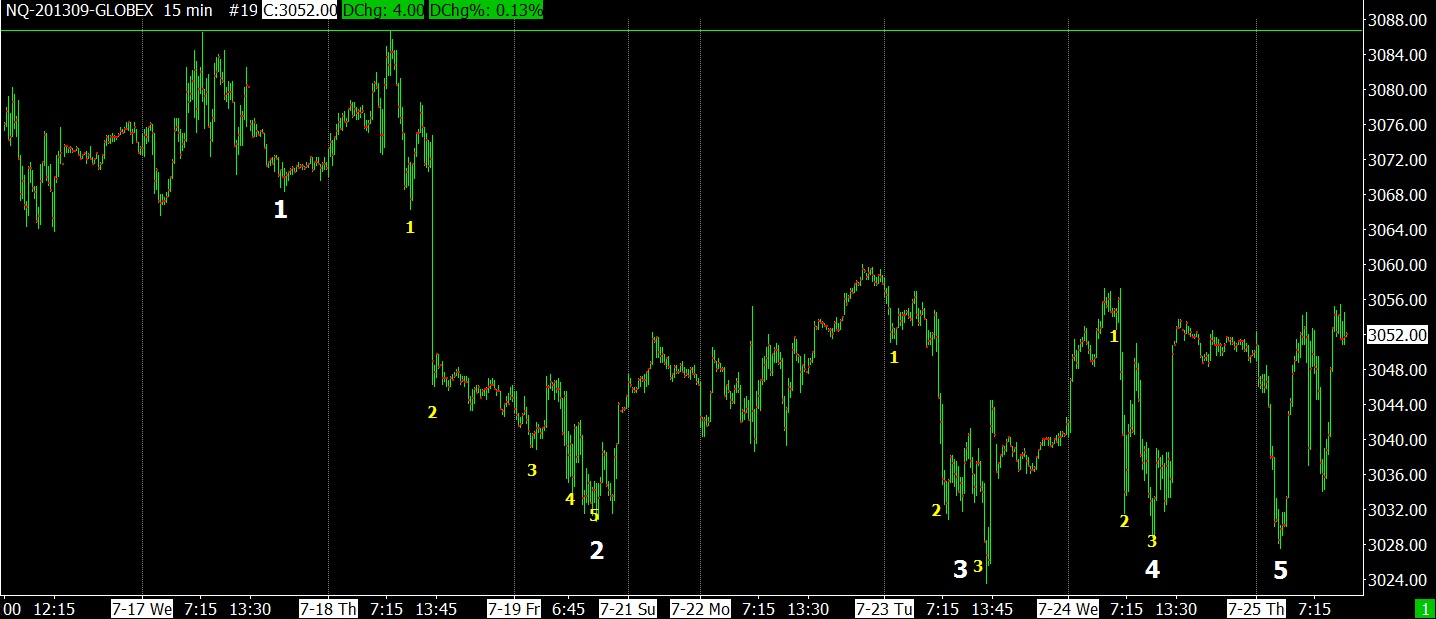
7-25-13 NASDAQ FUTURES 15 MIN
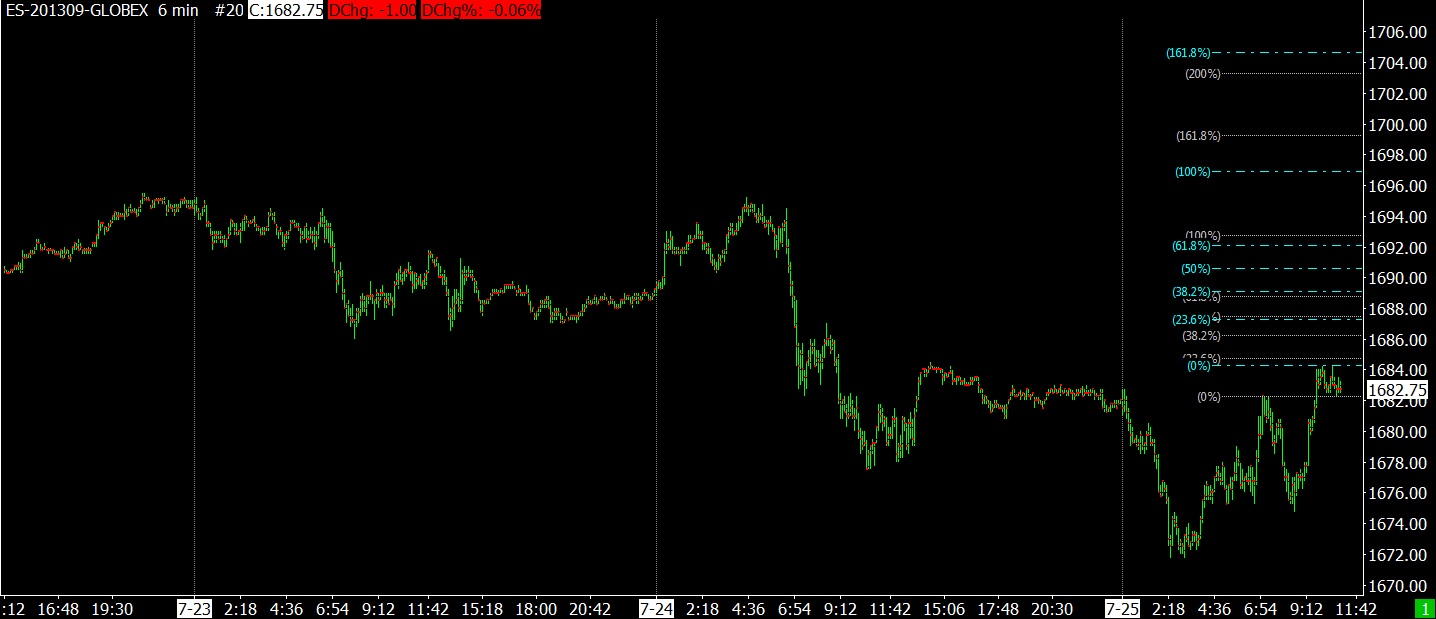
Following is a similar Fibonacci fan for the downside showing possible hesitation points on the upside.
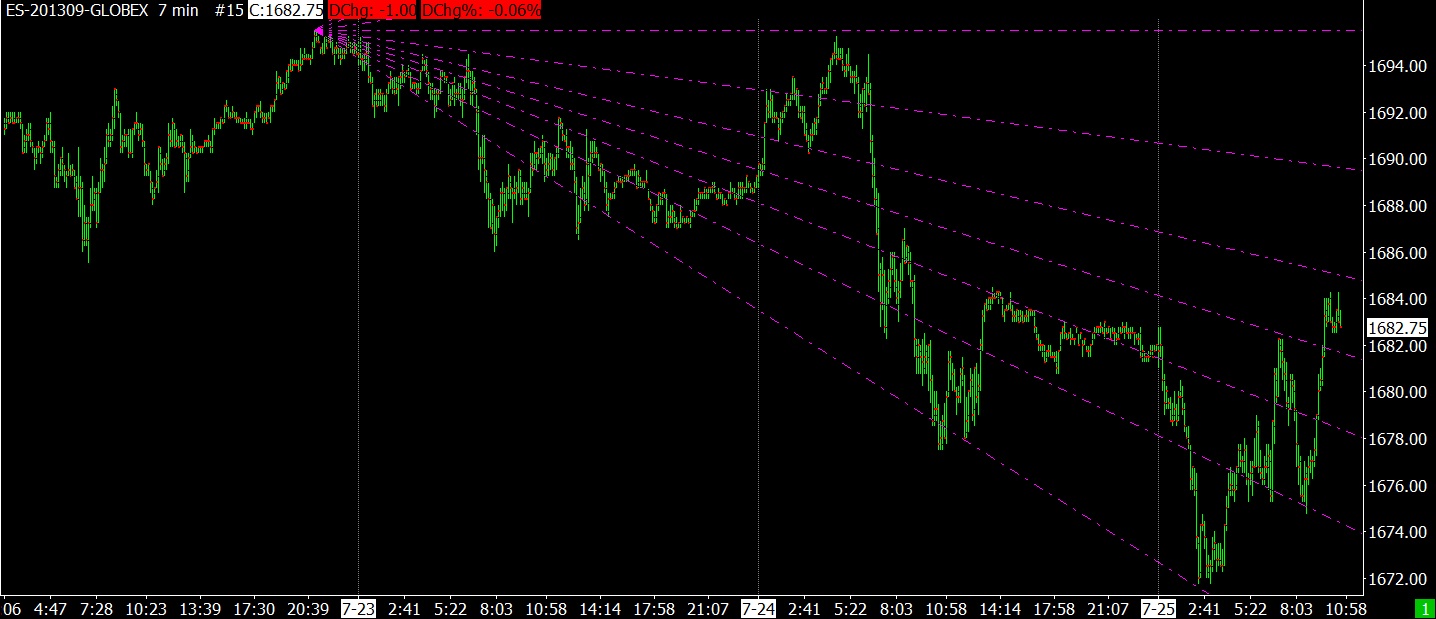
7-25-13 SP FUTURES 7 MIN
Next is a possible projection for the next rally should it have the ability to go to new highs. It is a bit early to make one of these projections, because we don’t have a meaningful rally peak since the bottom today. I have used the two rally highs that exist presently. This projection could be refined in the days ahead with a more meaningful rally peak.
7-25-13 SP FUTURES PROJECTIONS
A few months ago I discovered the relationship between the market and the index, DBV. This index is the “PowerShares DB G10 Currency Harvest Fund” and represents Deutsche Bank G10 Currency yields for the 6 lowest and 6 highest yielding euro countries. It’s a very interesting index and can be found on my charts on page two, at chart “33.5 – JUNK BOND SENTIMENT – 7 YEARS”. DBV is the last chart in that group.
In the following chart, the 1st chart is the junk bond sentiment (ratio of junk bonds to Treasury bonds), 2nd chart is the SPX, and the 3rd chart is the index DBV.
Notice how both junk bond sentiment and DBV have longer term predictive qualities. At we drew closer to the March 2009 bottom, DBV was forming a saw-tooth bottom, which can be indicative of a near term bottom (also works on tops too).
As Jeff notes in the next section, the DBV index is acting much like it did in 2007.
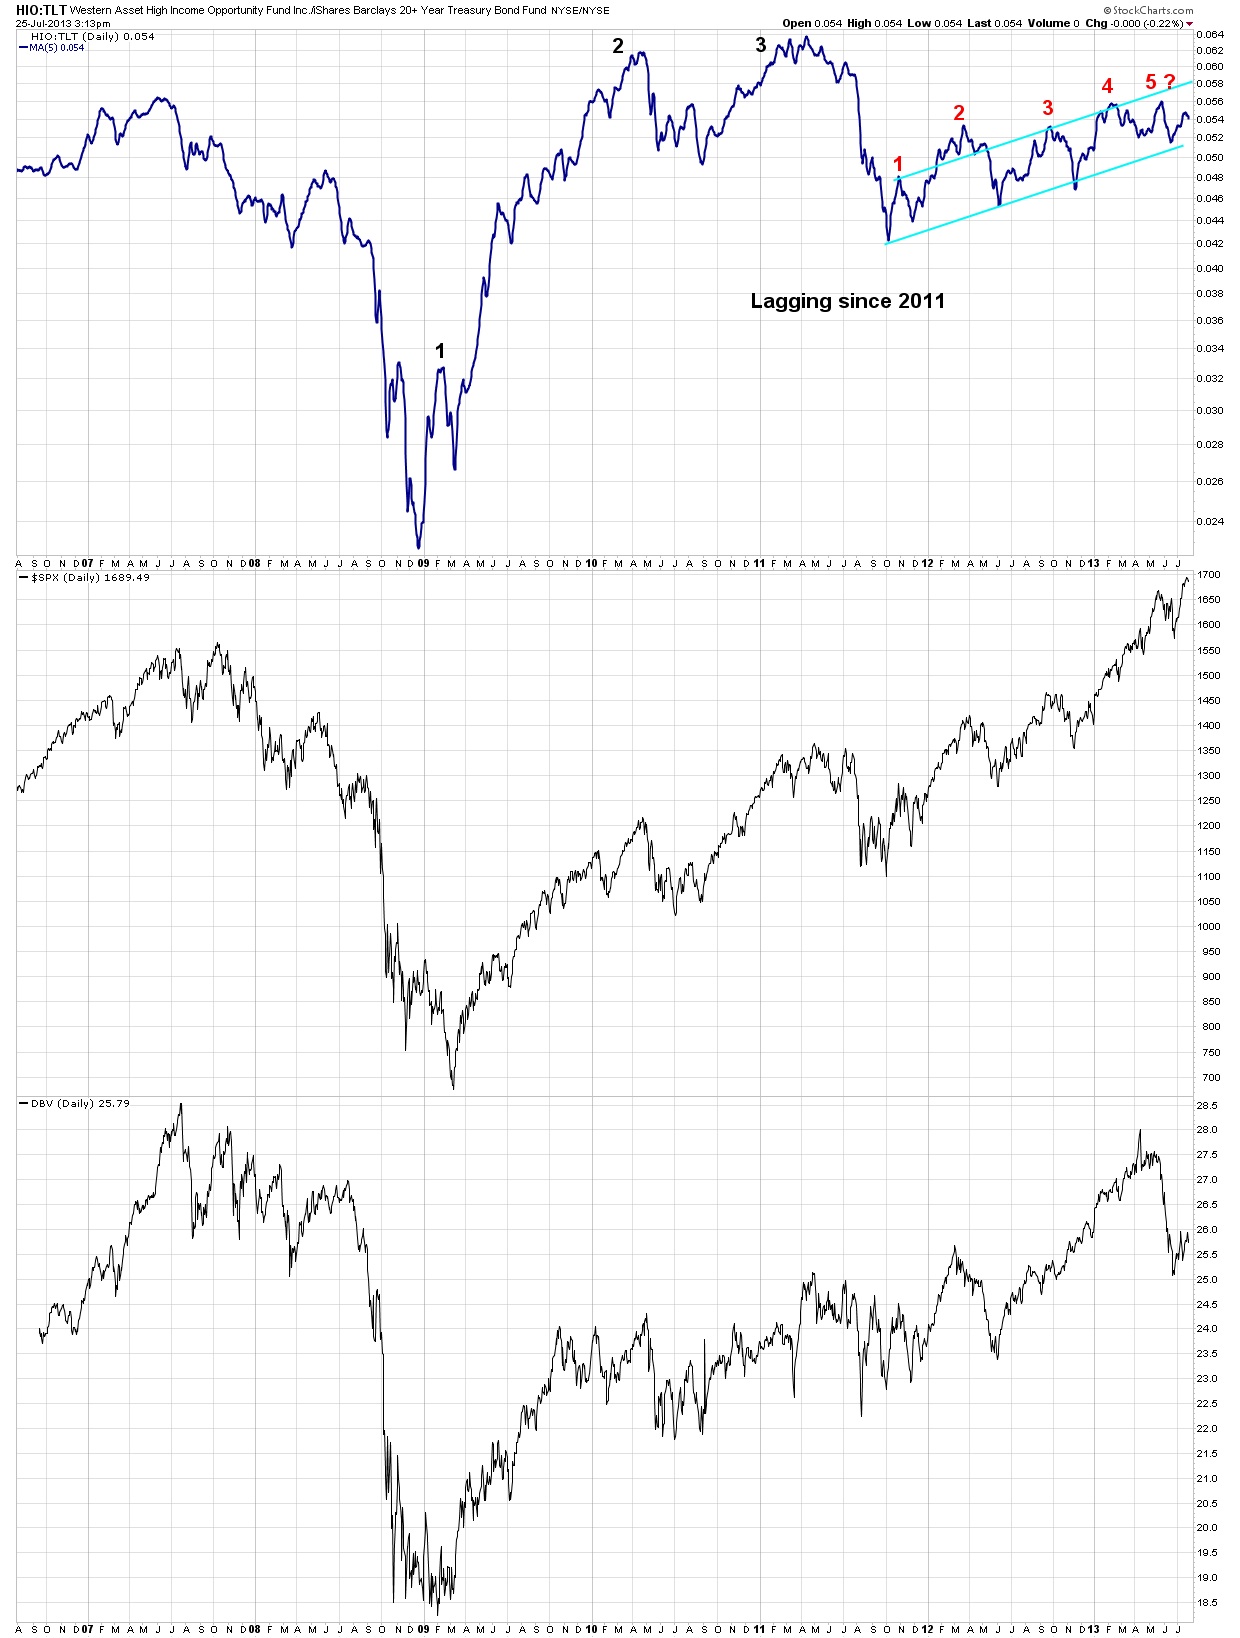
33.5 – JUNK BOND SENTIMENT – 7 YEARS
Here is a shorter term look at this index.
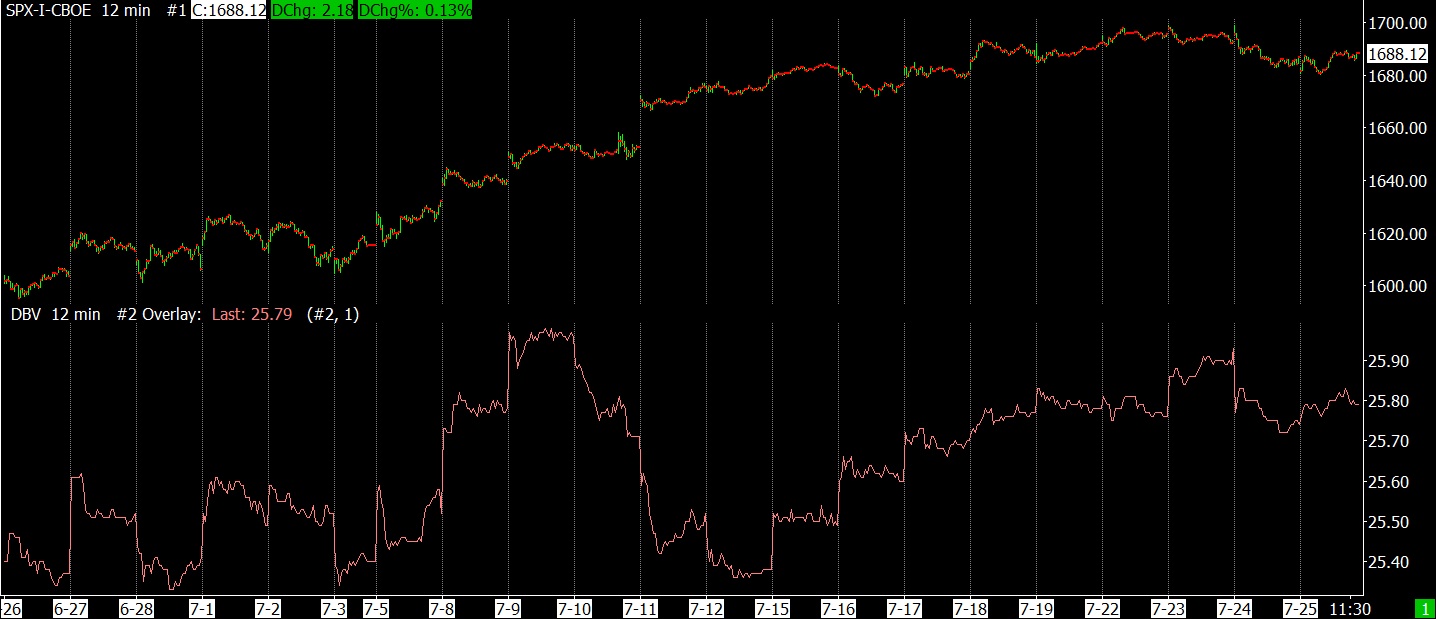
7-25-13 DBV and SPX 12 MIN
Bob’s Best Guess
I think it’s possible that we might have one more push into new high territory, but whether the rally has legs will have to be seen. One should be nimble to avoid being caught in any fake-out move to the upside. One of these days the downside will prevail, so you gotta be aware and prepared.
Perhaps the end of the ongoing rally phase will come on bad news, or it may just wear itself out. It’s pretty worn out presently.
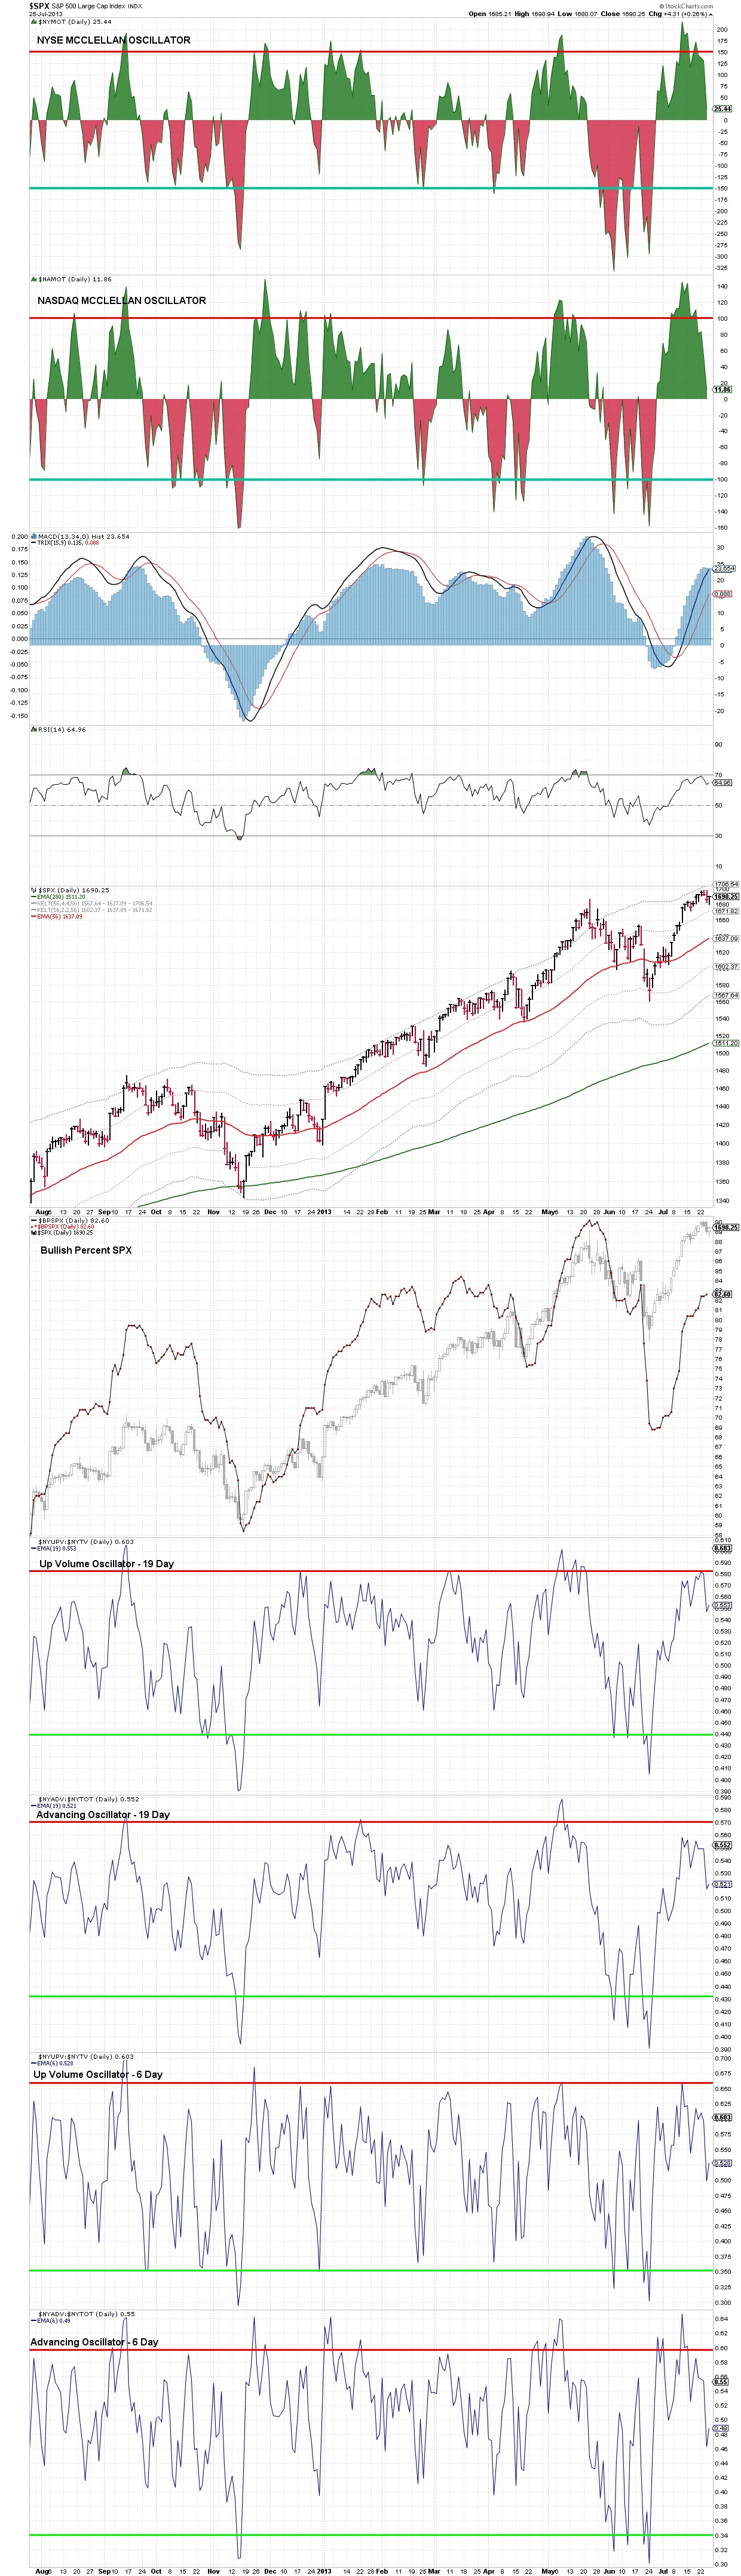
The McClellan oscillator is presently in neutral territory and could have enough power for one more gasp to the upside. The first 2 charts are the NYSE and NASDAQ McClellan oscillators. The other charts in this group are labeled.
Finally, I believe we aren’t facing a good stretch from early to mid-August (a guess) to October (maybe as late as January 2014). I suspect we are going to have a wash-out type decline, meaning it will probably be quick and vicious. If it ends as scheduled, it could be an excellent buying opportunity.
Meantime, I’m gonna wait and see how it works out in reality.
—————————————————————————————————————————————
Jeff Saut – July 25, 2013
The following are Jeff’s verbal comments for today.
Last week someone pointed out the predictive value of DBV to Jeff.
Jeffrey Saut of Raymond James is a very savvy guy and one of the few interesting people that I follow. I found Jeff years ago among the talking heads on CNBC, which is normally populated with talking heads spouting popular opinions. When I saw Jeff for the first time, he was mentioning different ideas than everyone else was regurgitating. Immediately this catches my attention because I’m ALWAYS interested in anyone that has a mind apart from Wall Street. Following the crowd will get you killed on Wall Street. After listening to him over time, I realized he was smart, insightful and normally on the mark.
Jeff reminds me of Robert Farrell of Merrill Lynch fame (1970s and 1980s), who achieved a large following being frequently on target. Bob Farrell was one of my favorites during the 70s and 80s.
—————————————————————————————————————————————
- Click on any picture or chart to enlarge it
Leave me a comment or question just a few inches below here. If it says “Comment”, click on the comment and you’ll see “Leave A Reply”.
All Rights Reserved © ™
Explore posts in the same categories: JEFF SAUT, UPDATE, WAVE COUNT
July 26, 2013 at 1:20 PM
I suppose anything is possible, but it would be surprising to see DB fold up and disappear. Certainly something like a DB crisis could precipitate a falling stock market in the USA.
DBV is like TLT, an interest rate index with a representative ETF. The PowerShare ETF index is based on a Deutsche Bank interest rate product. The index consists of the 6 highest and 6 lowest yielding euro countries interest rates.
LikeLike
July 26, 2013 at 11:29 AM
Haven’t thought about it.
LikeLike
July 26, 2013 at 10:52 AM
Interesting tweets from this guy about DB–
Max Keiser @maxkeiser 24 Jul
My Geneva fund contact: Deutsche Bank is officially on suicide watch. DB will be the next ‘Lehman’ moment that triggers new collapse.
Max Keiser @maxkeiser 24 Jul
Deutsche Bank is a huge German government slush fund (like JP Morgan in U.S.) where collapse of Portugal is about to trigger global crisis.
LikeLike
July 26, 2013 at 8:34 AM
Bob what are your thoughts about the last decline of the SPX of about 8 percent and TLT kept going down? I think this is the first time since 2000 that we had a meaningful decline and bonds did not react positively?
LikeLike
July 26, 2013 at 4:53 AM
At the best 2 months and at the outside edges, 5.5 months, til early to mid-January.
Bob
LikeLike
July 26, 2013 at 1:48 AM
So basically you are looking for a 2 month decline?
LikeLike
July 25, 2013 at 11:29 PM
Hi,
When I see a change coming, I need to write about it to get things straight in my own mind. Nothing does this better than putting my ideas down in the blog.
I’ve been thinking for awhile that the pot was boiling too fast and a change had to take place. I don’t know if we’ve already peaked or another uptick is coming, but the 4th quarter is going to have some fireworks.
I wonder how many people are aware that a 55 month cycle is “projected” to bottom in October. This is the same cycle that bottomed in March 2009, so it’s meaningful. But even longer cycles than the 55 month cycle bottomed in March 2009, so I don’t want to give the impression that it will be as significant this time around.
It’s going to get interesting soon. Maybe mid-August at the latest for a last gasp peak.
Bob
LikeLike
July 25, 2013 at 10:29 PM
Thanks Bob -looking forward to the more frequent up dates.
LikeLike