07/23/13 – DOW THEORY SIGNALS Plus Warnings & Confirmations

MARKET MESSAGES
7/23/13 . . .
Just a little clarification of my Dow Theory charts.
Here is my interpretation of the Dow Theory Signals since the 2007 peak. You can find the following charts on My Charts, first page.
Please read the notes on both of these charts.
The following chart contains actionable signals. A DJ Theory buy signal has been in force since November 2011.
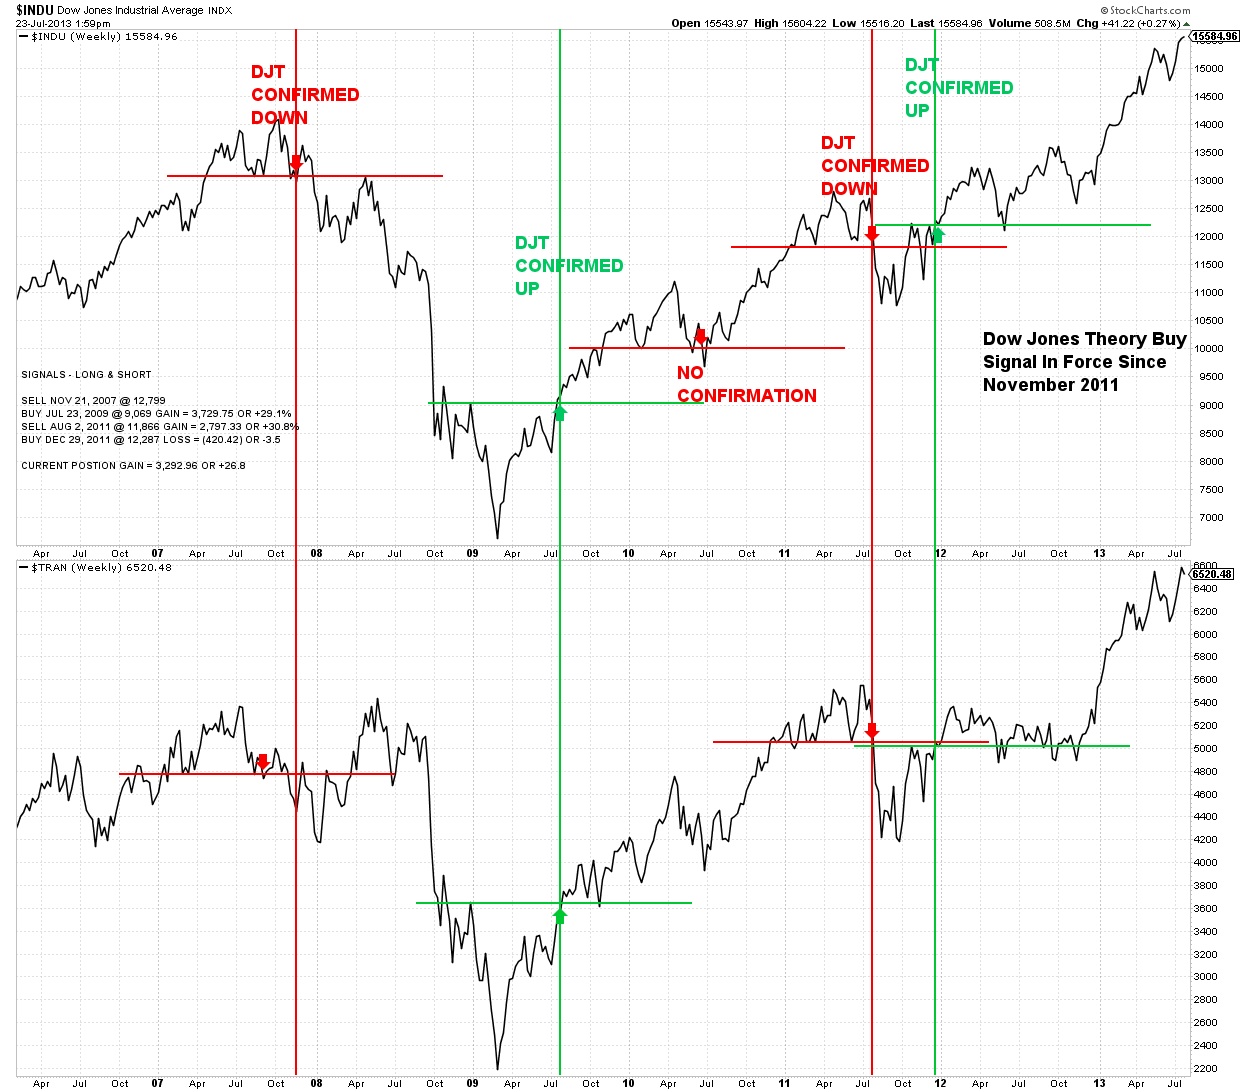
DOW THEORY SIGNALS
The next chart does NOT contain actionable signals. Risk is a major component in these signals/warnings.
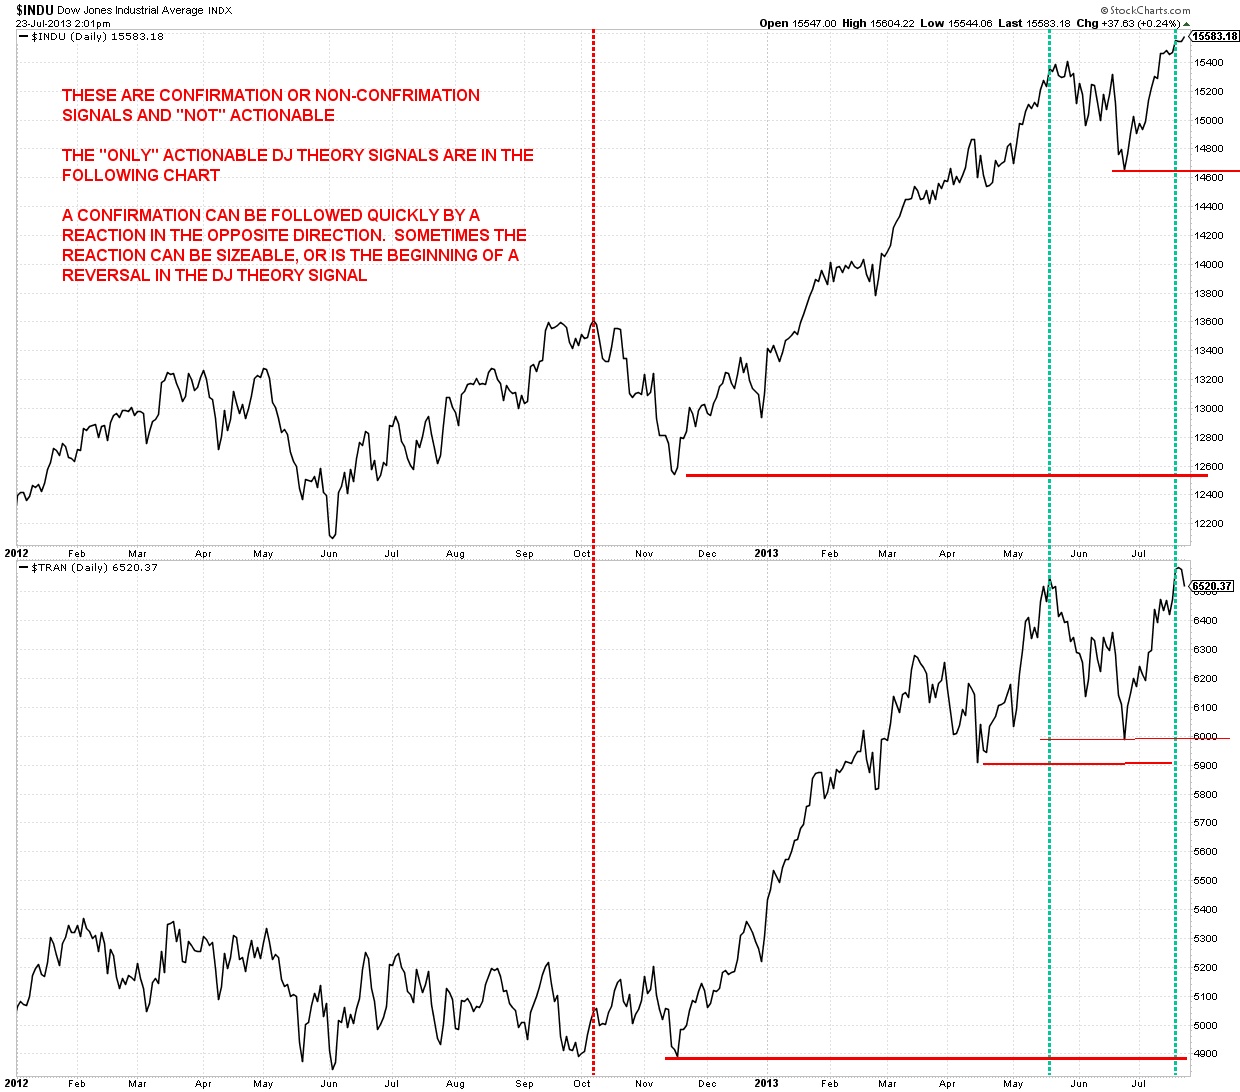
DJ THEORY CONFIRMATION & WARNINGS
Jeff Saut said the following on October 31, 2011:
That upside breakout came after both indices made new closing reaction lows on October 3, 2011; hence, the “buy signal” seems valid. This means the Dow Theory “sell signal” of August 4, 2011 should prove to be a false signal, as we have repeatedly opined for nearly two months. Of course, the longest keeper of Dow Theory, namely Richard Russell, has stated that there never was a sell-signal since he is using the July 2010 reaction lows of 9686.48 and 3906.23 to get a sell-signal, while I used this year’s closing lows of March 16. If one follows Richard’s method it implies that he probably didn’t get a Dow Theory “buy signal” either since he likely would need both averages to travel above their respective 2011 reaction highs of 12810.54 and 5618.25. Recall, it was an upside nonconfirmation from the Industrials, which failed to confirm the Tranny’s new all-time high of July 7, 2011 at 5618.25, that lead to the ensuing ~17% decline for the senior index. Let’s hope it doesn’t play that way again.
The 2011 Dow Theory sell was false and it was quickly reversed. (see first chart)
The Dow Theory is a little crude, but it can be very effective over time.
Following is a DJ Theory spreadsheet for the same period.
More coming later, but not today.
—————————————————————————————————————————————
- Click on any picture or chart to enlarge it
Leave me a comment or question just a few inches below here. If it says “Comment”, click on the comment and you’ll see “Leave A Reply”.
All Rights Reserved © ™
Explore posts in the same categories: JEFF SAUT, UPDATE
July 24, 2013 at 10:21 AM
I’m in the process of adding to the Dow Theory signals on my charts (adding signals beginning in 1999, perhaps later dates will be added). I will amend my Dow Theory blog made yesterday with the new data.
We certainly have a break in the step count today. This could easily be the end of the rally since Nov 2012. It needs a little more on the downside to confirm this.
In addition, today we had a reversal day. We had a new all-time intraday high and then closing at a loss. Closing at a loss seems to be a sure thing for today. So far it’s not on the same scale as the May 22nd reversal day but the day is not over. The narrow range from yesterday made perfect conditions for a break down today. Narrow ranges are great setups for breakouts.
Bob
LikeLike
July 24, 2013 at 9:39 AM
Thanks a lot Bob. This is fantastic information.
LikeLike