07/19/13 – Rising Quickly To 1700 (or higher ???)

MARKET MESSAGES
7/19/13 . . .
The market is overbought, but that doesn’t mean we can’t have more rally before a significant correction begins. The best rallies always take place with overbought markets.
The following chart is a good example of the market’s overbought condition. If you count the significant McClellan Oscillator corrections since the November 2012 bottom, the next one will be correction number 5.
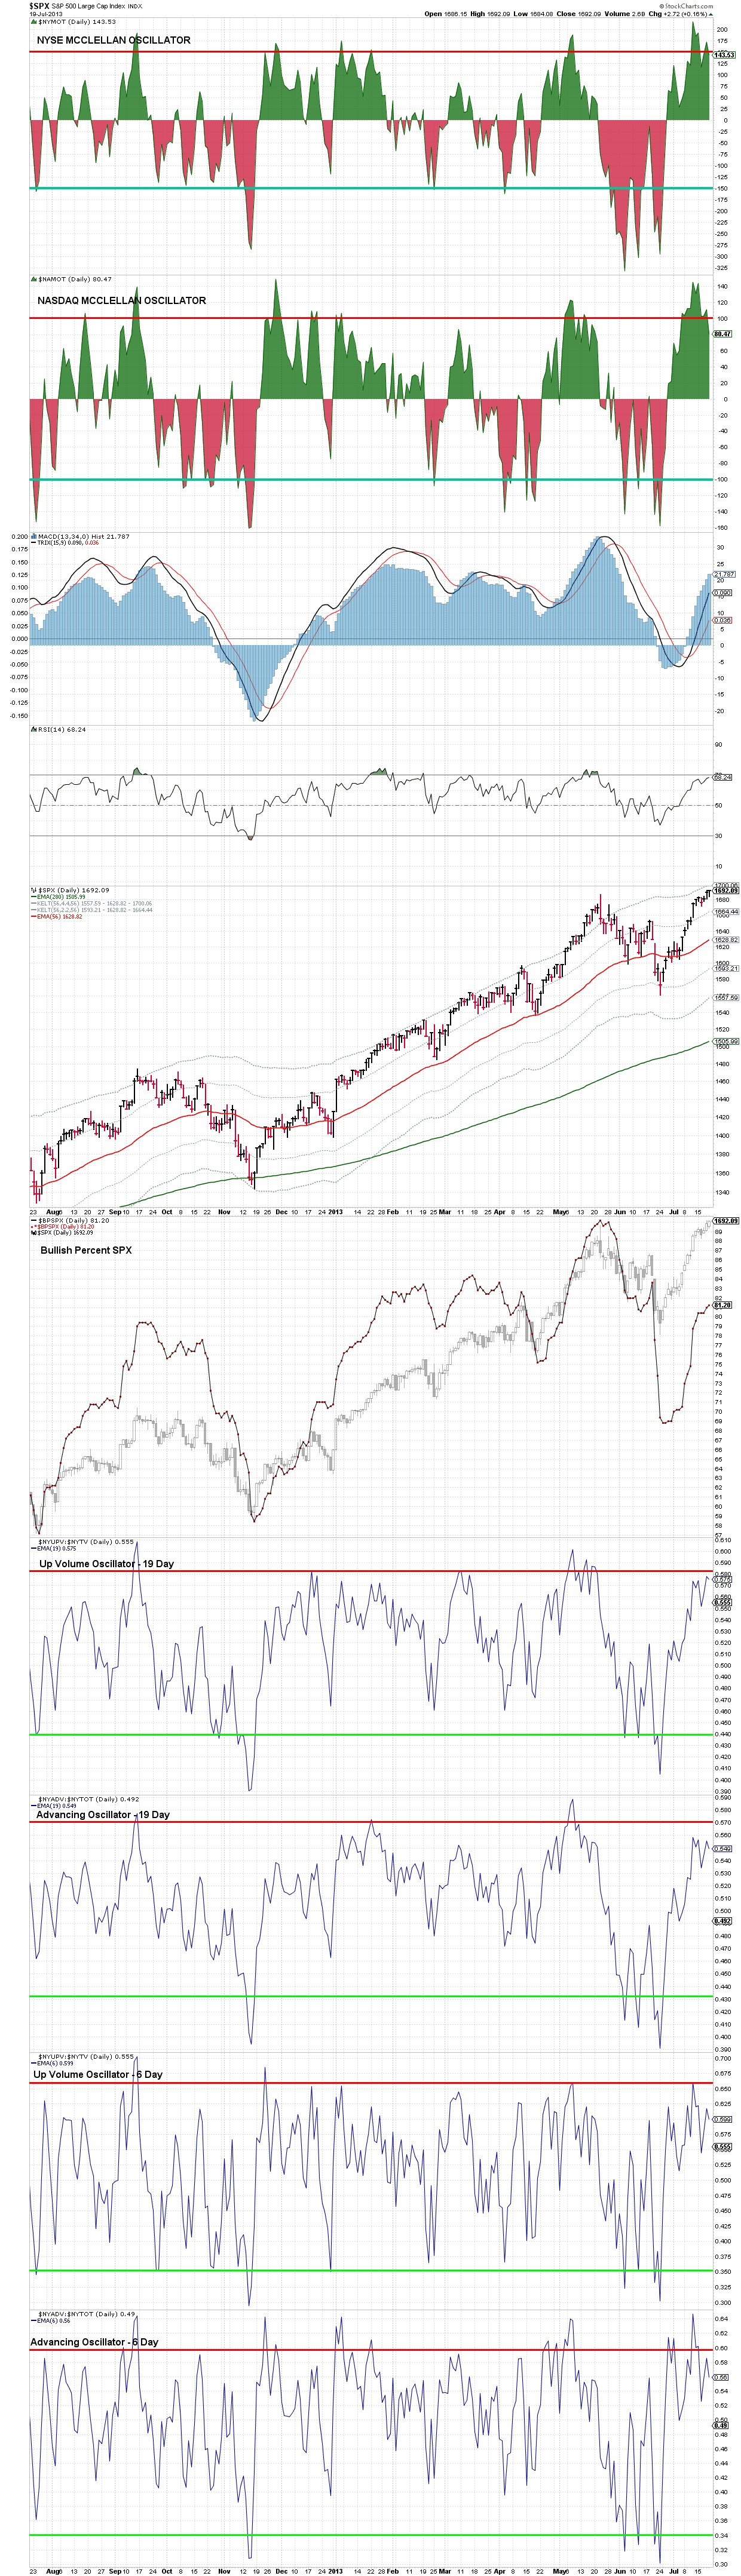
07-19-13 OSCILLATORS DAILY
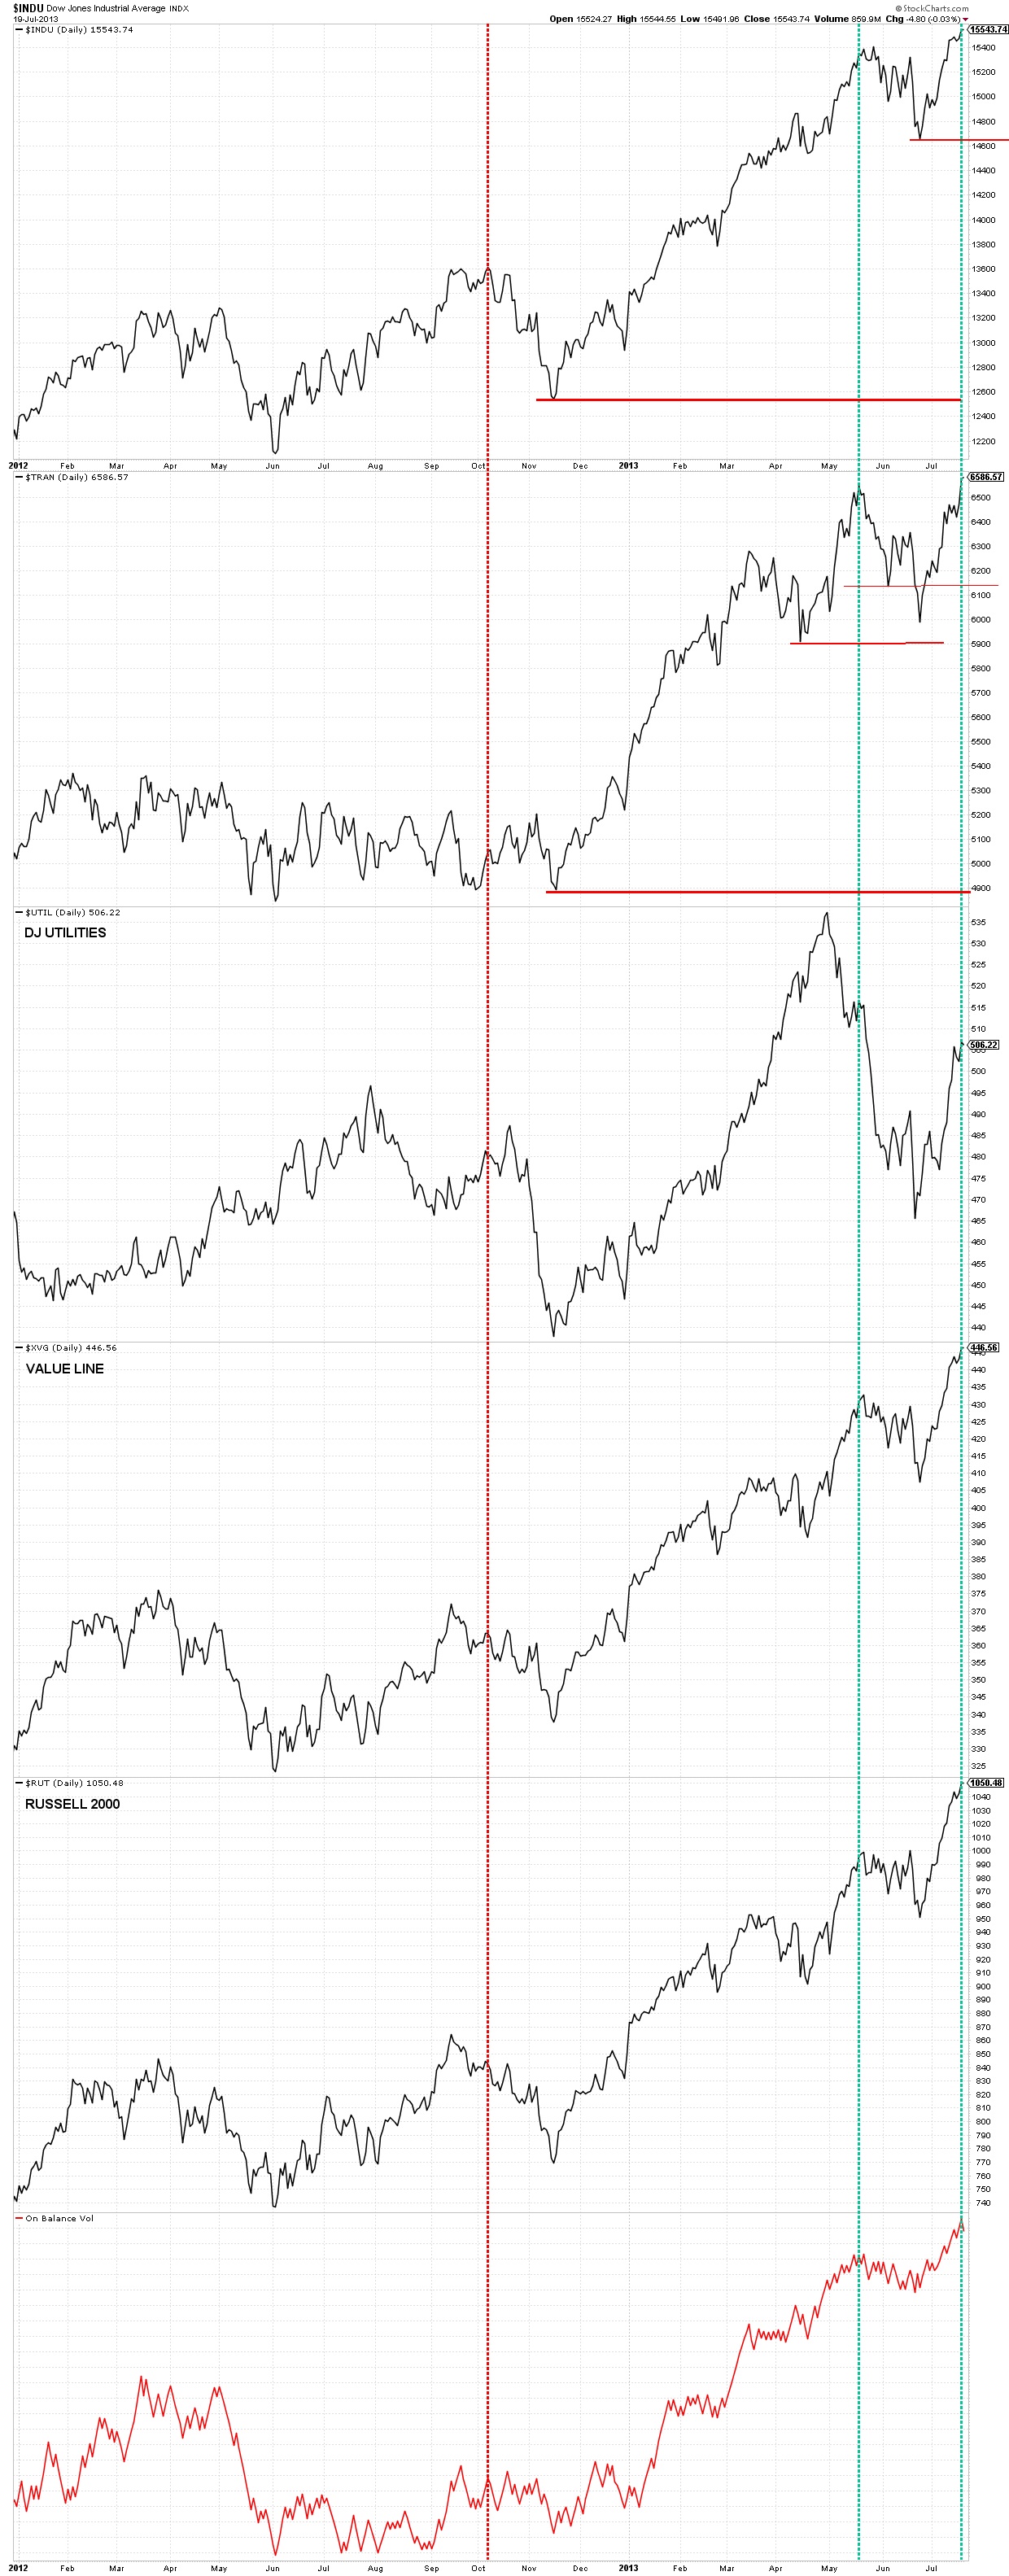
We had a renewed Dow Theory signal this week when both the Industrials and Transports moved to new highs.
Just because we have a confirmed Dow Theory signal doesn’t mean a significant correction can’t take place. The following PDF file from Maggee and Edwards’ book illustrates the Dow Theory record over the last 120 years. The signals illustrated do not include new confirmations in Dow Theory. They show beginning and ending signals only. Overall the Dow Theory has a good record for long bull market moves, but the following table shows the theory’s short comings. The November 2007 sell signal was a great call, plus it gave a buy signal in the 3rd quarter of 2009. In retrospect, these were two great signals.
The Dow Theory in the 20th and 21st Centuries
Maggee and Edwards book is recommended reading. The latest 10th edition is not cheap ($60), but you can buy an older electronic edition (9th edition) for $13.74 on Amazon. The Kindle edition can also be read on your Mac or PC by downloading the appropriate software from Amazon. This book was originally written in 1948 and the first edition is still appropriate in today’s markets.
07-19-13 DOW THEORY
I’ve said before this is an Energizer Bunny market, it just keeps going and going and going and . . .
When the rally stops, there will be a correction of significance (duhhhh, what a brilliant statement), but it may not signal the end of the bull market. We’ll see about that later when it’s pertinent.
Earlier Friday we finished a mild correction that began Thursday morning. This correction began with disappointing earnings from Google and Microsoft. But late Friday, the SPX futures closed at new all-time highs.
Below is a very short term chart with some projection lines using Fibonacci relationships that are based on prior peaks and bottoms. Any of these Fibonacci levels can be a reversal point in the market.
The futures peaked and stopped Friday at 1690, which is one of the Fibonacci projection lines (61.8%).
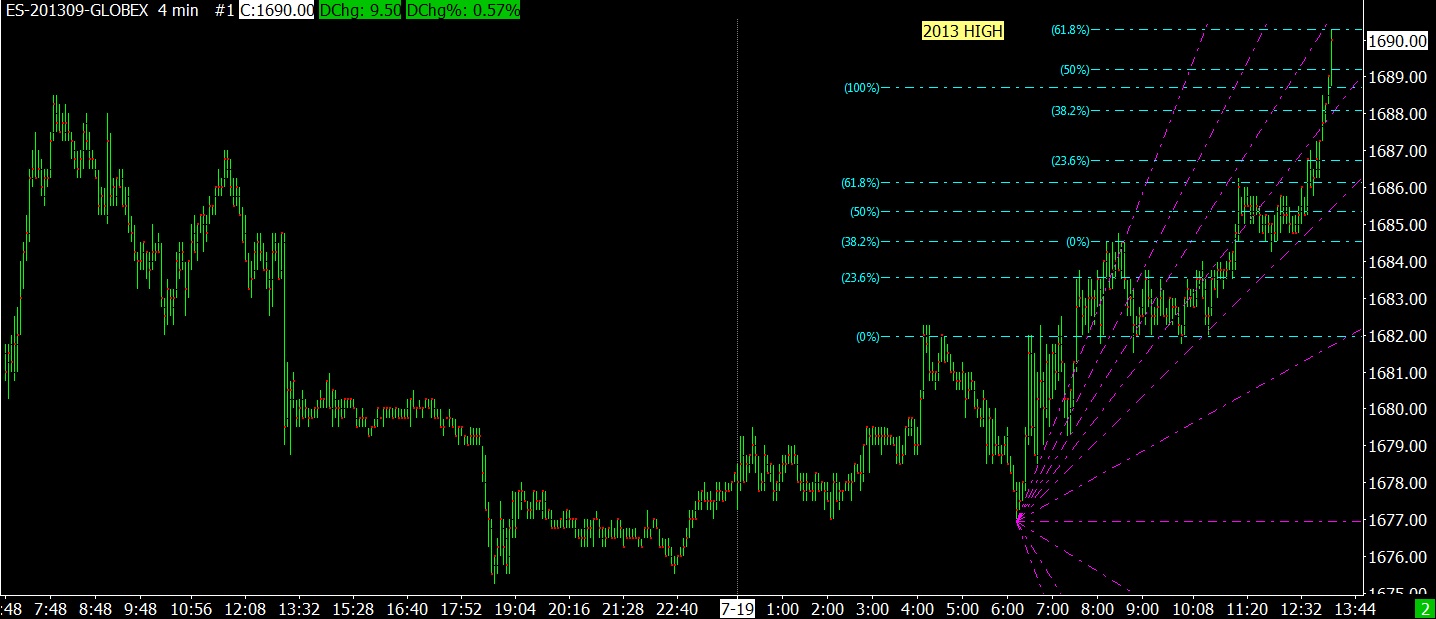
07-19-13 SPX FUTURES 4 MINUTE
The next chart is the same as above, but the vertical scale has been moved higher so you can see the near term projections.
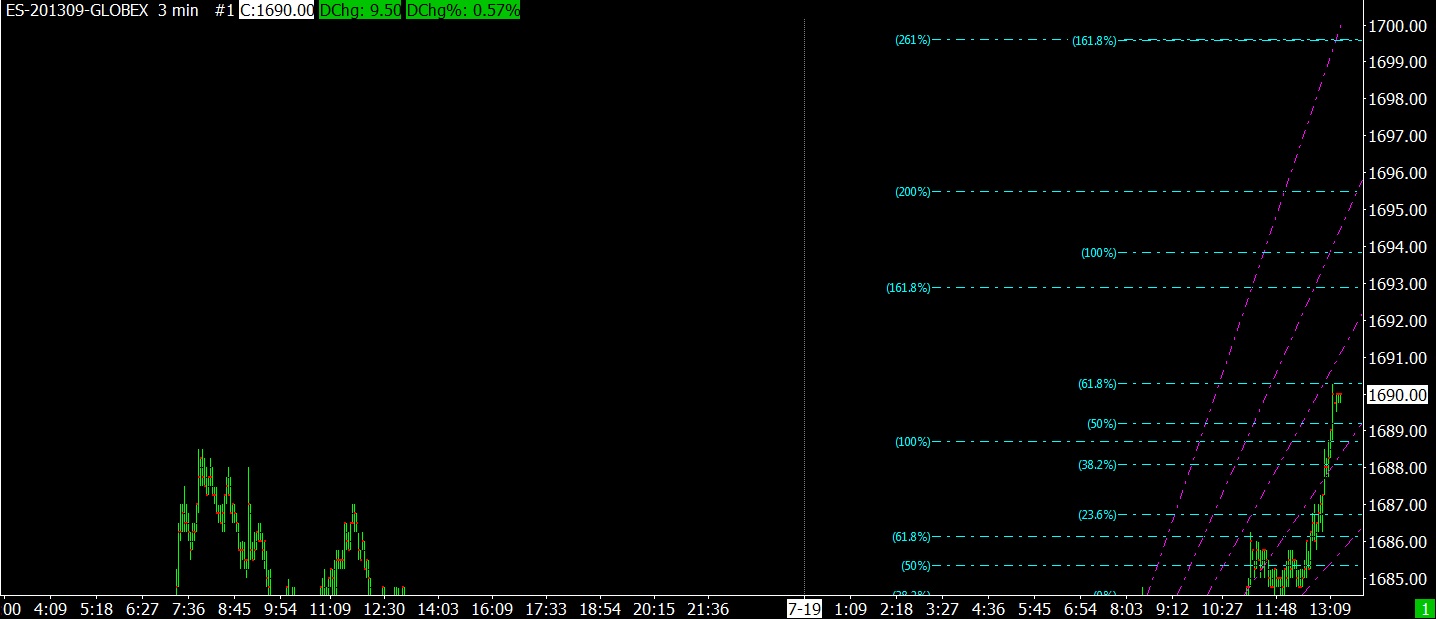
07-19-13 SPX FUTURES 3 MINUTE
There is a 261% projection line and a 161% projection line with both of them residing at the 1700 SPX level. This is obviously a reenforced Fibonacci level where two different peaks and bottoms have provided the same reversal point.
There is another projection line (200%) at 1703. The last projection based on this very short term chart is a line at 1709 (261%).
1700 to 1709 is 10 to 19 SPX points higher than Friday’s close.
If emotions continue we are going to the 1700 SPX level that Jeff Saut spoke about in his earlier comments (unless something unusual happens over the weekend). Jeff had mentioned that he expected a blue heat blow-off to this rally and that could be on tap.
Earlier Friday, the SPX futures were trading with a 5 point discount to the SPX index. That’s a normal discount at this point of the contracts life. Instead of a 5 point discount, the futures closed with a 38 cent premium. High expectations or option expiration created that premium at the close Friday. It’s not unusual for the SPX futures to close with a smaller discount on Friday during a market rally. I saw a similar situation on the prior Friday (July 12th), but Friday was an exaggerated move for the discount/premium.
Apple reports their earnings after the close on Tuesday and they probably will be lack luster. This could have a temporary dampening effect on the market. But since the expectations are for blah earnings, there may be a muted move to the downside. These earnings should be already discounted in Apple’s price. Of course if Apple were to surprise with earnings to the upside, there could be real upside fireworks. Since I said blah earnings were already priced into the stock, that doesn’t mean Apple won’t sell off significantly. Emotions can get crazy sometimes and institutions are real herding animals.
Apple has made a bottom at 385 and is holding. Notice that low is almost exactly at a long term Fibonacci level. It will be interesting to see if that level holds after earnings are released (minor penetrations don’t count). If 385 holds, maybe Apple has finished its long decline from $708. The count certainly looks right. The is a correction of 45.6% from the peak.
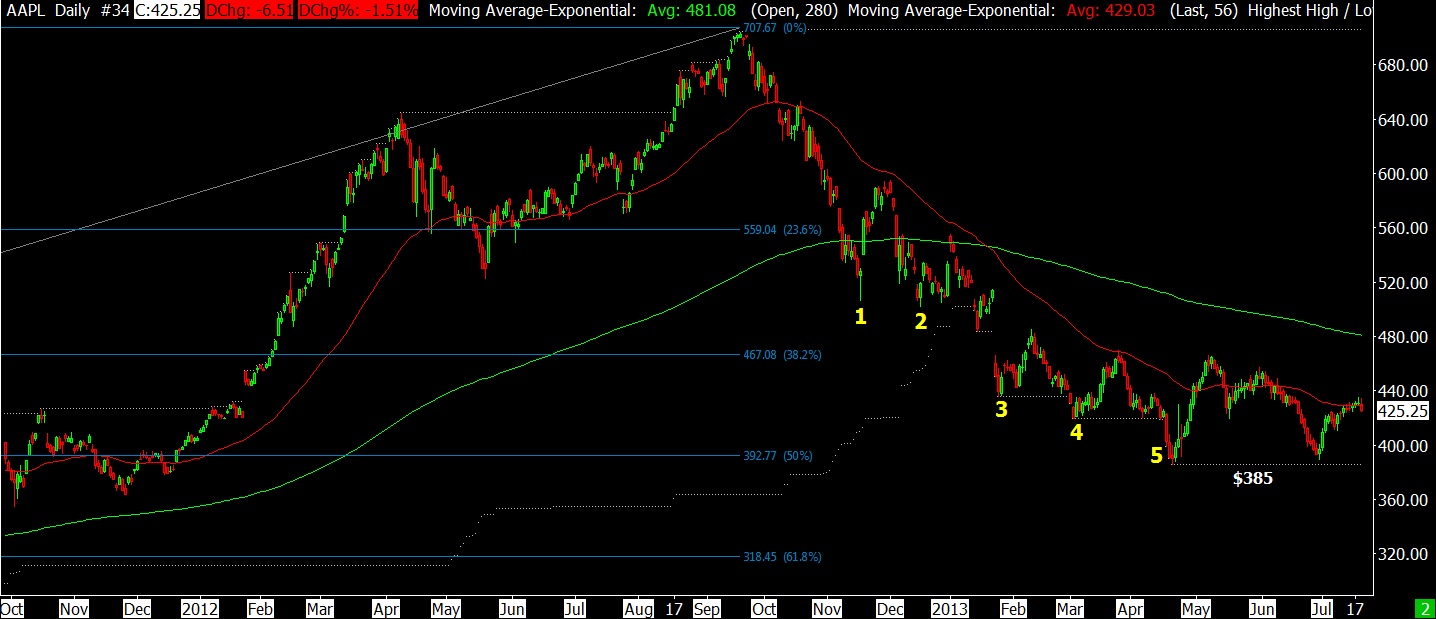
07-19-13 APPLE DAILY
The next chart show a monthly chart for Apple since 1985.
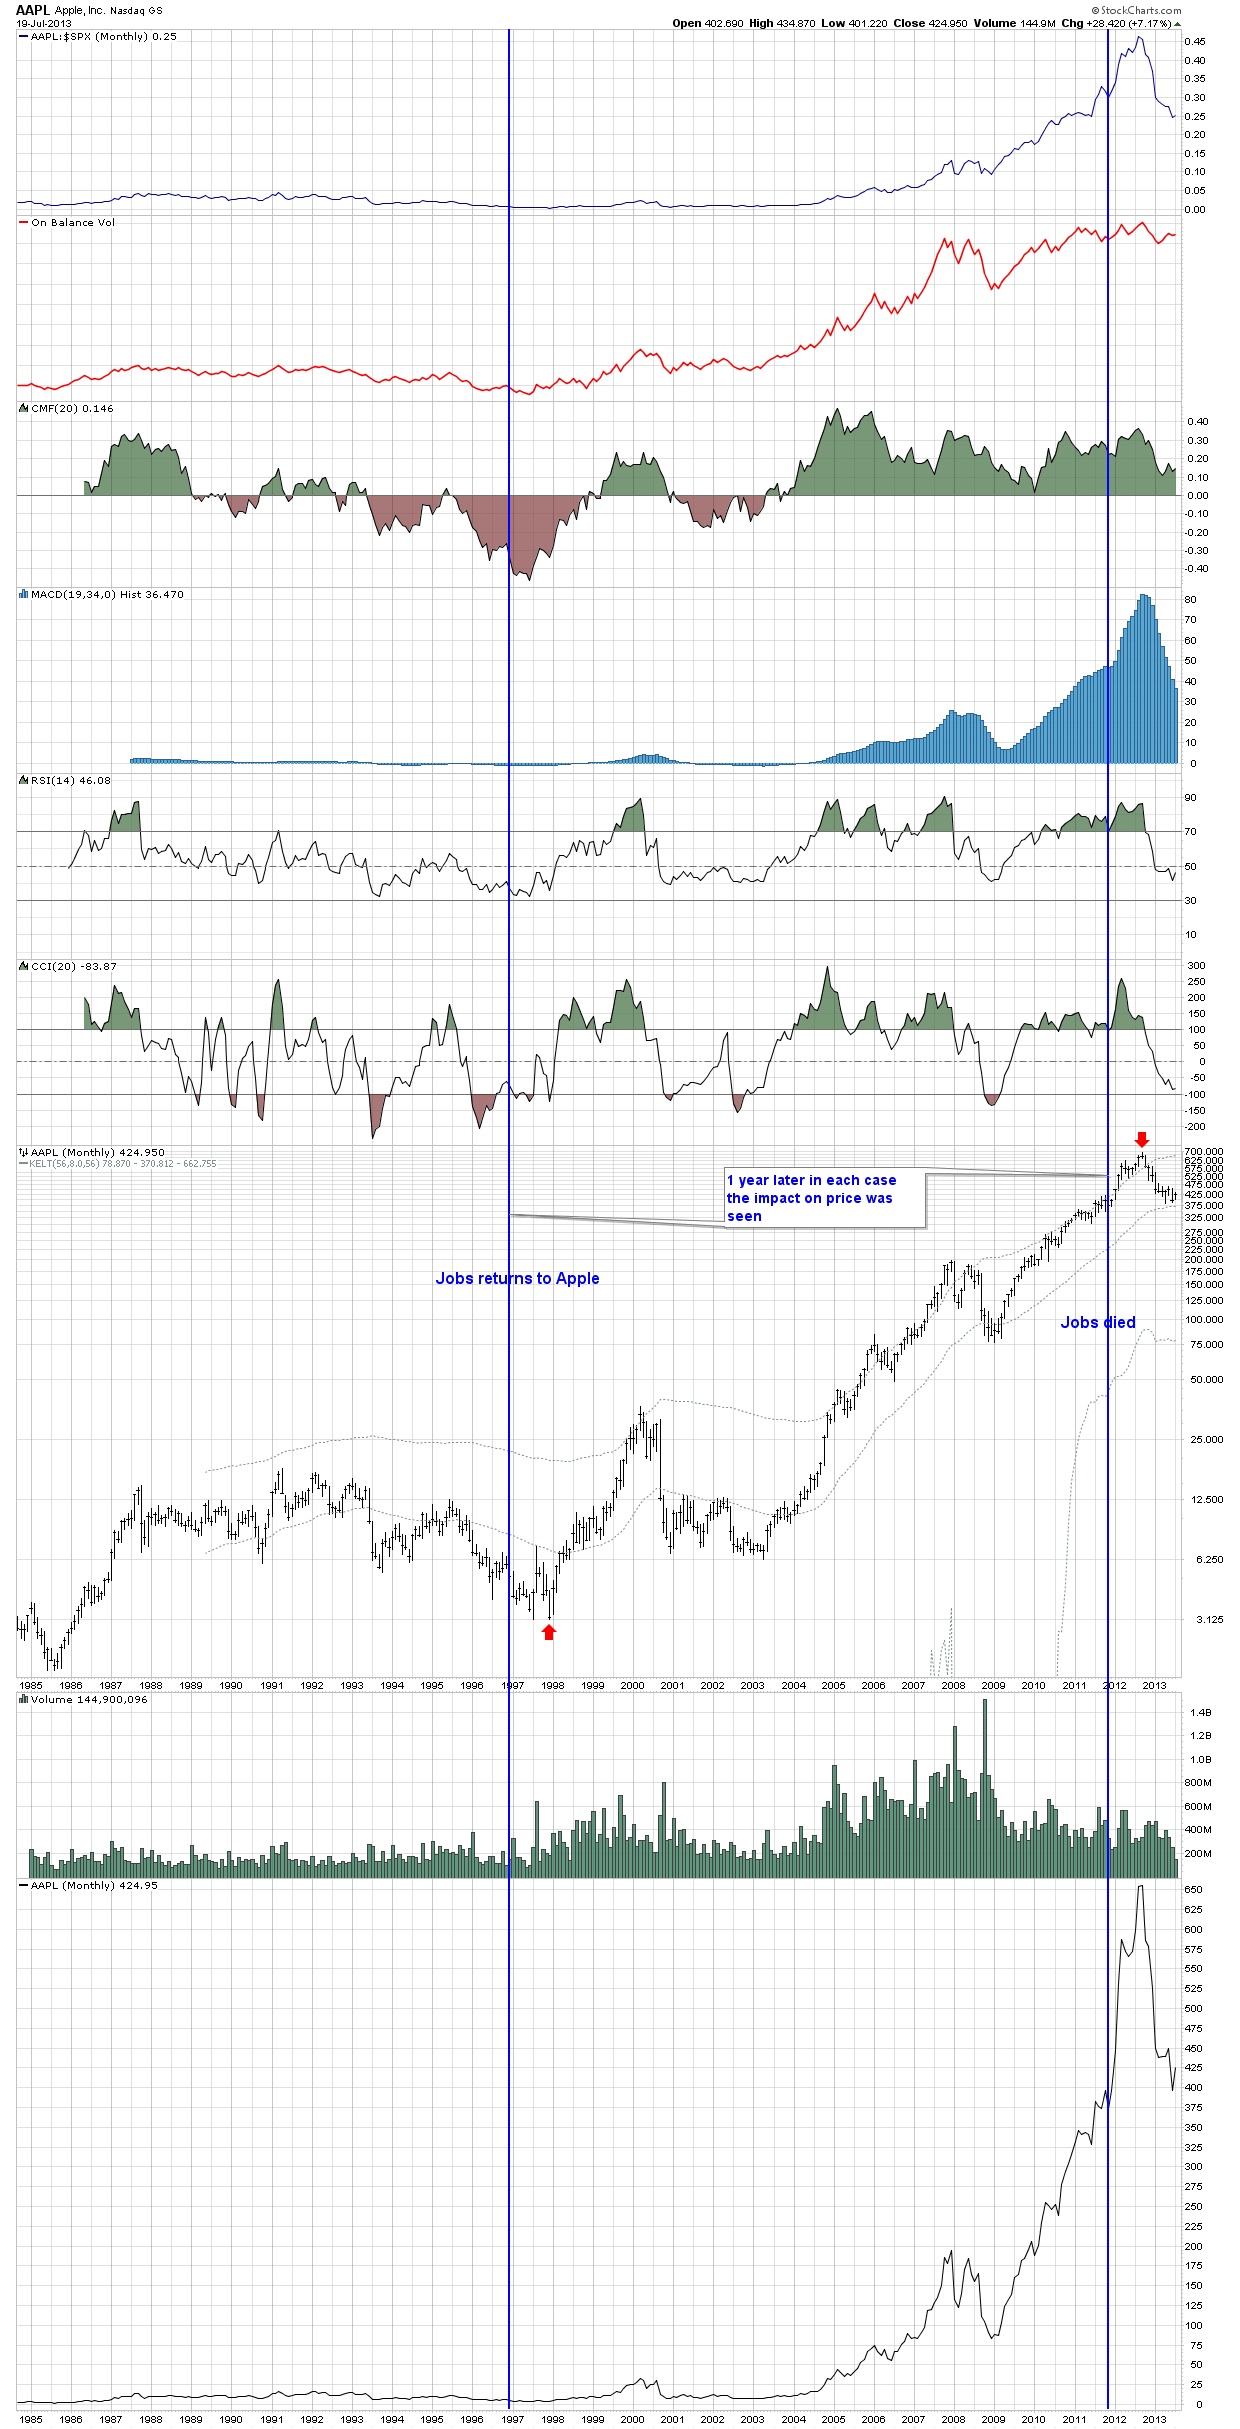
07-19-13 APPLE MONTHLY
The following chart shows how the recent rally in SPX (SP 500) has had very little corrective action since the June 24th bottom. The upward angle on the rally since June 24th is much steeper than the rally that began in November 2012.
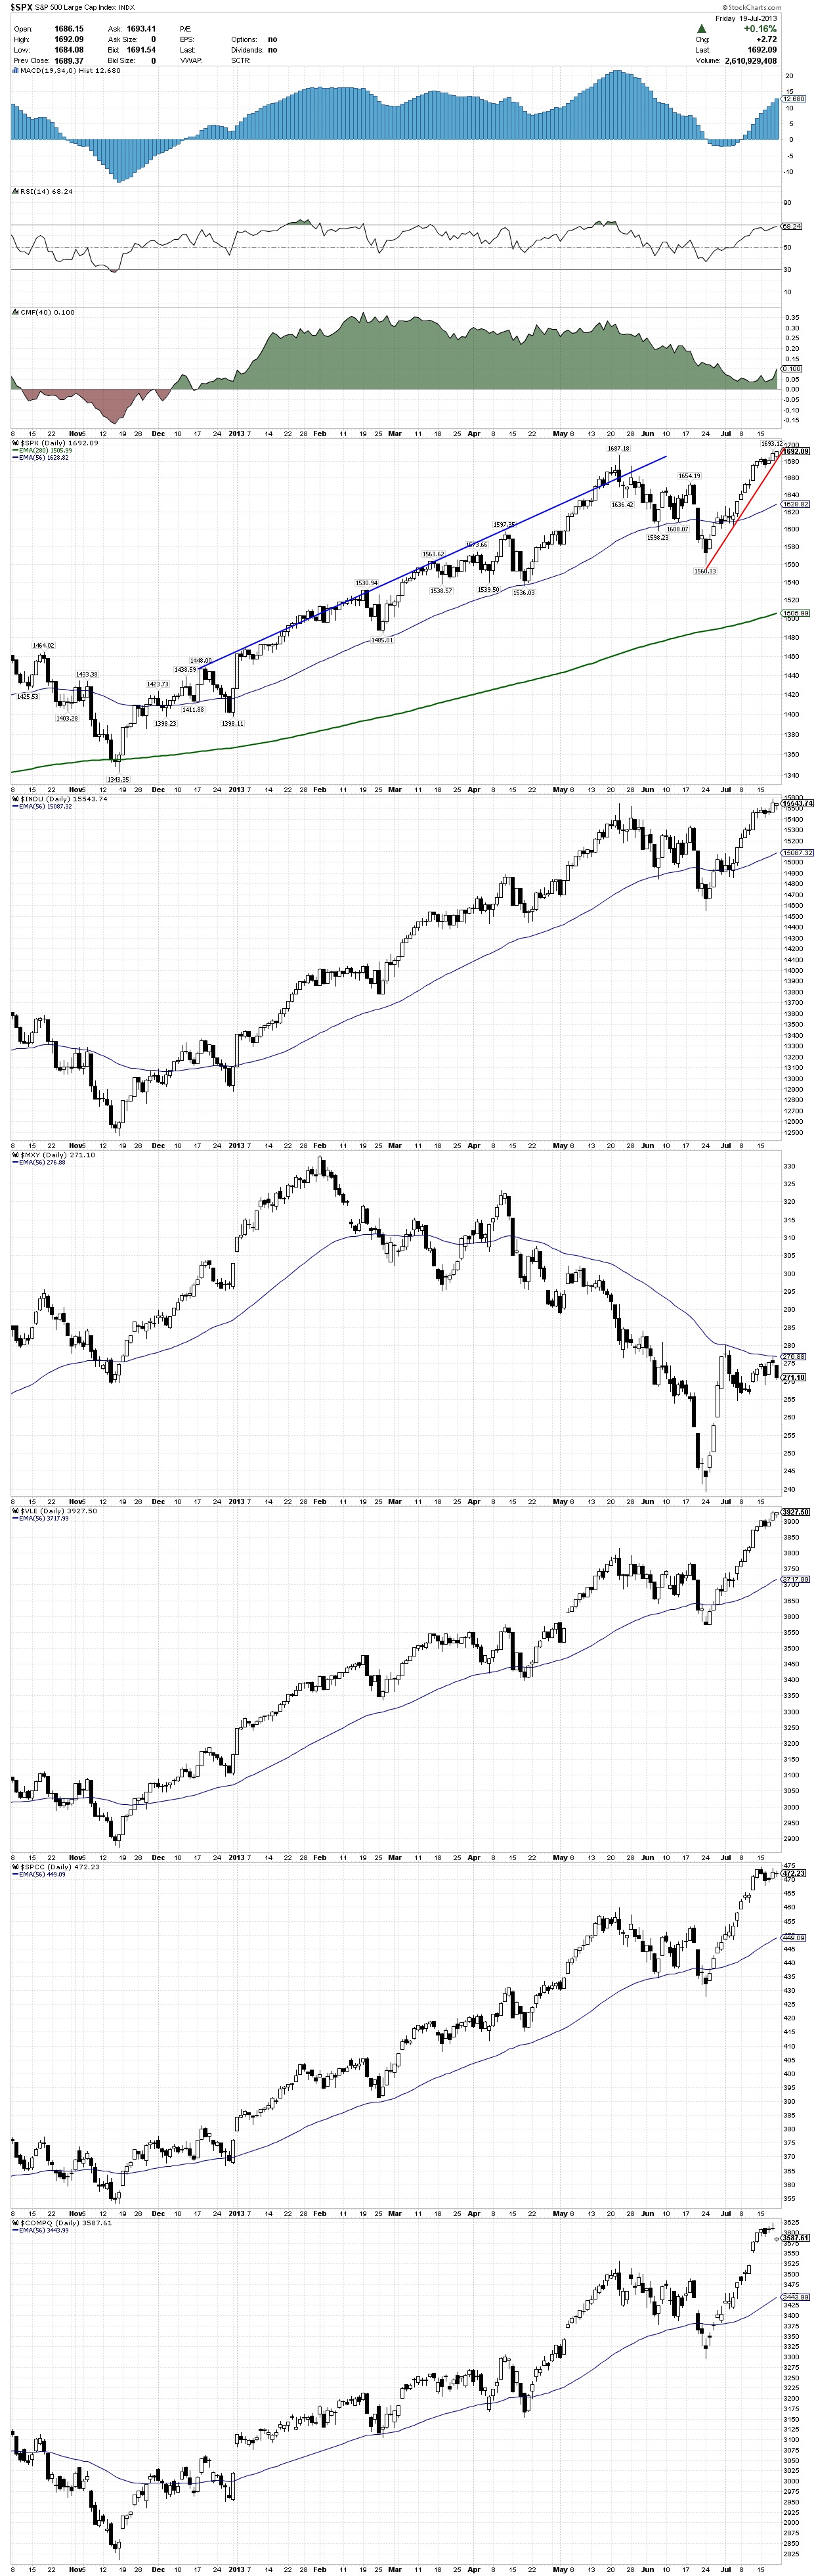
07-19-13 INDEXES DAILY
When blow-offs take place, they almost always go further than rational expectations. To date I don’t think this isn’t a true blow-off, it’s more of an over extended, uncorrected run higher.
The next chart is a long term chart for the DJ Industrials showing the 2009 bottom and some Fibonacci projections.
This chart has two 100% projections lines, each based on different peaks and bottoms. They both show a Fibonacci level near 16,000 DJ Industrials. 16,000 on the Dow is about 50 more SPX points. That’s a lot of points at this point in the advance.
Notice the nice channel that the entire bull market has formed since 2009. This is an excellent example of the channel concept. Presently we’re banging up against the upper channel line. The upper channel line hits 16,000 around November 1st. It’s not uncommon to have a throw-over during the final phase of a market move. That concept holds the possibility that the Dow could see 16,000 before November 1st. We’ll see.
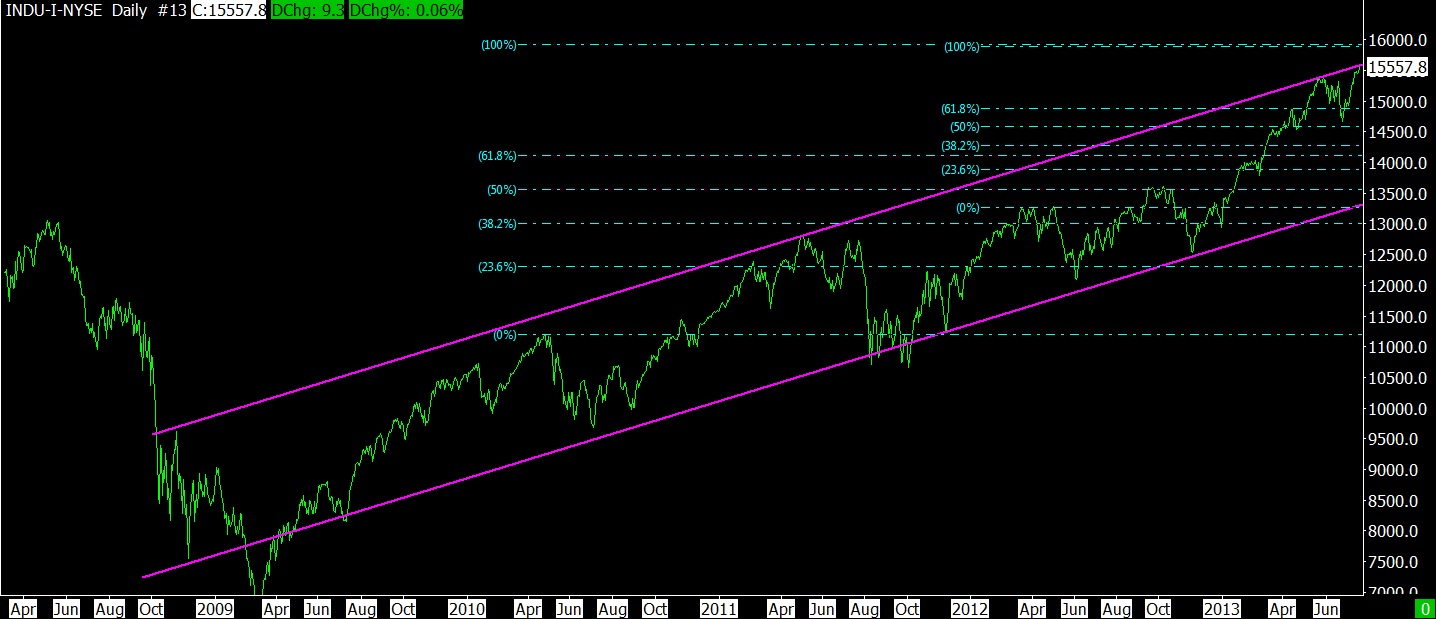
07-19-13 DJ INDUSTRIALS DAILY
For now, continue to enjoy the ride but stay nimble.
—————————————————————————————————————————————
- Click on any picture or chart to enlarge it
Leave me a comment or question just a few inches below here. If it says “Comment”, click on the comment and you’ll see “Leave A Reply”.
All Rights Reserved © ™
Explore posts in the same categories: UPDATE
July 27, 2013 at 5:01 AM
[…] 07/19/13 – Rising Quickly To 1700 (or higher ???) […]
LikeLike
July 23, 2013 at 5:41 AM
Actually, I didn’t even realize that the SPX is already higher than the May 2013 top. We definitely have confirmation on the Dow Theory! (in contradiction to my previous post)
LikeLike
July 22, 2013 at 7:24 PM
Thanks for the great charts and analysis, Bob. I always learn new symbols and new techniques by looking at your charts.
I use Dow Theory to tell me if we are in an uptrend or downtrend but I don’t think you can use it alone as a trading system. Once I know the direction of the trend then I only take the intermediate term trades in the direction of the trend. For actual entries, I think you are on the right track by looking at sentiment, breadth measures, and maybe just simple moving averages.
I think the uptrend is still not totally confirmed. The confirmation would be if the markets corrected but made a higher low than the June 2013 low before starting to rise again (Nasdaq is already correcting a bit). But, this market is so strong that I didn’t want to wait for the full Dow Theory confirmation and bought into this half signal. As soon as the SPX exceeded the June 2013 top I bought into some consumer discretionary etfs (VCR). I am looking at gold too, but given the downward strength of the metals correction, I would definitely wait for the full Dow Theory confirmation in gold before buying it. Gold has been spiking up, so if it makes a higher low in the next pullback I will probably buy some GLD when it makes what is called a swing support power of two. Still, picking bottoms is very risky and I will probably lose money.
I sometimes like to look at rough Elliot Wave counts, but this is not something that I trust because it is extremely subjective. Furthermore, it looks like wave 5 just started off of the June 2013 bottom and the SPX has a potential fib price target of $1772.82 before the next significant correction (61.8% of distance between beginning of wave 1 (1343.35) through end of wave 3 (1687.18)).
Anyway, the comment that I would like to make based on my questionable techniques is that this overbought market can go a hell of a lot higher than anybody expects!
Valtinho
LikeLike
July 21, 2013 at 10:53 AM
Nice report thanks Bob.
LikeLike