07/16/13 – Jeff Saut’s Warning Nov 2007

MARKET MESSAGES
7/16/13 . . .
I recently located Jeff Saut’s comments from November 26, 2007 and thought some might find these historical comments interesting.
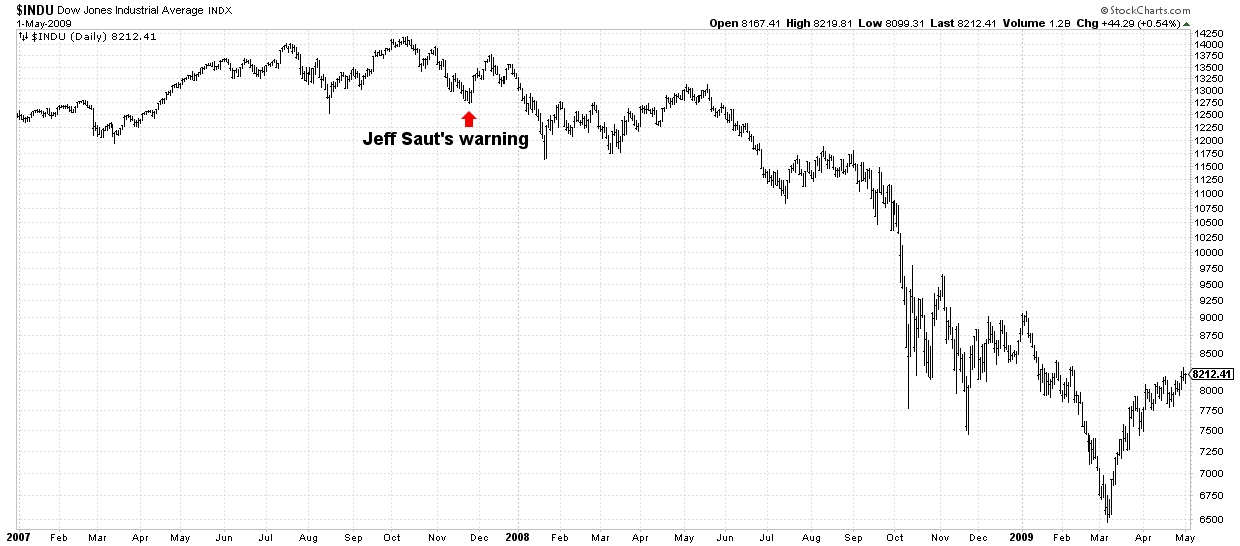
Jeff was on the right side of the bear market decline relatively close to the October 2007 peak (DJI 14,093). After his comments on Nov 26, 2007, the market rallied to about DJI 13,500 making a lower high, thus reinforcing the Dow Theory sell signal. The Dow Jones Industrials declined to 6,570 in March 2009, a decline of 51% from the November 2007 peak. The overall bear market declined 53.4% from the Oct 2007 peak.
07-16-13 November Dow Theory Sell
Jeff Saut – Nov 26, 2007
“People don’t understand the significance of the ‘bear market signal’ of November 21. I stated on Wednesday’s site (Nov. 21) that the breakdown of the Industrials signaled the existence of a primary bear market. It didn’t signal the beginning of a bear market. Wednesday’s action gave us the final word via Dow Theory that a primary bear market was in force.
…A precept of Dow Theory is that neither the duration nor the extent of a bull or a bear market can be predicted in advance. It is far easier to identify the end of a bull or bear market than it is to predict their end. Bull markets tend to build extended and often deceptive tops while bear markets tend to build more definite and identifiable and faster bottoms. Therefore, it’s usually easier to identify the bottom of a bear market than it is to identify a bull market top.
…I expect a lot of wild and confusing movements from the stock market in the days ahead. But I remind subscribers that a rally here, even a powerful rally, will not mean that the bull market has suddenly been reborn. This bear market will not end in four months. But any rally here will allow subscribers to ‘trim their sails’.”
– Richard Russell, Dow Theory Letters
So wrote Richard Russell on Friday, November 23, opining on last Wednesday’s Dow Theory “Sell Signal,” when the DJIA finally confirmed the D-J Transportation Average (DJTA) by closing below its August reaction low of 12845.78. I have read Richard’s missives since the early 1970s. I remember his bull market “call” of December 1974. Likewise, I remember his bear market “call” in the fourth quarter of 1999. As one of the few remaining interpreters of Dow Theory, when Richard makes such a “call,” I pay attention; especially if it “foots” with my sense of the markets.
Recall that I have been cautious on the equity markets since mid-September, often remarking, “The time to be aggressively bullish was in mid-August (I was), not following a 1,500-point Dow Wow!” I further noted that bottoms tend to be a function of time and price; and, that while I had hopefully satisfied the “price” requirement, the “time” factor was still lacking. Subsequently, I suggested a downside retest of the August lows was in order. Unfortunately, last week’s downside retest, while looking successful (read: bullish), rendered a classic Dow Theory “Sell Signal.”
However, I have seen many decent rallies develop following a Dow Theory “Sell Signal” since such signals tend to come after a fairly significant decline. In this case, according to Dow Theory, the bull market ended on July 19, 2007, which was the last time the DJIA and the DJTA both recorded higher closing prices.
Therefore, the bear market is already four months old. While only time will tell how events play out, I am cautious and would remind participants that since 1935 the average P/E ratio for the S&P 500 is 16x; and that the current P/E ratio is 18.3x, making stocks somewhat of a neutral value in the aggregate. Also of note is that on a trailing 12-month basis earnings momentum has turned negative, implying forward P/E ratio estimates are questionable. That said, I still own a lot of stocks, but will continue to rebalance those positions like I have been doing with my beloved “stuff stocks” over the past number of weeks.
Clearly, the various markets are currently grappling with how events play out in the coming year. As the always insightful GaveKal organization recently noted, there are four possible outcomes:
“Scenario 1: The Fed sticks to its assertion that the risks for inflation and growth are now in balance, does not cut rates any further, and the U.S. economy grows past its credit crunch. If this happens, it would be massively bullish for the U.S. dollar, massively bearish for gold and potentially bearish for Hong Kong and Chinese equities (which are now anticipating more rate cuts). It would also be very bearish for U.S. Treasuries and government bonds around the world. Additionally, we would also most likely see a rotation within the stock markets away from commodity producers and deep cyclicals (which have been leading the market higher for years) toward the more traditional “growth” sectors, such as technology, healthcare, consumer goods, and maybe even Japanese equities.
Scenario 2: The Fed sticks to its guns, does not cut rates, and the U.S. economy really tanks under the weight of the credit crunch. In essence, the U.S. would move into a Japanese-style “deflationary bust.” In this scenario, equities around the world, commodities, and the U.S.$ would collapse, while government bonds would go through the roof.
Scenario 3: The Fed ultimately cut rates, but this fails to rejuvenate the system and get growth going again. This would likely mean stagflation. As such, gold and other commodities would do well, while stocks and the U.S.$ would struggle. Excluding bonds, this is increasingly what the market is pricing in today.
Scenario 4: The Fed ultimately cuts rates, and succeeds in reigniting the economy. This would be good news for equity markets, commodity markets, and the U.S. dollar (as world trade and foreign buying of U.S. assets would again expand, increasing the need for U.S. dollars). Of course, this scenario would be terrible news for bonds.”
GaveKal concludes by opining that the market is betting on Scenario 3 and thus one has to be concerned that the Fed’s hand could be forced by the market to cut rates. Cut rates indeed, yet history shows while the first rate cut has an impact, the second and third tend to not have so much of one. This is demonstrated once again by the fact that the S&P 500 is below where it was when the Fed cut interest rates for the third time on October 31.
Meanwhile, Treasuries have been rallying sharply and junk-bond spreads over Treasuries have expanded materially. This is not an unimportant point for the stock market’s outsized “winners” (energy, materials, commodities, industrials, anti-U.S. dollar bets, emerging markets, etc.) bottomed in 2001 concurrent with the narrowing of such credit spreads. Now that these spreads are widening, it could spell trouble for the overcrowded “long stuff stock,” short “U.S. dollar” trade that has made us so much money over the last six years (see the attendant chart from the invaluable service thechartstore.com).
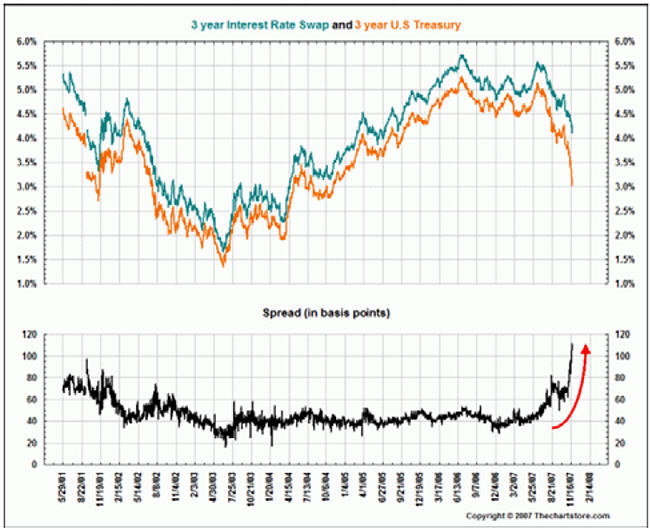
Nov 2007 Interest Rate Swaps
This is one of the reasons why I have been rebalancing my stuff-stock positions (read: selling partial positions and holding the balance in cash) and reducing my anti-dollar “bets.”
Another reason I have tilted my strategy is a growing sense that what we may be dealing with is more of a solvency rather than a liquidity issue. Recently, many articles have dealt with certain financial institutions’ “Equity Base” being smaller than their exposure to “Level 3 Assets.” Plainly, all these folks’ Level 3 Assets are not going to go bad, but the new FASB #157 accounting rule forces financial institutions to divide assets into three categories called Level 1, Level 2, and Level 3. Under FASB’s terminology, Level 1 assets can be marked-to-market (valued on real prices). Level 2 assets are marked-to-model (an estimate based on observable inputs). Level 3 assets, however, have been marked-to-myth until now. With FASB 157’s implementation it appears these assets will be much more stringently valued on the balance sheet, potentially raising “solvency” questions. Because the central banks are much less effective at dealing with “solvency issues” than they are with “liquidity issues” this too makes me cautious.
The call for this week: Due to the aforementioned observations, I find myself asking the question, “Has the leadership baton been passed to the 4Q07 leaders of utilities, techs, consumer staples, and healthcare?” If so, the daily list of “new lows” might be a fertile universe for ideas now that we are entering the “teeth” of tax selling season. While only time will tell, the recent decline feels different than the one I anticipated, and bought at the lows, of last summer. Moreover, when interest rates cuts are met by sinking stocks, and a Dow Theory “Sell Signal,” it always makes me nervous!
Nevertheless, “they” are going to try and talk-up last week’s action as a successful “retest” of the August lows and may just be able to get things going on the upside, which is why I am trading some “long” indexes like the S&P 500 Geared Fund (GRE) with a close trading stop-loss point in keeping with the George Soros quote of “Economic history is a never-ending series of episodes based on falsehoods and lies, not truths. It represents the path to big money. The object is to recognize the trend whose premise is false, ride that trend, and step off before it is discredited.”
Jeffrey Saut of Raymond James is a very savvy guy and one of the few interesting people that I follow. I found Jeff years ago among the talking heads on CNBC, which is normally populated with talking heads spouting popular opinions. When I saw Jeff for the first time, he was mentioning different ideas than everyone else was regurgitating. Immediately this catches my attention because I’m ALWAYS interested in anyone that has a mind apart from Wall Street. Following the crowd will get you killed on Wall Street. After listening to him over time, I realized he was smart, insightful and normally on the mark.
Jeff reminds me of Robert Farrell of Merrill Lynch fame (1970s and 1980s), who achieved a large following being frequently on target. Bob Farrell was one of my favorites during the 70s and 80s.
—————————————————————————————————————————————
- Click on any picture or chart to enlarge it
Leave me a comment or question just a few inches below here. If it says “Comment”, click on the comment and you’ll see “Leave A Reply”.
All Rights Reserved © ™
Explore posts in the same categories: JEFF SAUT
Leave A Reply