07/09/13 – Euphoria & A Peak Is Coming

MARKET MESSAGES
7/9/13 . . .
Don’t you feel it . . . the good times are rolling along and easy money is flowing. I know you feel it because it’s unavoidable when the market is rising . . . rising . . . rising . . . and it seems like there is no stopping the market and the easy money.
Euphoria . . . I’ve got it and it’s contagious.
It’s those full speed ahead feelings that should make you look around and see if everything is OK. Maybe everything is OK, but let’s look.
Regardless of what we find, you gotta remember that it ain’t over until it’s over. This was glaringly true during 1999 when I was Chicken Little declaring that the sky was going to fall. The peak was not until the next year. I always have a tendency to be early and sometimes it can be a curse.
Let’s look at some possibilities.
The first chart has the obvious wave count and it says we should rally into blue cyan step 5 (presumably under way presently), which will complete the larger step that began in October 2011.
The conclusion of the step that began in Oct 2011 (blue cyan count) could also complete yellow 3. Yellow 3 counts the major peaks since March 2009 and with a completed 3 count, we could be in for rough times.
Am I looking for a bear market??? Not yet, but I am looking for a significant decline when we have finished the count and broken the channel that began in October 2011. We’ll take the bear market issue as it comes and roll with punches, which means always trying to be on the right side of the market.
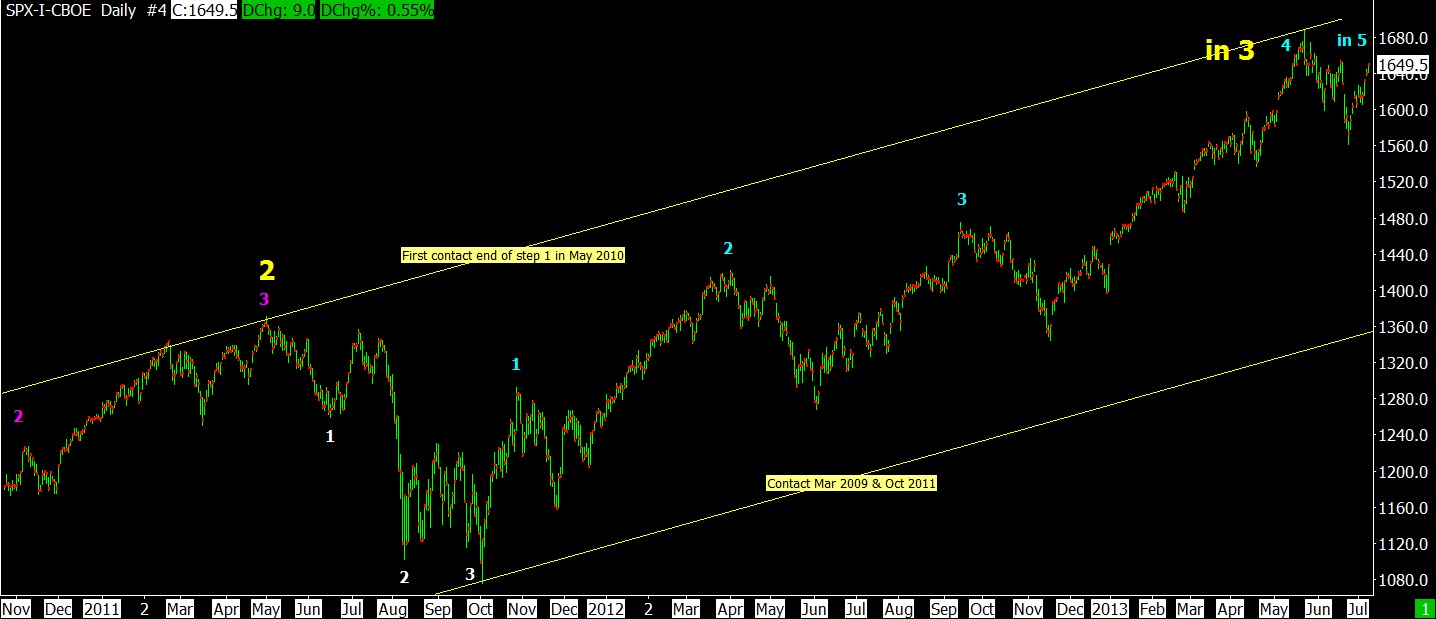
7-9-13 SPX DAILY – 1
The next chart you’ll see an alternate wave count. This wave count is not obvious but it started back with the February 2011 peak. This chart has an earlier end to yellow 2 than the first chart. After violet 3 (Feb 2011) came a 4th and 5th step. These steps always bothered me and they continue to play a “possible” roll in our present wave count.
This chart says that we may have completed blue cyan 5 that began in October 2011 and possibly yellow 3.
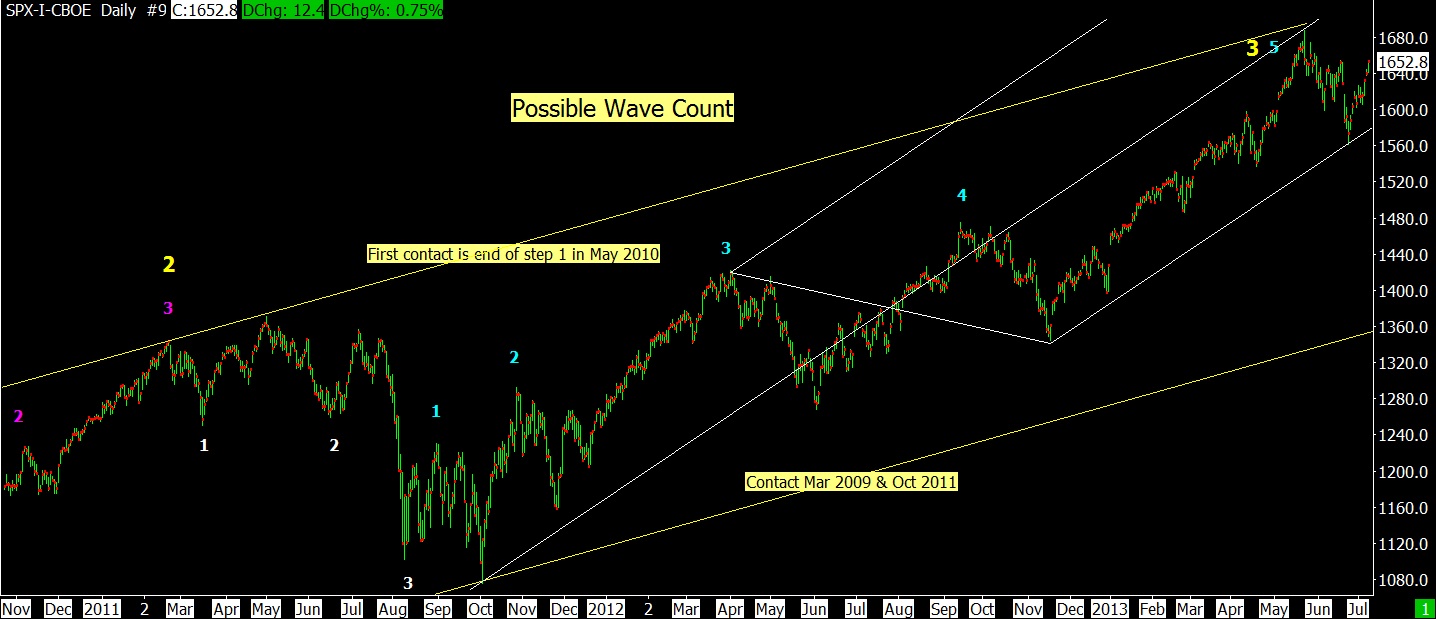
7-9-13 SPX DAILY – 2
As I said before when I first posted these two charts, which one is right??? I still don’t know, but they warrant attention.
If we make a “significant” new high, this will denote blue cyan 5 is underway. If we fall short or make a slightly higher high, we could then say that (1) we have already completed step one down, or (2) we just completed blue cyan 5. The obvious confirmation of a significant decline would be a new low below the June 24th low.
What’s the worst that could happen when we complete yellow 3??? We could have another bear market. The bear market could be the last step in the super bear market that began in 2000. What super bear market??? See the monthly index chart on the first page of My Charts presently denoted as #13.0 – Monthly Indexes.
What’s the best that could happen??? After we complete the step that began in November 2012, we could have a significant decline, but not a bear market. We could then resume the bull market that began in March 2009. This would mean we are sub-stepping upward like we did in the 1990s.
A little bit of nomenclature. For me a bear market is a very large correction. Something on the order of a 50% correction. A 25%-35% correction is just a significant correction, not a bear market in my opinion.
One possible way to look at possible sub-stepping is that the decline that ended on June 24th doesn’t have the same degree or magnitude following the other peaks in 2012. That degree could change in the weeks ahead with more corrective action, but if it doesn’t, it “could” mean we are sub-stepping. Is it possible that blue cyan 4 is only the end of step 1 of another new 3 steps up??? This is what happened during the 1990s, sub-stepping that was unstoppable. Easy money was the fuel during the 90s . . . sound familiar???
One point we should bear in mind is that whatever the perceived wave count, the breaking of the channel is the final determinant for the end of step.
The charts above have a pretty wide channel for the bull market that began in 2009. Each step has its own channel and the larger the degree of the wave count, the wider the channel.
Whatever is going to happen, one should go with the flow so you don’t get left behind in the battle for profits. But don’t get carried away with the emotional tide. Always be wary, or before you know it, you’ll be trapped in a 2000 or 2007 peak. If you’re too wary, you could become the conservative player who never plays or plays too late and misses opportunities like the March 2009 bottom.
Below is Jeff Saut’s recent column and he is presently very cautious. I don’t think he is looking for a bear market, but he is looking for more corrective action than we saw in June. After the October 2007 peak, he declared a Dow Theory sell signal in November 2007, but he didn’t say you should sell everything at that time. He said you should lighten up on your holdings or offset your position with a derivative.
JEFFREY SAUT of Raymond James – 7/8/13
“Rosebud?!”
Produced in 1941, the movie “Citizen Kane” is heralded as one of the best movies ever made. It was one of the first to depict the American Dream, and materialism, as less than desirable and therefore causes one to contemplate what actually constitutes “a life?” Indeed, as a child the central character, Charles Foster Kane, is living in rural Colorado in a boarding house run by his mother (Mary). Kane is happy and content in the idyllic snow-swept setting riding his sled “Rosebud.” Then, in lieu of rent, one of the tenants gives Mary stock certificates that turn out to be shares in a working gold mine. Suddenly finding herself rich, she decides to send her son off to be raised by her banker, Thatcher, in an attempt to teach Charles the finer things in life. Thatcher, however, is too interested in making money to have compassion for a child. From there, through a series of vignettes, the viewer watches an abandoned, lonely boy grow up to be a fabulously wealthy media magnate. Yet in the process, Charles becomes arrogant, thoughtless, isolated, morally bankrupt, and incapable of loving except on his terms. Eventually, these faults cause him to lose his empire, fortune and friends. In the end, Kane is lying on his death bed surrounded by crated artworks, and other objects, that are being thrown into a blazing furnace. With his dying breath, Charles Kane lets the snow globe he is holding smash to the floor as he utters the word “Rosebud.”
To me, “Rosebud” represents the emblem of hope, security, and innocence that Charles Kane lost when he was torn away from his family as a child. Similarly, the equity markets have begun to “feel” like they have lost their hope and security over the past few weeks. To be sure, on May 22nd we experienced an “outside” Down Day reversal whereby that day’s intraday high/low was above/below the previous session’s high/low (read: negative). That has led to a series of lower highs, and lower lows, punctuated by the back-to-back 90% Downside Volume Days of June 19/20th. Recall, the “buying stampede” was kicked off with the back-to-back 90% Upside Volume Days of December 31, 2012 and January 2, 2013, begging the question, “Did June19/20th end the stampede?” (see chart on page 3). The answer to that question remains a resounding NO since the D-J Industrial Average (INDU/15135.84) has still not experienced four consecutive down sessions this year. Indeed, it has been the most remarkable upside skein I have seen in over 50 years of stock market observations with said stampede now at session 129! Nevertheless, we have now entered the month of July.
Recall that for months I have targeted mid-July as the timing point for the first “meaningful” decline of the year to commence. While I have not shared the exact timing points, they are July 11/12th (minor timing points) with July 19th being the major timing point. Those “points” are derived from quantitative and technical models, as well as what my Washington, D.C. network is suggesting will surface before Congress’ August recess. To wit, Chairman Bernanke will deliver the first day of his semi-annual monetary policy testimony on July 17th before the House Financial Services Committee. While his comments will likely echo his previous comments (no rate ratchet, open-ended asset purchases of $85 billion per month, all Fed actions will be “data dependent,” etc.), the Q&A could “rattle” the markets coincident with the Fed’s Beige Book providing an anecdotal glimpse at economic conditions. The next day, July 18th, Bernanke will deliver his second day of testimony before the Senate Banking Committee with an attendant Q&A period. Additionally, I think there will be some rhetoric about the sequestration starting to take a bite out of the economy accompanied by increasingly heated discussions on the upcoming debt ceiling and the continuing budget resolution. Moreover, we are now into earnings season where 2Q13 expectations have been ratcheted down from year/year growth estimates of +4.2% to the current +0.8% for the S&P 500 (SPX/1631.89). The sectors most vulnerable to earnings misses are Materials, Technology and Industrials, even though I continue to favor Technology and the Industrials. Another sector, namely Financials, could suffer as well because the recent interest rate rise has caused the banks to lose roughly $22 billion in their “Available for Sale” bond portfolios. Further, the U.S. dollar has been strong, and has broken out in the chart to new reaction highs, which may have a negative impact on international companies’ earnings.
Reinforcing my cautionary view is a stock market axiom I learned from an old Wall Street wag in the 1970s that states, “When they start running the ‘dogs,’ it’s time to begin looking over your shoulder.” So listen to this, as reprised in Barron’s and attributable to my friends at the Bespoke organization, about the first six months of the year: “The 50 smallest stocks in the S&P 500 jumped 21.9%, trumping the 13.3% gain by the 50 largest [stocks]. … The decile paying no dividends jumped 19.9%, beating 12.2% for the decile paying the most generous yield. [The] most heavily shorted stocks rose 22.6%, versus 14.3% for their least-shorted cohorts. And the decile with the worst analyst ratings gained 22.7%, trumping 13.5% for the most beloved group.” So despite the fact that the SPX has recaptured its 50-day moving average at 1625.74, I continue to think the SPX is in the process of forming a double-top in the charts between 1650 and the May 22nd intraday reaction high of 1687.18. In fact, the SPX is currently at a very critical juncture having rallied back to its downtrend line that can be seen by connecting its May 22nd high with the June 18/19th intraday highs. As well, the SPX has rallied back to the underside of an uptrend line formed by connecting the February 26th low, the April 18th low, and the June 6th low, as can be seen in the attendant chart.
The call for this week: On a trading basis, raise cash …
—————————————————————————————————————————————
- Click on any picture or chart to enlarge it
Leave me a comment or question just a few inches below here. If it says “Comment”, click on the comment and you’ll see “Leave A Reply”.
All Rights Reserved © ™
Explore posts in the same categories: JEFF SAUT, UPDATE
July 9, 2013 at 11:52 AM
Thanks Bob.
Michael
LikeLike