07/27/13 – Revisting Net New Highs

MARKET MESSAGES
7/27/13 . . .
In February 2013, I wrote a blog update titled “02/02/13 – New Highs, Sentiment & Wave Count”. The following is a quote from part of that update.
—————————————————————————————————————————————
The breadth of this market advance has been quite good as shown by the following chart of the net high – low for the last year.
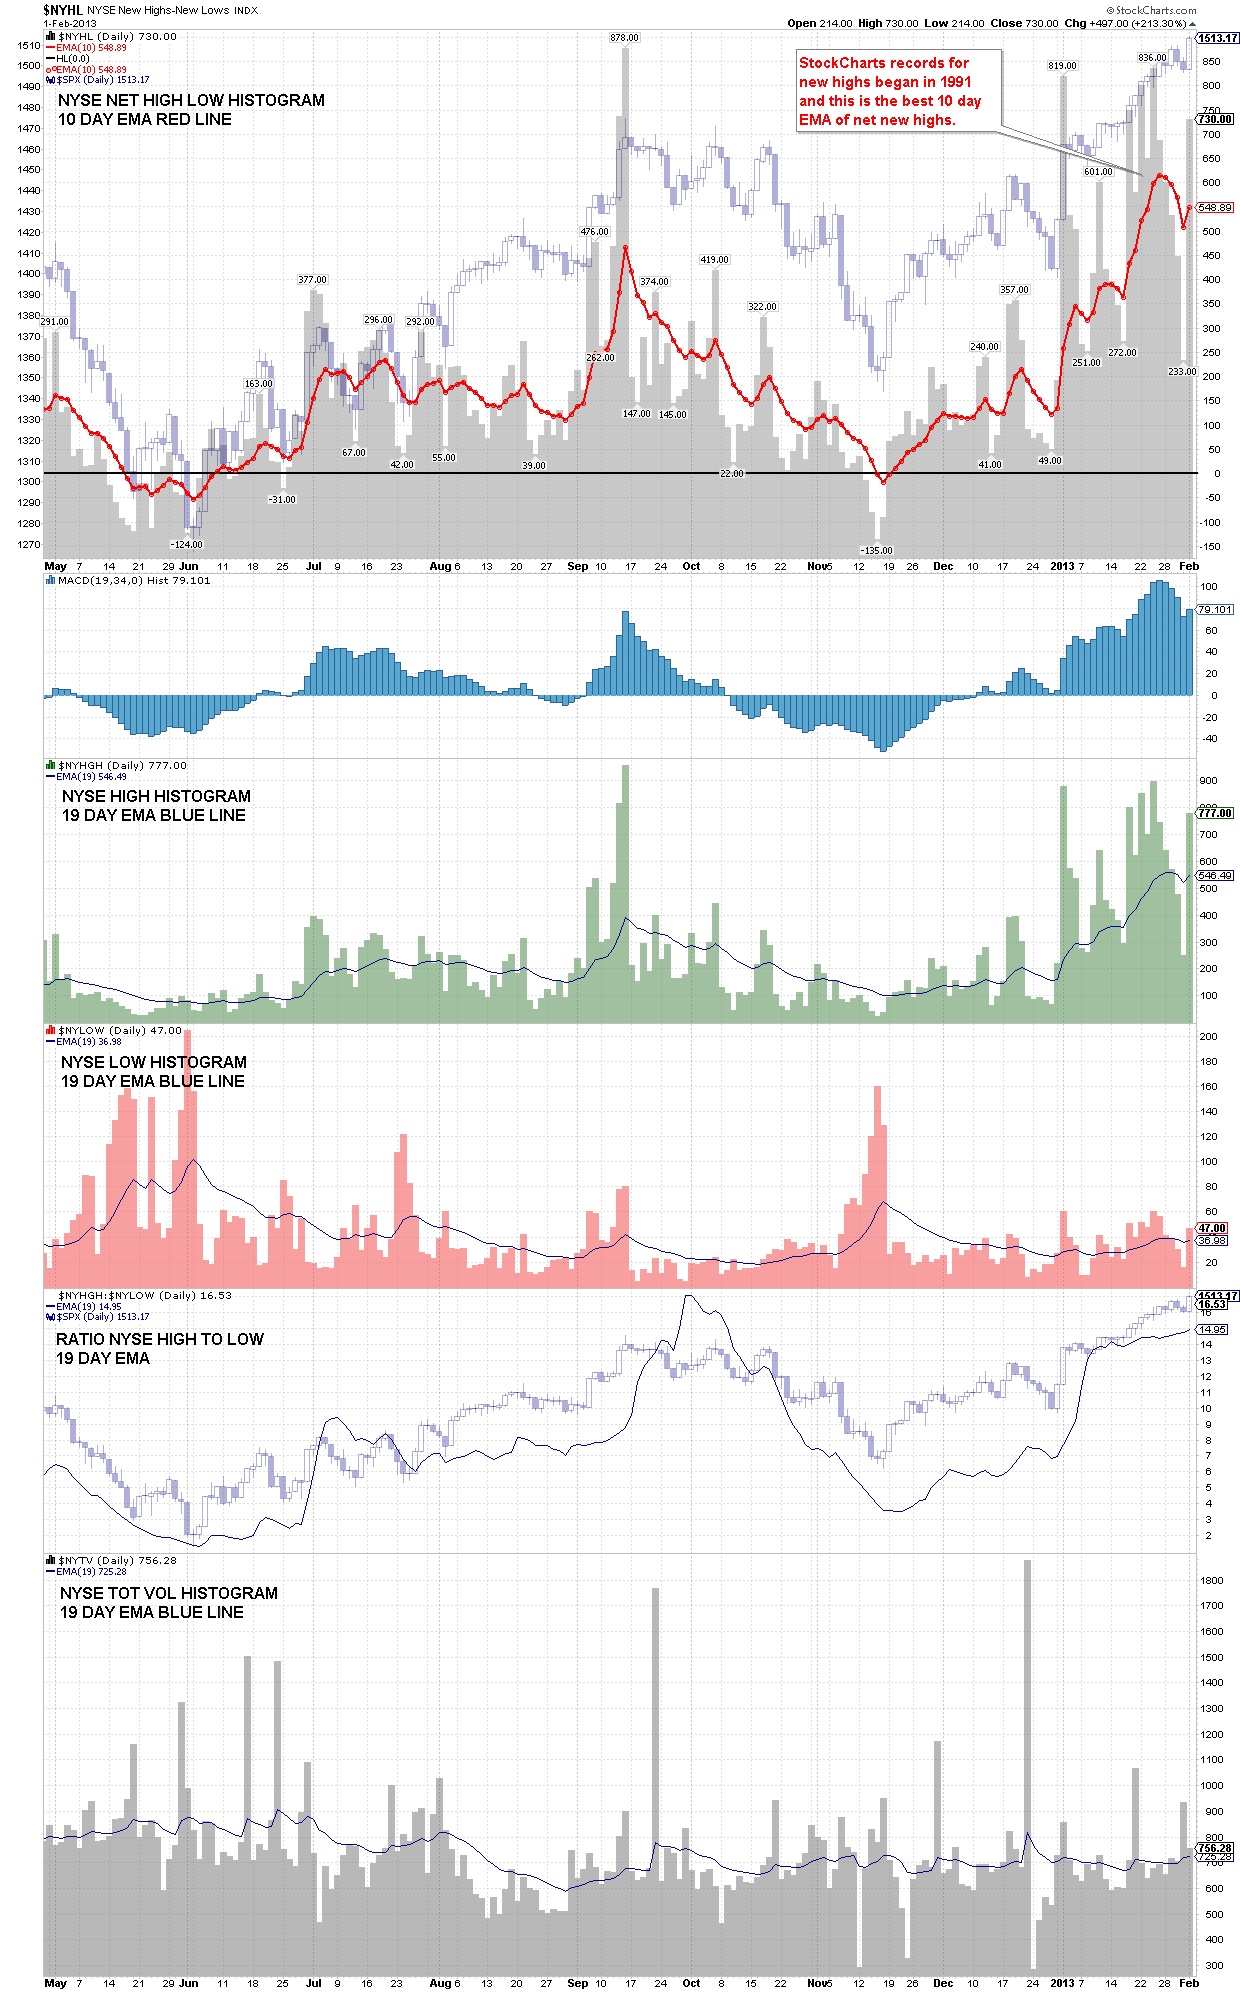
02-01-13 NYSE HIGH LOW – 1 YEAR
Looking at the next chart, which dates from 1991, you can see how the net high – low figures are the most positive in the last 23 years. There is no StockCharts net high – low data prior to 1991.
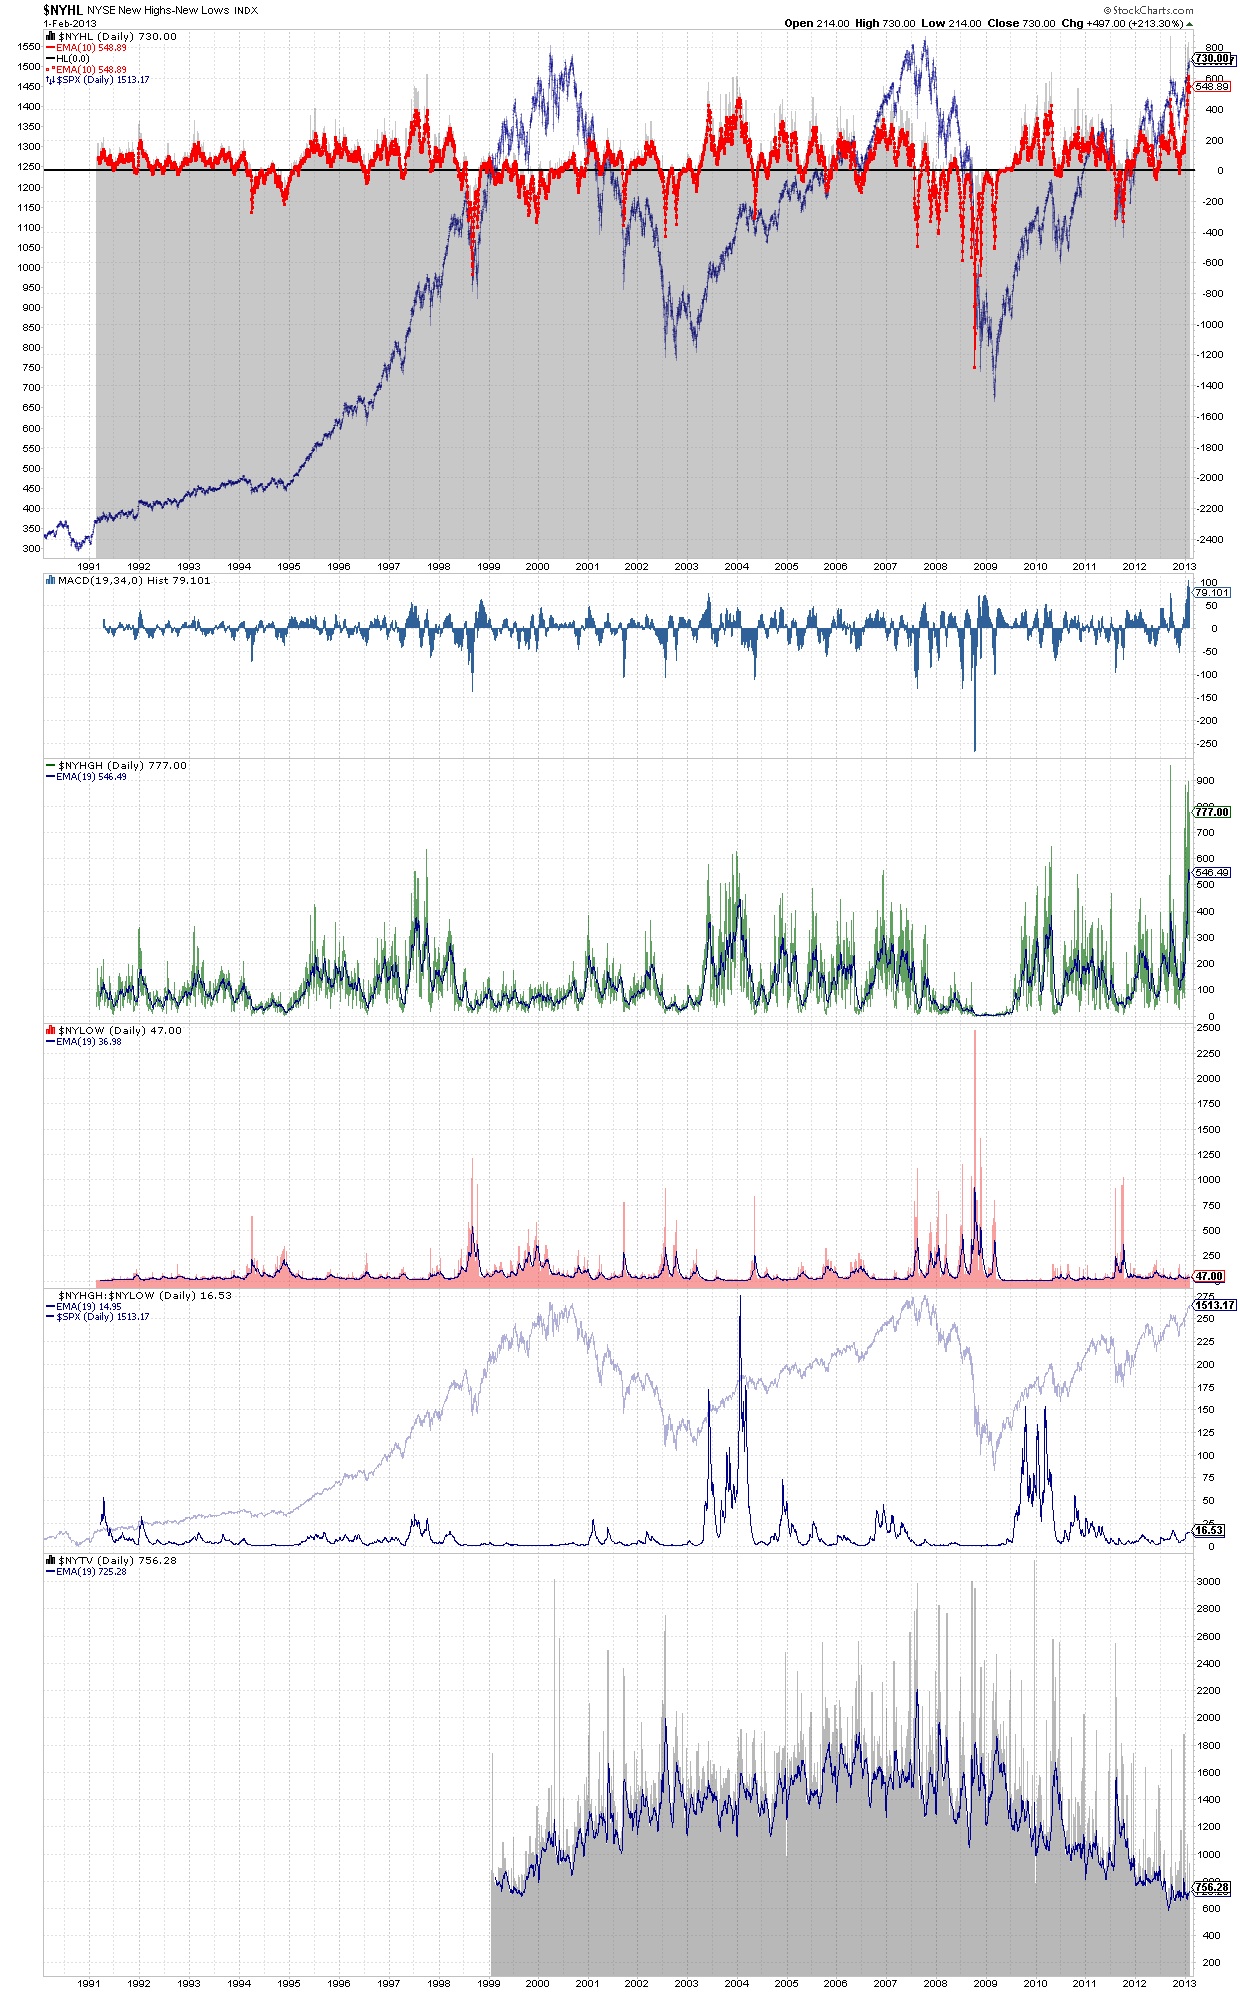
02-01-13 NYSE HIGH LOW – 23 YEAR
This market has a history of spiking the net high – low figures and then abruptly beginning a correction. This took place in September 2012, February 2012 and April 2010. The significant part of this observation was it didn’t mark the end of the bull market move. New price highs, which are accompanied by higher net high – low figures than previously, usually indicate that things are “probably” OK.
When the market makes new price highs, which are accompanied by net high – low figures lower than the prior peak, something is probably wrong. Leading up to the peak in 2000, net high – low figures were dismal for a couple of years. The long lag time of poor data prior to the ultimate peak was indicative of how boiling hot the market was in the late 1990s. The 2000 peak was a very narrow and selective advance and it was a once in a lifetime speculative peak.
Look at the chart of net high – low data during 2007. You can see how net high – low figures were indicating a peak long before the October 2007 top. The July 2007 correction was the opening act of what was to come in 2008. The rally after this correction was the last gasp of the bull and it was typical action of an approaching bull market peak.
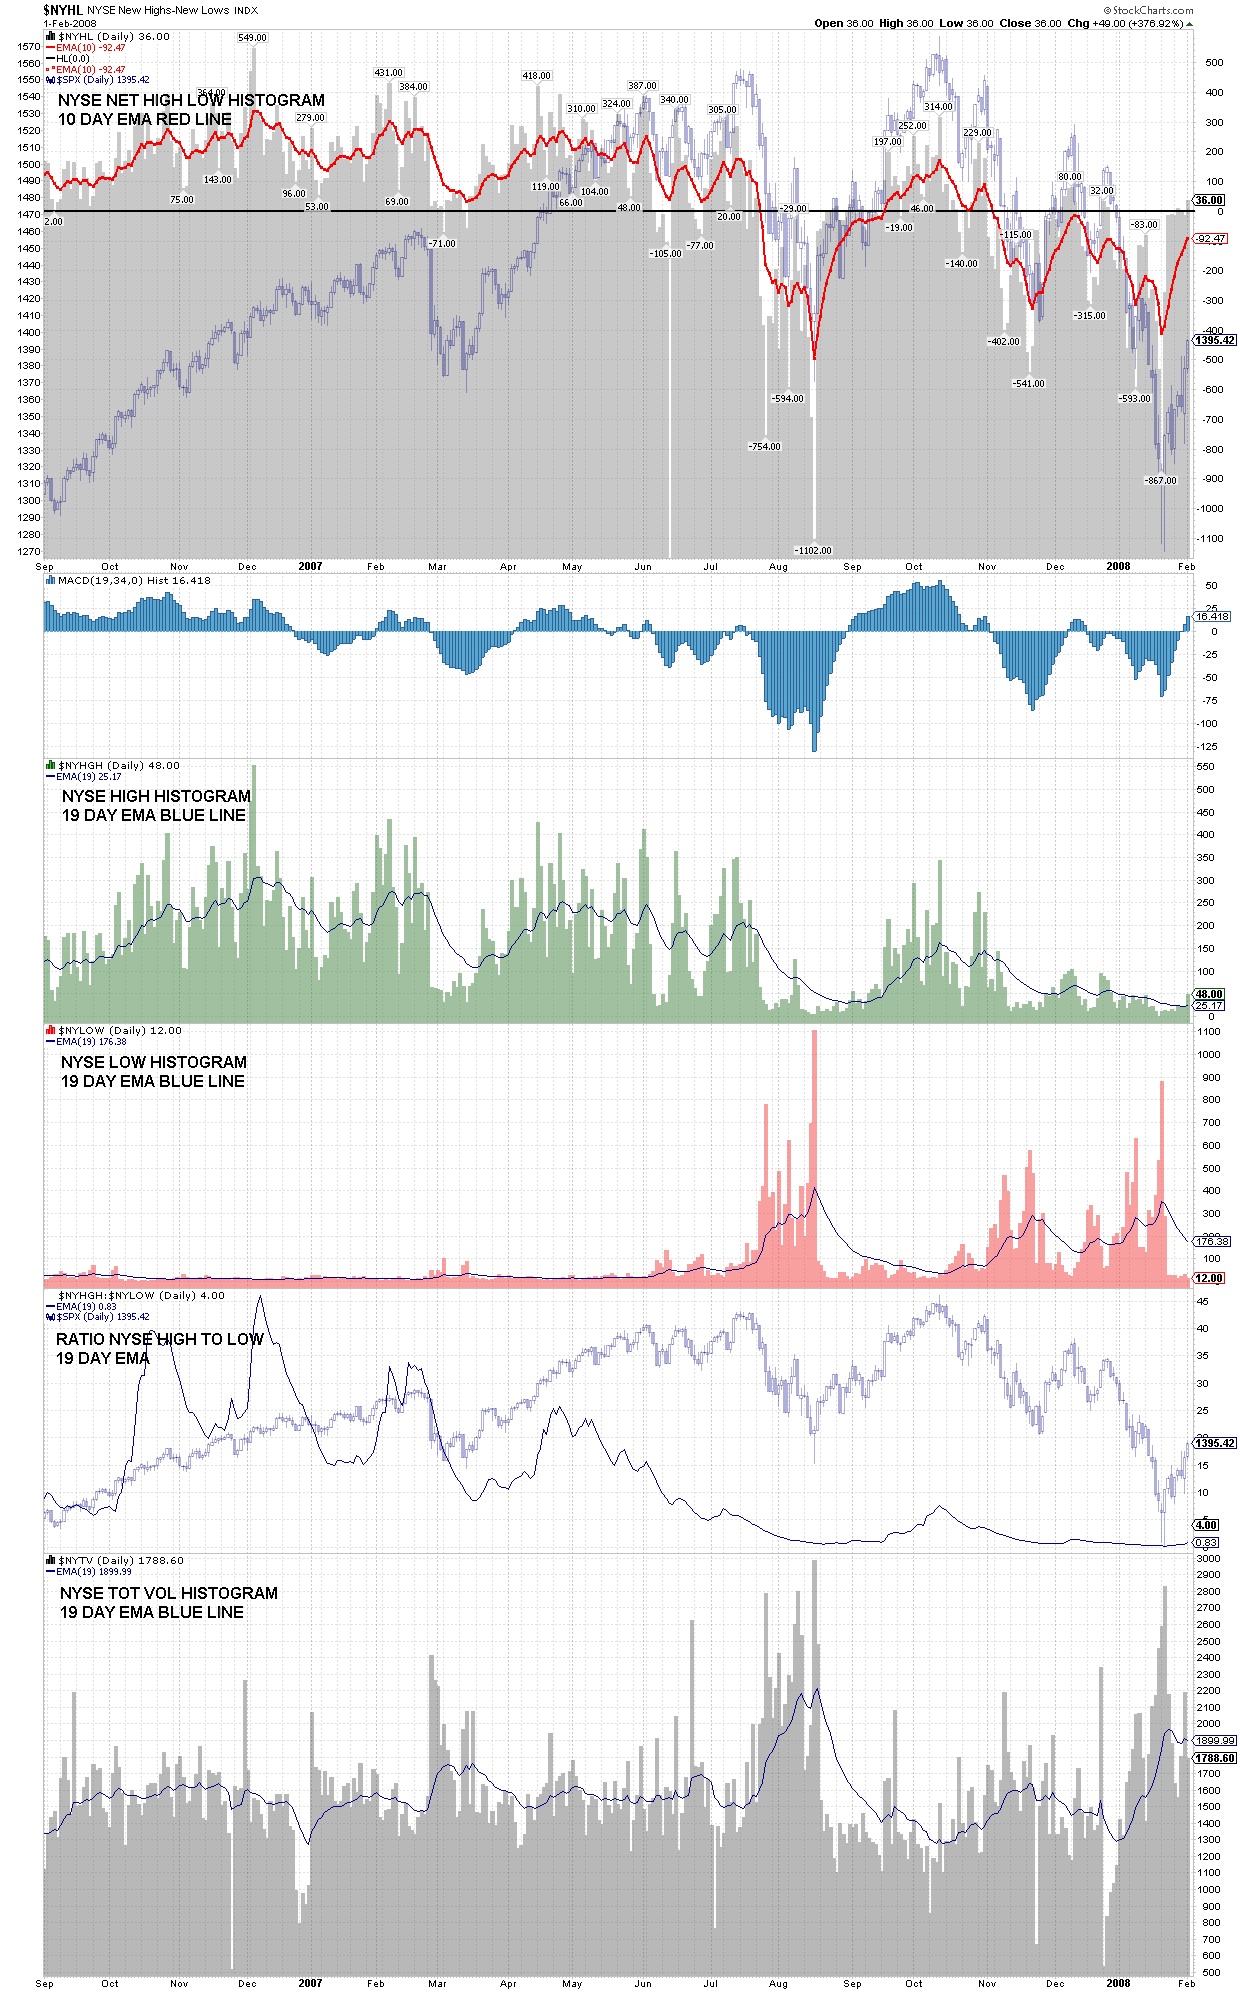
2007 NET HIGH LOW
—————————————————————————————————————————————
The following current chart can be found in My Charts with the number 30.05. This chart is slightly different than the one above because it also shows the percentage of new highs and new lows to total issues traded. The percentages are useful for capitulation stages in the market.

7-27-13 CHART # 30.050 – NYSE NEW HIGHS
The above current chart has an all-time price high accompanied by a lower 10 day net new high-low. The current 10 day net high-low is lower than the peaks in January 2013 or May 2013 (red line in first chart).
I had said in February:
New price highs, which are accompanied by higher net high – low figures than previously, usually indicate that things are “probably” OK.
We don’t have that currently. We have a non-confirmation in the net new high low figures.
I also said:
When the market makes new price highs, which are accompanied by net high – low figures lower than the prior peak, something is probably wrong.
Something is probably wrong this time around too.
But there is no matching comparison to 2007 or 2000, where the net high-low figures were declining for a long time prior to their eventual peak.
I would concur from this that the bull market is not going to end soon, but we do have an early warning sign. The net new high low figures don’t indicate this market is unhealthy, only worn out and in need of refueling.
Soon we will have a correction, probably swift and deep (ending in Oct to Jan), but it probably will represent a significant buying opportunity. That means we hold onto our money until a capitulation bottom takes place. Early nibbling will not be rewarded.
One of the cycles won’t peak until mid-August, so we might continue on the upside until then. I doubt if we can make it that long, but it’s a possibility.
I know the wave count shows a possibly completed 3rd step but it doesn’t tell us whether the 3rd step is going to extend into something much bigger and longer. Continuing extensions took place throughout the 1990s producing one very long step (1982 to 2000). That’s an example of how extreme a 3rd step extension can become.
Either the upcoming correction will be so deep to qualify as the termination of the bull market that began in 2009, or it will be only deep enough to indicate that a 3rd step extension will/can take place. We have to wait and see what we are dealt, but the 10 day net high low indicates that we are NOT going to end this bull run immediately. Before that happens there should be more topping action.
The only caveat to the above observation is the financial accident. An accident of this type MUST be a surprise to everyone to be effective. The unknown accident happens very, very seldom, usually there is inside info that is aware of the unfolding problem. For instance, the 2007-2008 financial accident was not a surprise to those privy to inside info.
I have been working on My Charts recently. If you only visit there occasionally, you might not realize the difference. It’s a slow process, but I am working on the charts, refining old charts, adding new ones, plus subtracting others with limited usefulness.
I am also working on my version of the Dow Theory Signals (1981 to present). This job was sparked recently by a blog reader’s comment. This work is being done outside of My Charts and will be posted to My Charts when its completed. The signals will have a table with the profit or loss for each trade. This might not be completed for several weeks, so keep checking back.
—————————————————————————————————————————————
- Click on any picture or chart to enlarge it
Leave me a comment or question just a few inches below here. If it says “Comment”, click on the comment and you’ll see “Leave A Reply”.
All Rights Reserved © ™
Explore posts in the same categories: UPDATE
July 29, 2013 at 12:35 PM
Thanks Bob.
LikeLike
July 27, 2013 at 1:42 PM
Thanks very much, Bob!
LikeLike