October 2008 – T Theory® Update

T Theory Observations for October 2008
During October I will post weekly Monday morning comments concerning the Daily Short Range T chart as usual. Please download and save the the important new Bull and Bear market history below.
This spreadsheet summarizes the important stages of the 1929 to recent peak swings in the S&P 500. It is an excellent starting point for students of the market.
Later I will tie its history into the 40 Year cycle.
Update for October 27
Download the current PDF file for the updated daily chart.
This weeks chart shows all the T Theory concepts need to to track the Forty Year cycle as it puts downside pressure on all investment classes going into 2010.
Note the oscillator peaked just above the zero line last week as expected and the market averages should be declining to the projected 23 week cycle low in late November.
The actual low is better determined from the oscillator pattern in late November. A rising Oscillator bottoms pattern with the S&P still making lower lows is the usual sign of an impending up turn.
Update for October 20
Download the current PDF file for the updated daily chart.
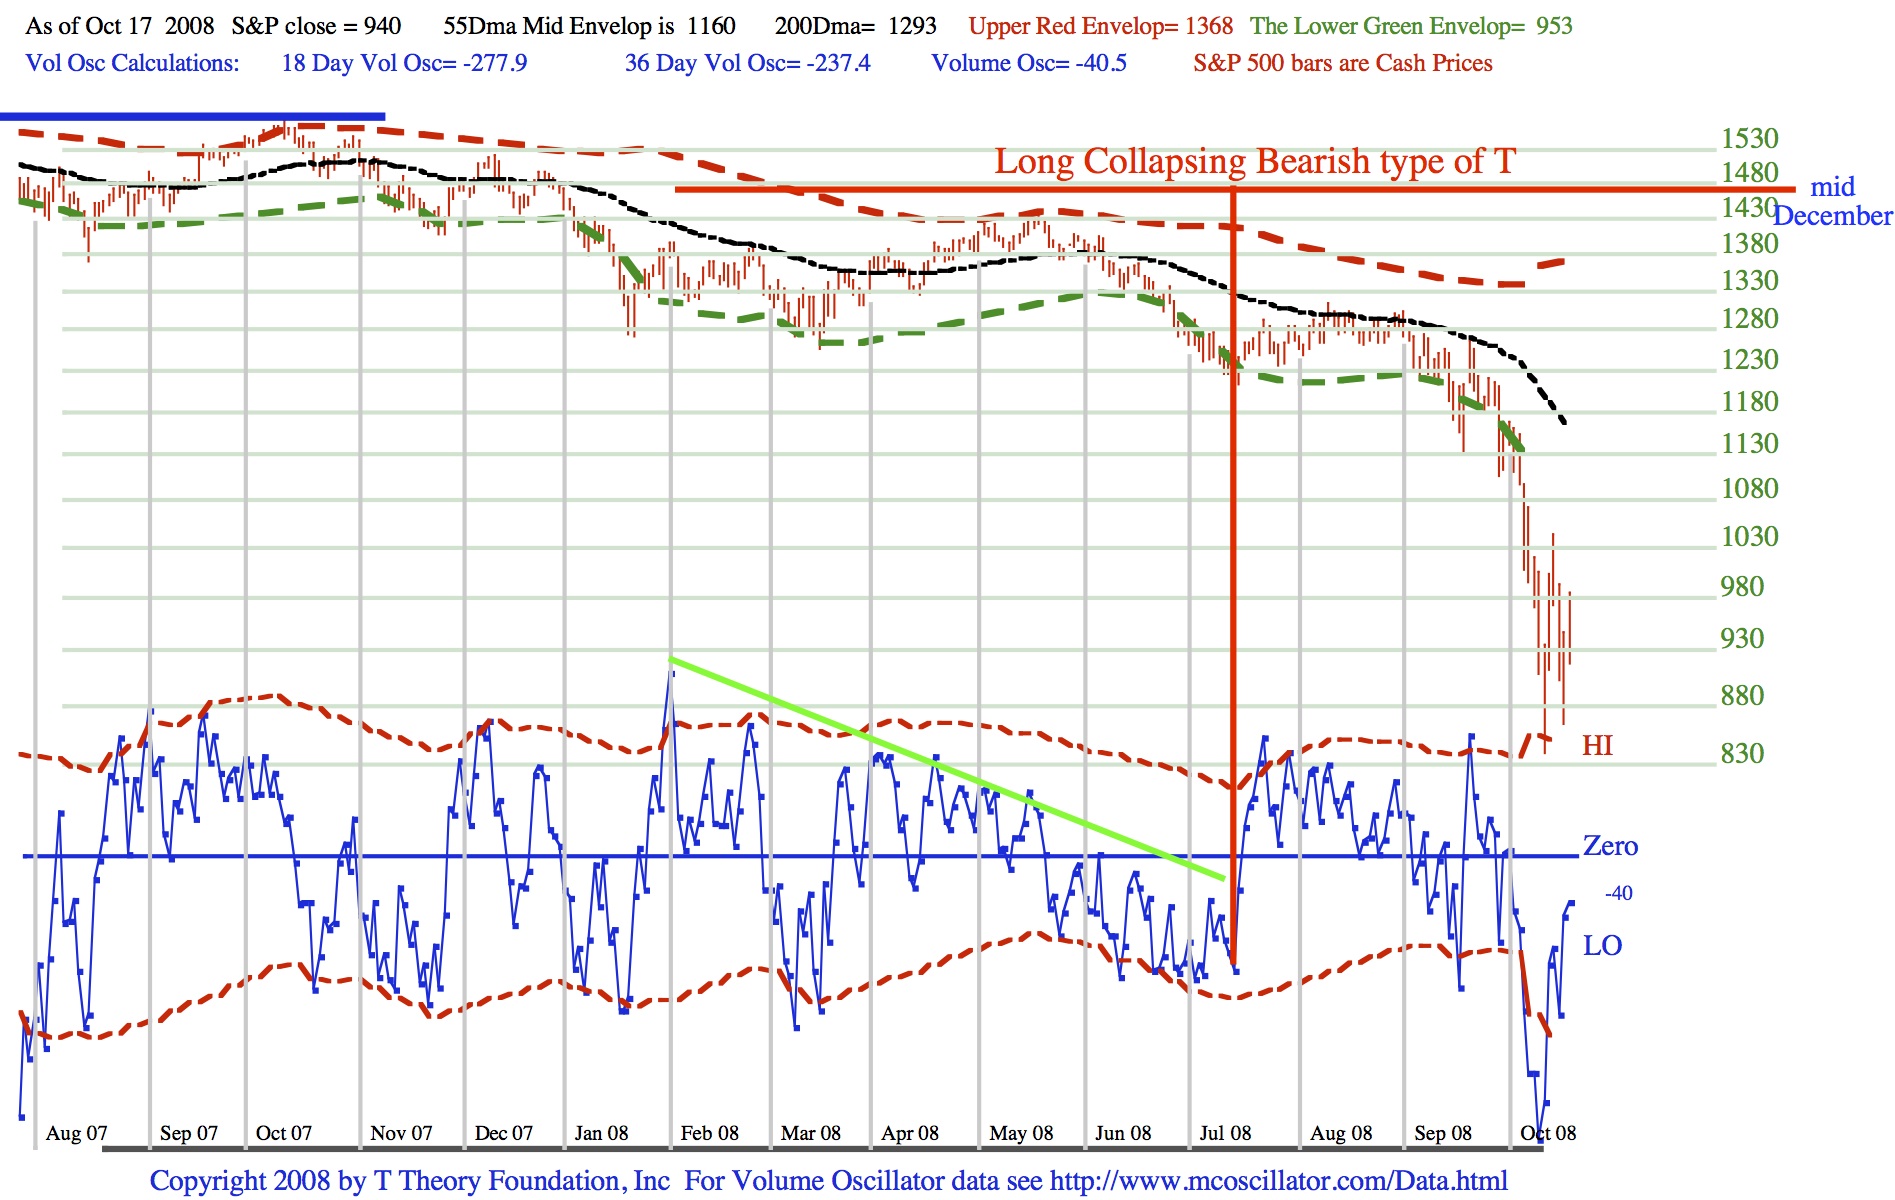
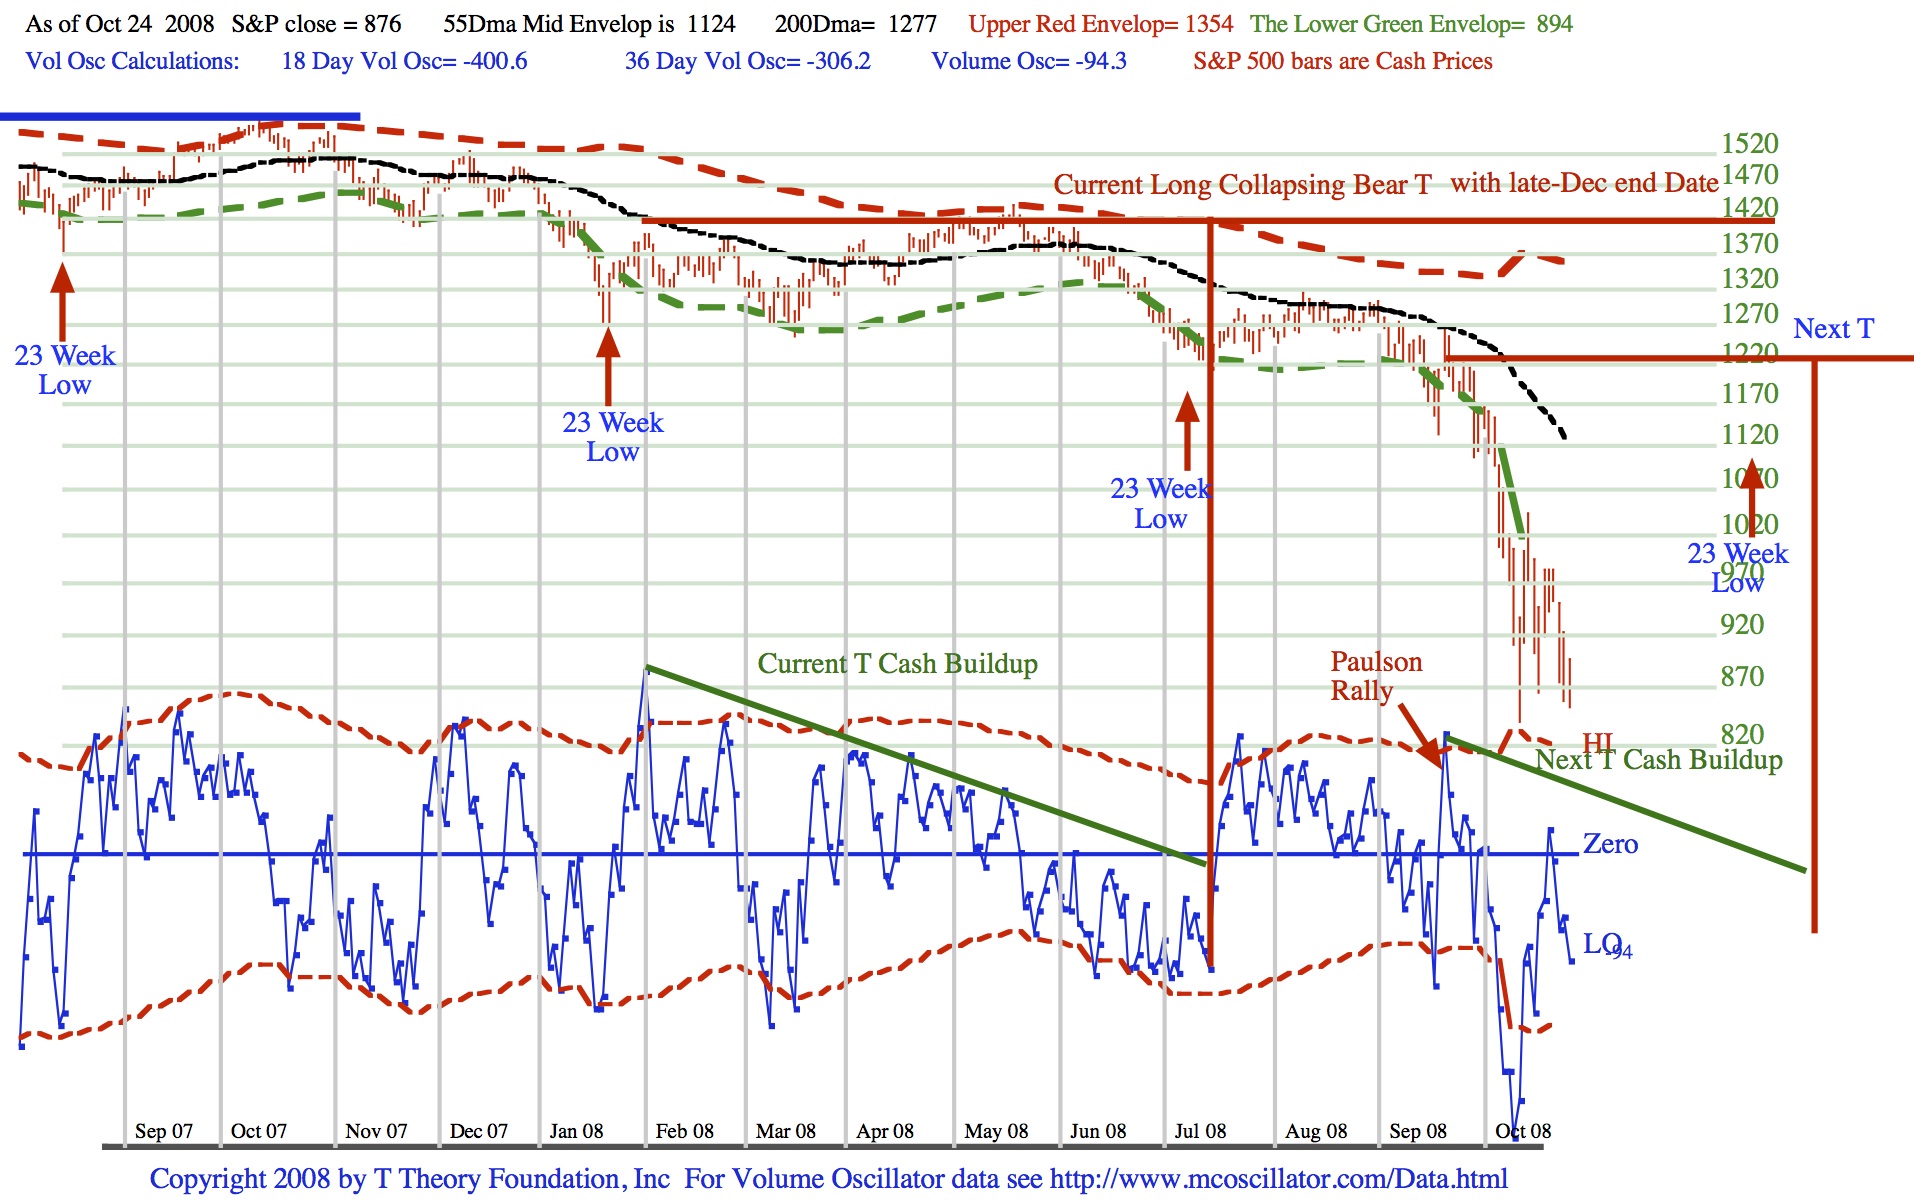
Last week I discussed the 23 week cycle and the likelihood it would extend the current steep decline into early December. This week that same forecast can be seen from the current chart which diagrams the long time span of a collapsing Bear type of T. Bear Ts are common in down trends and permit an ongoing decline to continue into the right side of a T.
In this bear market the green cash build up period lasted almost 5.5 months making this a very long T which puts the projected right end date in mid December near the 23 week cycle low as noted in last weeks chart. Once a Bear T collapses in its right side, the best recovery rally usually only occurs in the one to three weeks just prior to the T’s projected peak date at the right end. This implies that the oversold rally into the mid December projected peak date will be the more important one and the current rally will fail as soon as the market becomes very short term overbought.
The overbought condition for the very short term may take the form of a blue volume oscillator reading that has gone positive, that is above the Blue Zero level or it may not become overbought until the S&P has regained about 50% of the decline from the August peak. The oscillator will turn positive this week and I estimate the 50% retracement is about 1070 on the S&P 500. Beyond this criterial we will have to wait out this weeks activity.
Update for October 13
Download the current PDF file for the updated daily chart.
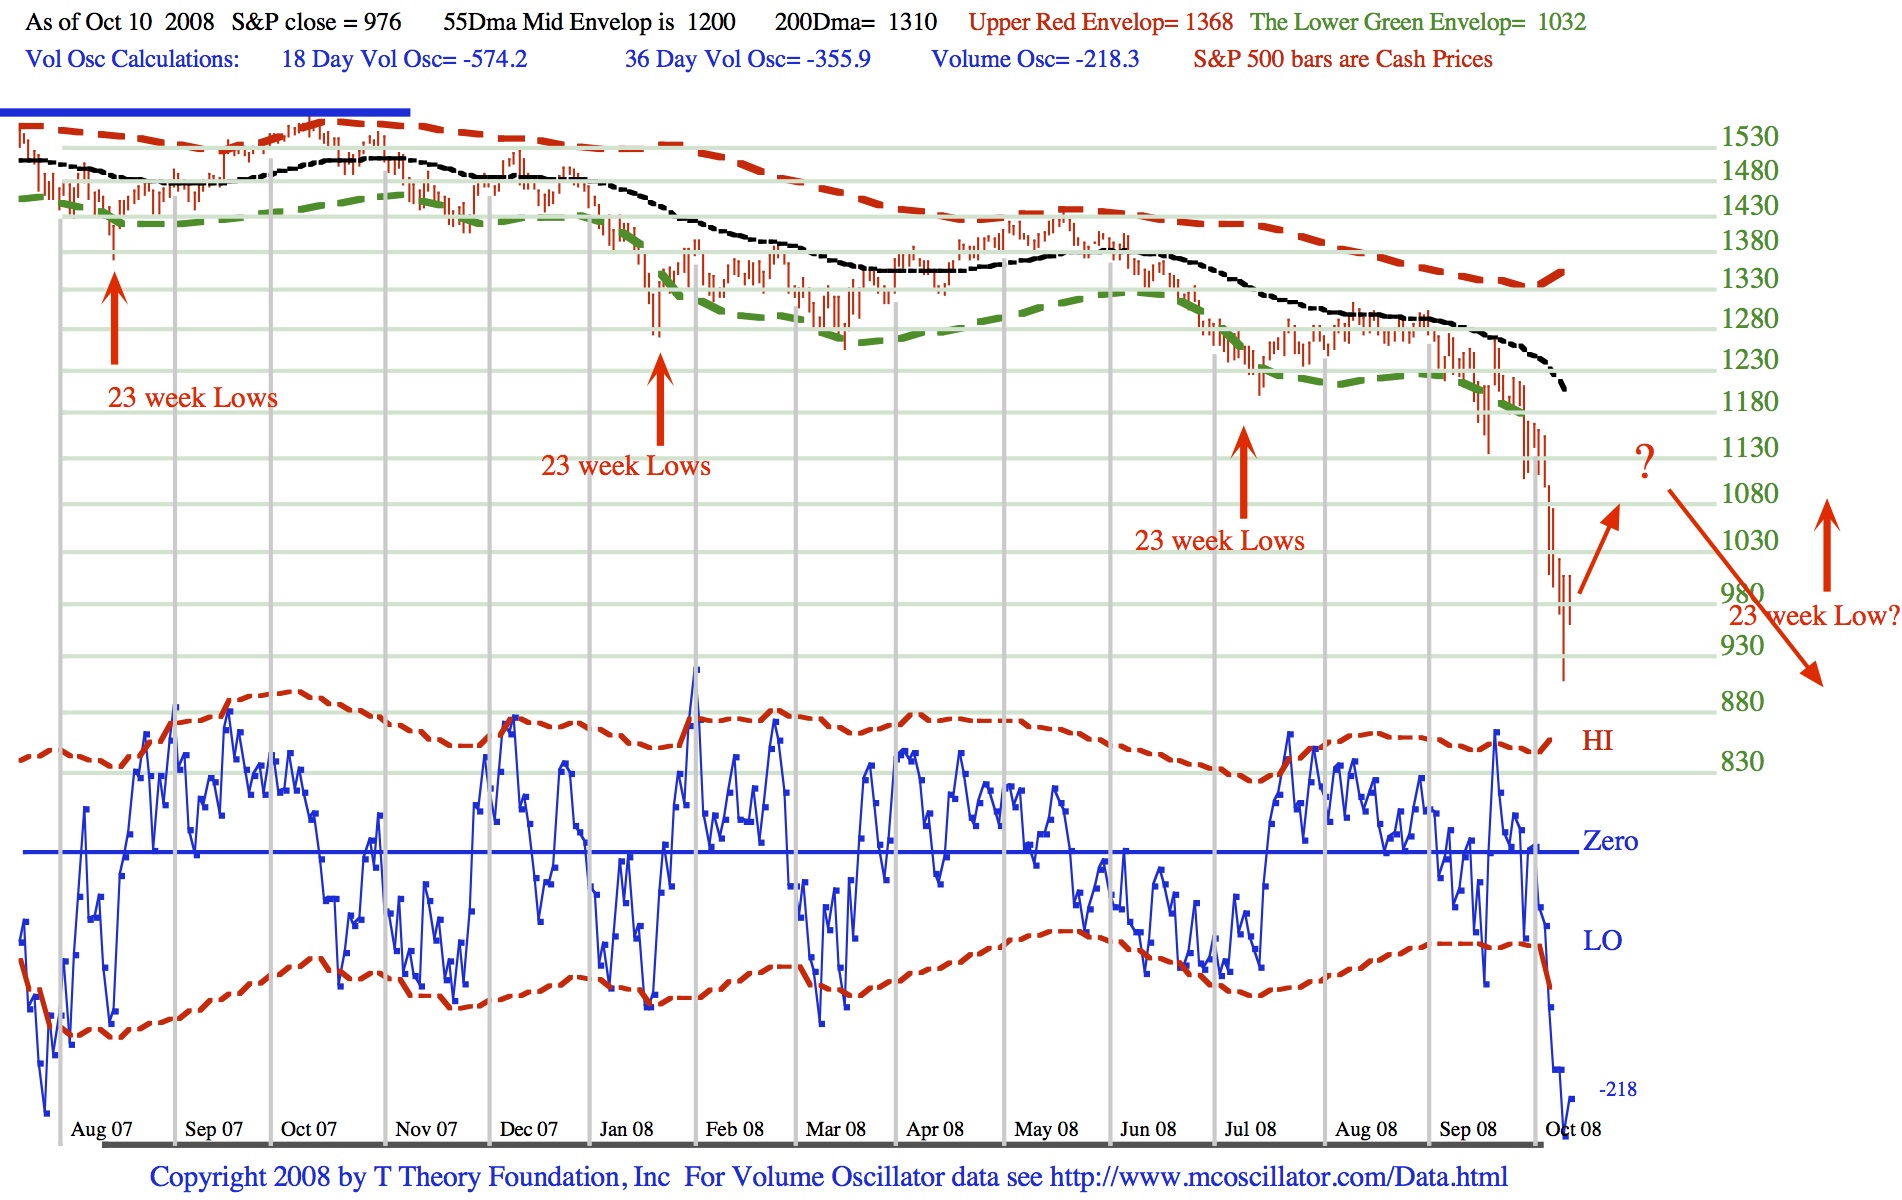
In this weeks chart we are seeing the 40 year cycle’s wrath as it sets an ongoing course for the greatest destruction of equity since the Great Depression. My basic long term forecast is targeting a low at Dow 4300 sometime during 2010. This projection comes from an analysis of the 1930’s data in the table introduced at the beginning of October. I will cover this conclusion in a later report.
Shorter term I have emphasized the 23 week cycle’s projection of lows at roughly 5 month intervals in the S&P upper plot by the red arrows. As I have discussed in prior reports it appears that this bear market is being dominated by a combination of a 15 week cycle and a 23 week cycle as viewed by the blue volume oscillator’s oversold pattern. The 15 week cycle is now likely bottoming and a normal recovery would retrace about 50% of the steep slide. It would be bearish however if this normal recovery cannot be fulfilled as the larger and stronger 23 week cycle is still turning down into a later, lower low, and the 40 year cycle’s down phase is very dominant right now.
One final point on these two cycles. The 23 week cycle low estimate derived from the volume oscillator looks to late November, but if those lows are transfered to the S&P pattern above as I have done with the red arrows pointing to the actual S&P lows, then mid December is probably the better estimate for an eventual low and beginning of a year end rally.
We need to see how the recovery proceeds next week before going on with my recently expanded T Theory analysis derived from the daily history of the 1929-32 40 Year Cycle decline and it companion 40 Year Cycle, the 1973-74 decline. The key will be to see how the market performs after the sharp up day on Monday and a probable carryover into Tuesday. The question beyond this reflex trading rally is whether longer term investors will still be interested in buying and thereafter how their day to day actions compare with similar oversold rallies during the 1929-32 and 1973-74 period.
Update for October 6
Download the current PDF file for the updated daily chart.
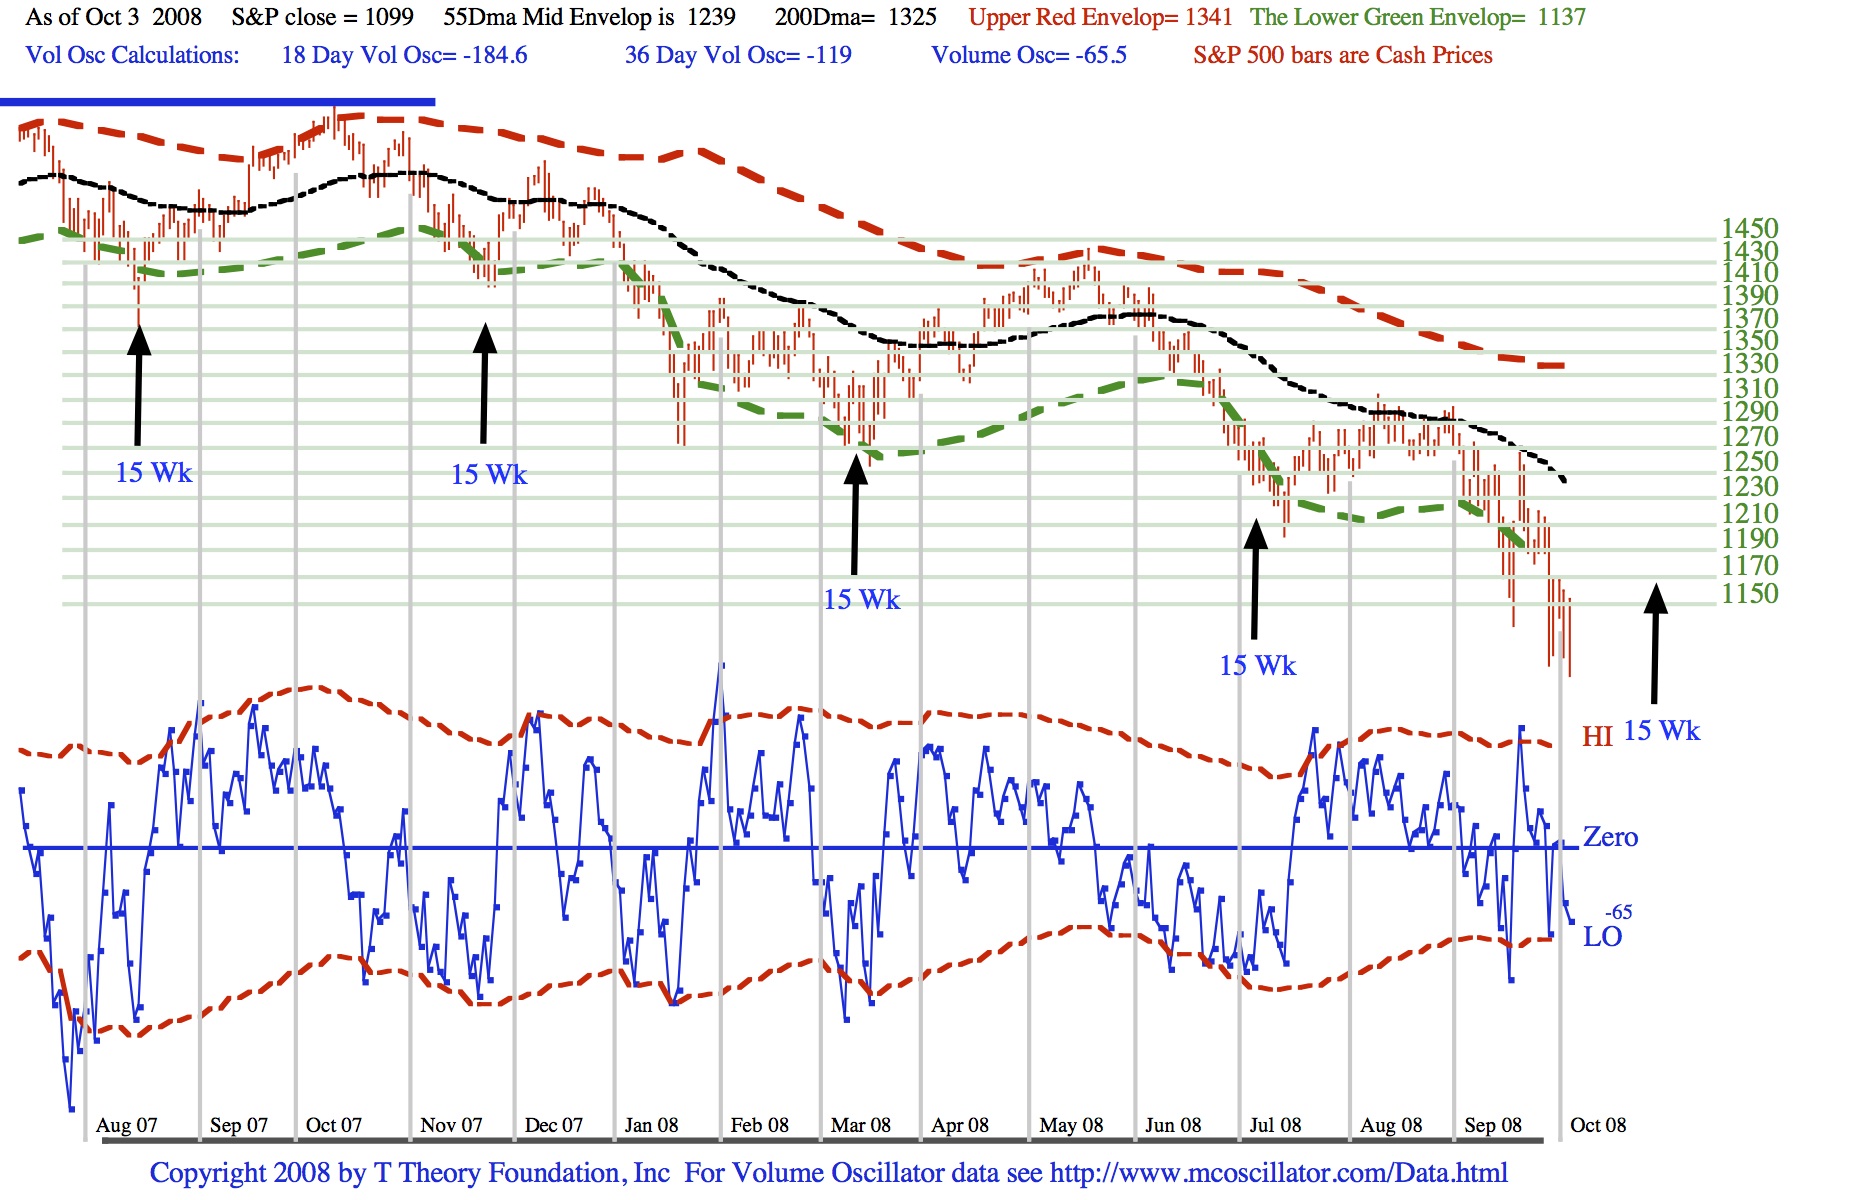
Note the Arrows identifying the approximate 15 week lows discussed in an earlier post. We should start to see a bottoming process in the next week or two if the progression holds. But the situation is more complex, as explained in my earlier posting, by the concurrent 23 week cycle which is pressing for a lower low in late November.
All cycles considered, I believe a that as we pass mid October, some sort of 3-5 day rally will occur, but it will just produce a short sharp bounce back up towards the 55 day MA. Then very quickly the market should move down to new lows into late November.
****************************************************************************************
All Rights Reserved By The T Theory® Foundation ©
Order the T Theory® Encyclopedia
For a complete understanding of the T Theory® and how to successfully use Terry’s unique methods, order the Encyclopedia from Paula at the above link. There is additional material in the encyclopedia not covered here. Paula will be more than happy to answer your questions too.
Many thanks to Paula Burke for her permission to re-post Terry’s old T Theory® explanations. The period re-blogged on these pages are some of Terry Laundry’s best work and was published here from public domain.
****************************************************************************************
I claim no credit for the material found under T Theory® on this blog. All of this material is the creation of Terry Laundry and was downloaded from Terry’s free blog site (TypePad). I have created a mirror of Terry’s original material and now there is a second site containing Terry’s T Theory®. One or both of these websites hopefully will survive through time as Terry’s material is too important to be lost to the ravages of time. This site is simply a memorial to his lifetime work.
The page content re-blogged here is exactly as Terry created on his original webpages (saved on my computer with ScrapBook)). Nothing has been left out from the period Dec 2003 to June 2011. From Terry’s site, I made a lot of formatting changes, creating a more easily readable webpage appearance. The PDF chart duplicates of the JPEGs have been omitted for ease and speed of recreating Terry’s pages. References to PDF charts should be ignored (but no chart was left out).
After June 2011, Terry created a paid subscription website. None of that material is found here.
There were many many, many hours spent on this project; downloading Terry’s individual charts & audio files, followed by the uploading of Terry’s charts and audio to my WordPress blog library, after which I had to insert the uploaded material into my new T Theory® webpages (hopefully in the correct places). This was a dull and arduous project and I hope you enjoy it. I don’t believe there remains any more of Terry’s material in free domain, so my T Theory® project is probably finished. If I’ve missed something, you can leave me a comment.
If you find an uploaded reference error (chart or audio in the wrong place), please note the month and year of the webpage, plus the exact name of the referenced error file. Include any other info that will help me locate the problem file and where it occurs on the webpage. Leave a comment for me with the info and I’ll fix it.
Terry’s material is very long and will take many weeks for you to finish. Don’t hurry, it’s not a marathon and you will absorb more if you go through it at a reasonable rate. This is especially true for those who don’t invest in the T Theory® reference encyclopedia. The encyclopedia is a written reference for T Theory® and includes everything of importance for Terry’s T Theory®. Without the reference encyclopedia you must depend on your memory and Terry’s method carries some rules that you could easily violate. The encyclopedia also includes new information never seen on his website.
You are welcome to save any or all of my blog material to your computer. You also have my permission to re-blog my information, but you must (1) credit me and my blog in an obvious manner and (2) don’t change my material.
FYI – I find the best way to save a webpage is using “ScrapBook” (it’s an add-on for the FireFox browser). ScrapBook saves a webpage to your computer EXACTLY as it appears on the day you saved it. You can’t tell the difference between the internet webpage and your ScrapBook saved webpage. The saved pages are not pictures. Instead the pages consist of HTML and page functionality remains identical on your computer. There is also a second method for using ScrapBook, where you can save all of the webpages down to a defined link depth. This optional method means all links will function on your computer to the link depth specified (meaning you can click on links on your saved webpages and tunnel down into pages within pages). Saving the normal way will only save the top webpage but the links that exist could continue to function by taking you to the website on the internet instead of on your computer. But sometimes the linked website doesn’t exist anymore. I’ve had this happen on some very good webpages with unique information (they just disappear into the internet void). That’s a bummer when you lost some really good info and thus rose my need for ScrapBook. You can also filter the pages saved using the optional ScrapBook method, which can exclude all pages not coming directly from the specified website (filtering is recommended using this method otherwise you wind up with a LOT of useless stuff).
.
Explore posts in the same categories: . . . T Theory®
Leave A Reply