November 2008 – T Theory® Update

T Theory Observations for November 2008
Update for November 24 2008
Download the current PDF file for the updated daily chart.
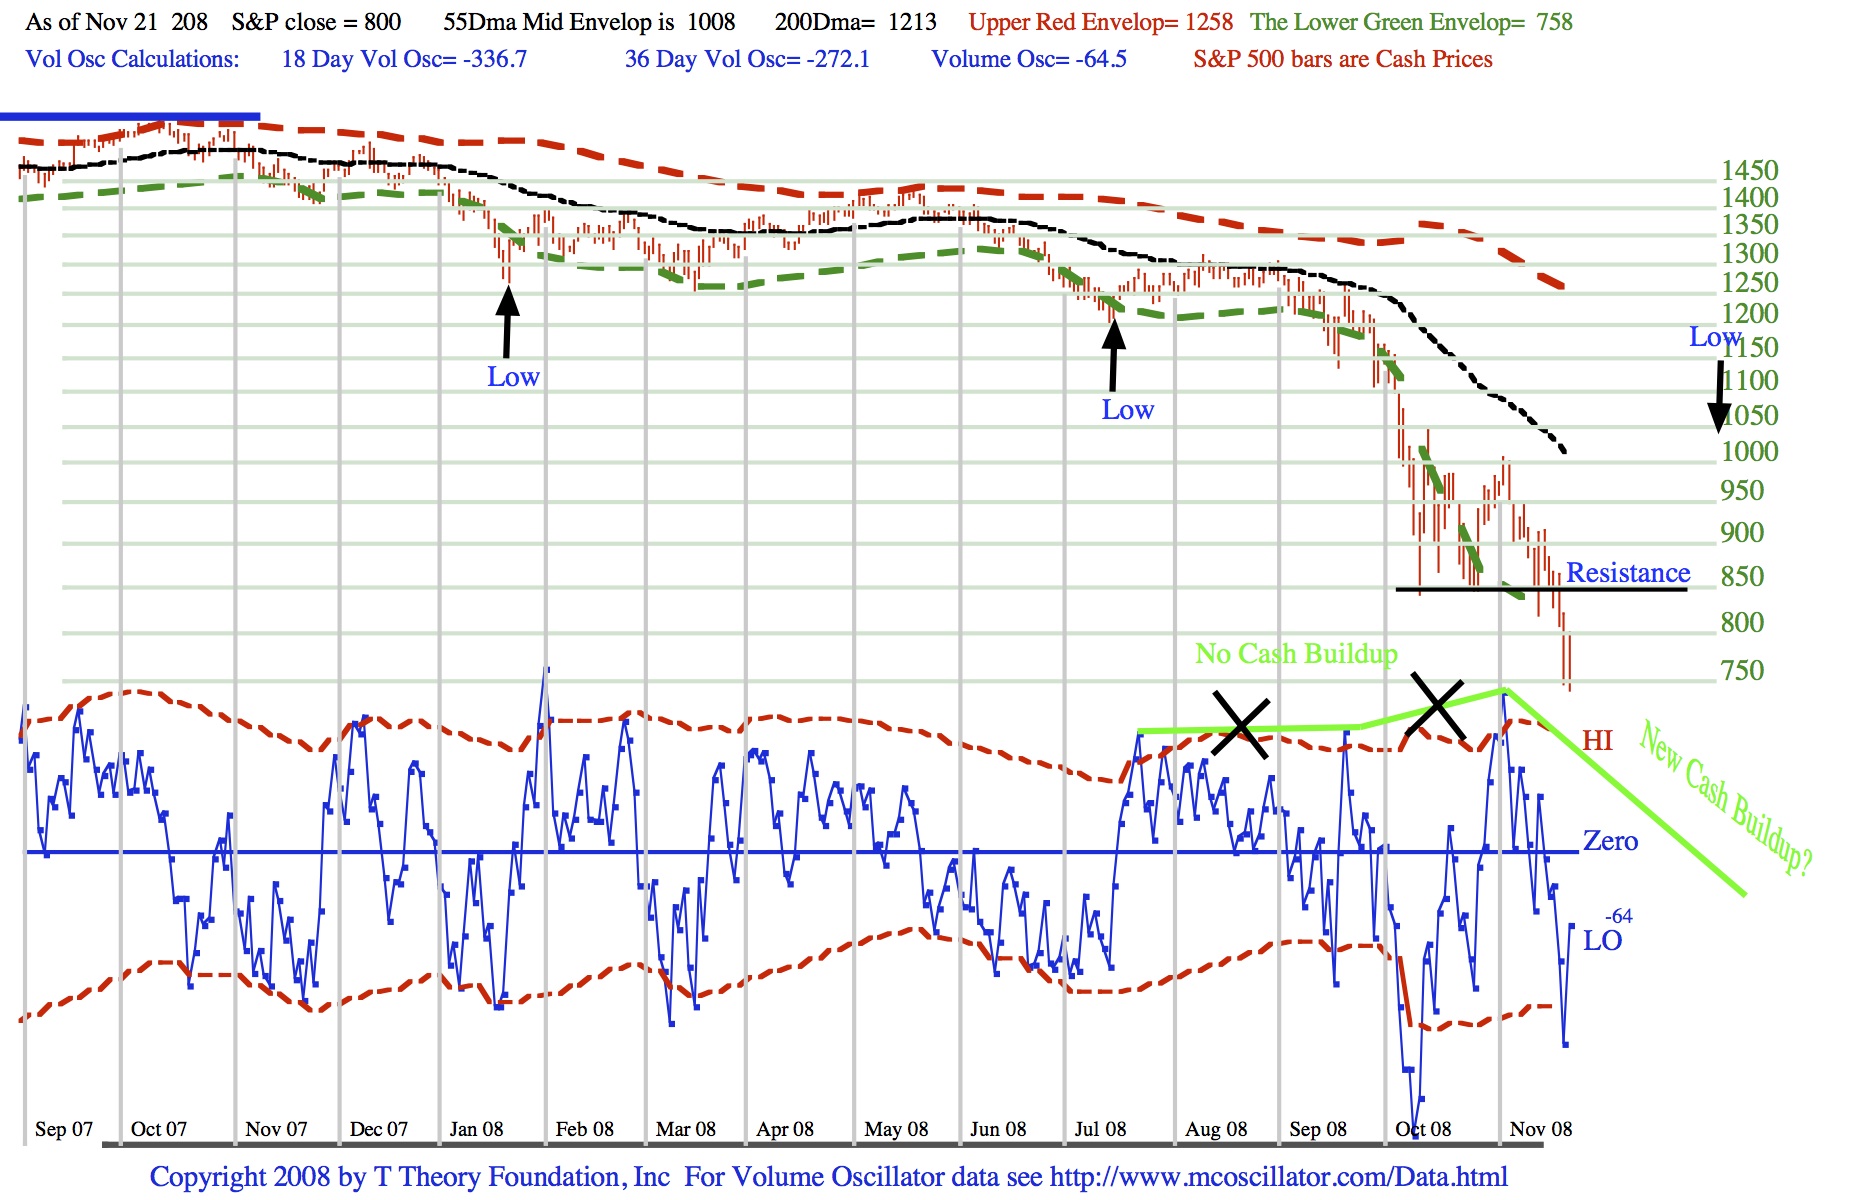
Note the S&P 500 has broken below the October double bottom as expected. These bottom levels will now become upside resistance for all future rallies.
This is predictable in T Theory because there was no Cash Build Up during the August September October period. The basic tenet of T Theory is that all sustainable advances in the market averages must be preceded by a Cash build up phase, and in the daily chart, a suitable new Cash Buildup needs to be identified by a declining tops pattern in the blue volume oscillator. I usually identify them with a green downward sloping line. The green lines that have been “X”ed out in the current chart are not descending so one could conclude the rallies in that period were depleting traders buying power thereby leaving the market vulnerable to a new decline. In time but maybe not until the new year, a new Cash Build up can me indicated as noted at the lower right.
It appears we have plenty of time to watch for the further developments. The nominal 23 week cycle appears to be running long and the black arrowed lows in the S&P plot suggest the next low might not occur until well into December. Friday’s rally is likely to carry a bit further but should fail and new lows follow.
That new lower low could be more interesting and I will address that issue in next Monday’s update.
Update for November 17 2008
Download the current PDF file for the updated daily chart.
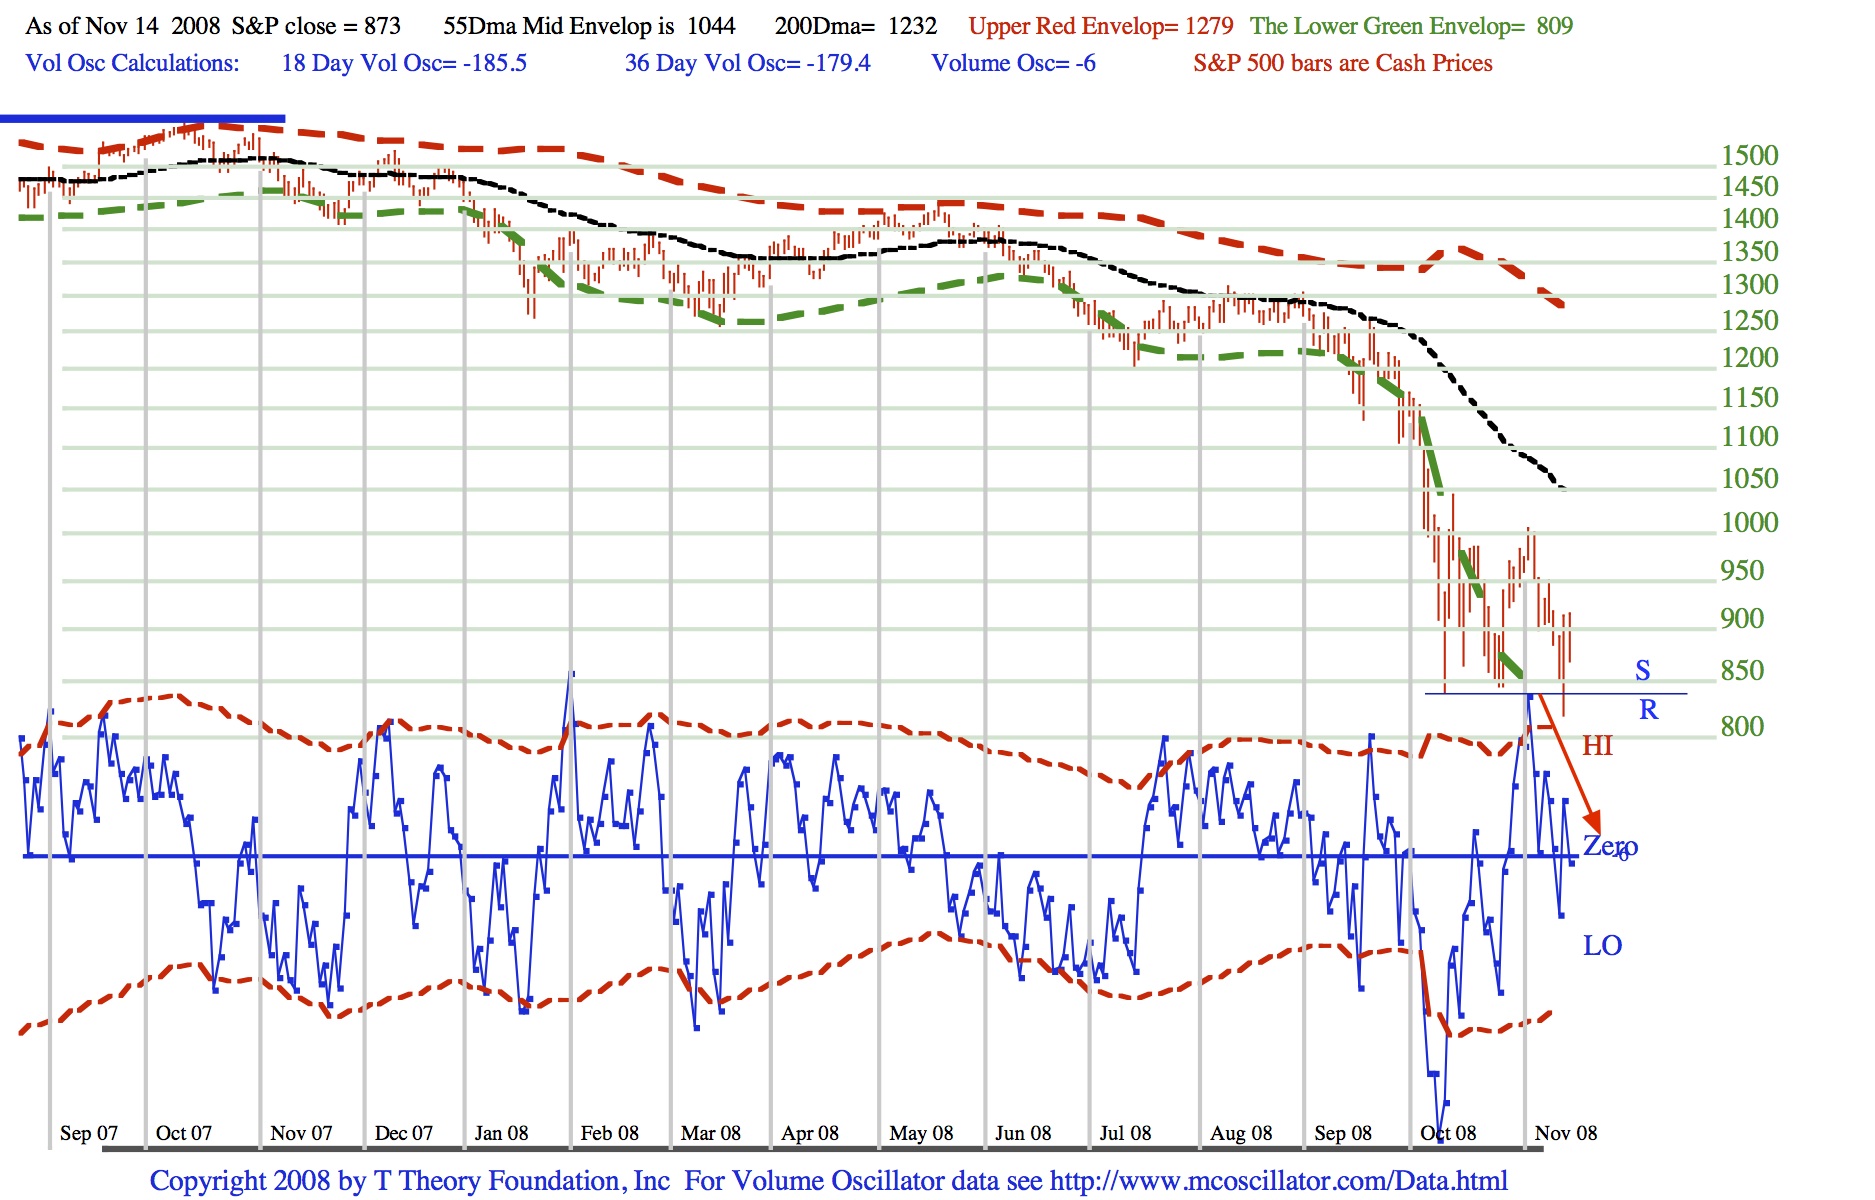
The outcome was certainly bizarre for the double bottom T that called for a peak around mid November plus or minus as described in last week’s update. The end of day peaking on the 13th and retest during the later part of Friday the 14 was probably the best that could be accomplished considering the extremely negative news background.
I consider the pattern ending Nov 14 to be bearish because the 23 week cycle should now push the S&P below what might be construed as a blue Support level noted in today’s chart, and if broken, will become a new upside Resistance level to the rally that is likely in later December.
Next week I will need to see if the breakdown does indeed occur. Then we can move on to see if market heads down to the projected 23 week cycle low located in the late November to early December time period.
Before presenting my new detailed technical analysis, let me summarize ongoing projects. In my earlier months posts at this site I have tabulated all bear markets since 1926 and noted that the 40 year cycle which I discovered in the 200 year chart, calls for the current bear market to be especially severe along the lines of the two resulting great bear markets in this century; the 1973-74 decline and the 1929-32 decline. In time I will study the daily trends for all bear markets but I have made the preliminary study of these two severe cases and have reached some worthwhile conclusions.
These two bear market’s have the common thread of ongoing sharp declines to new low followed by a partial recovery (often 50%), then a new topping and then resumption of a steep decline to new lows once again. This pattern can most readily be interpreted with the help of the 55 day MA which plotted in black on today’s chart. Basically in the milder 1973-74 decline recoveries halted at the 55 day MA like we see in August 08. In the more severe 1929-32 decline the 55 day MA was falling more steeply and the recovery would generally pop just above the 55 day MA by a percent or so. So for this bear market I think a general rule of thumb is any current recovery is likely to peak at or just above the 55 day MA come December.
Note this process is usually accomplished over time, not suddenly. In severe bear market the rallies are usually very erratic and labored. This delay in lifting allows the 55 day MA to fall lower and set up the intercept point at lower levels.
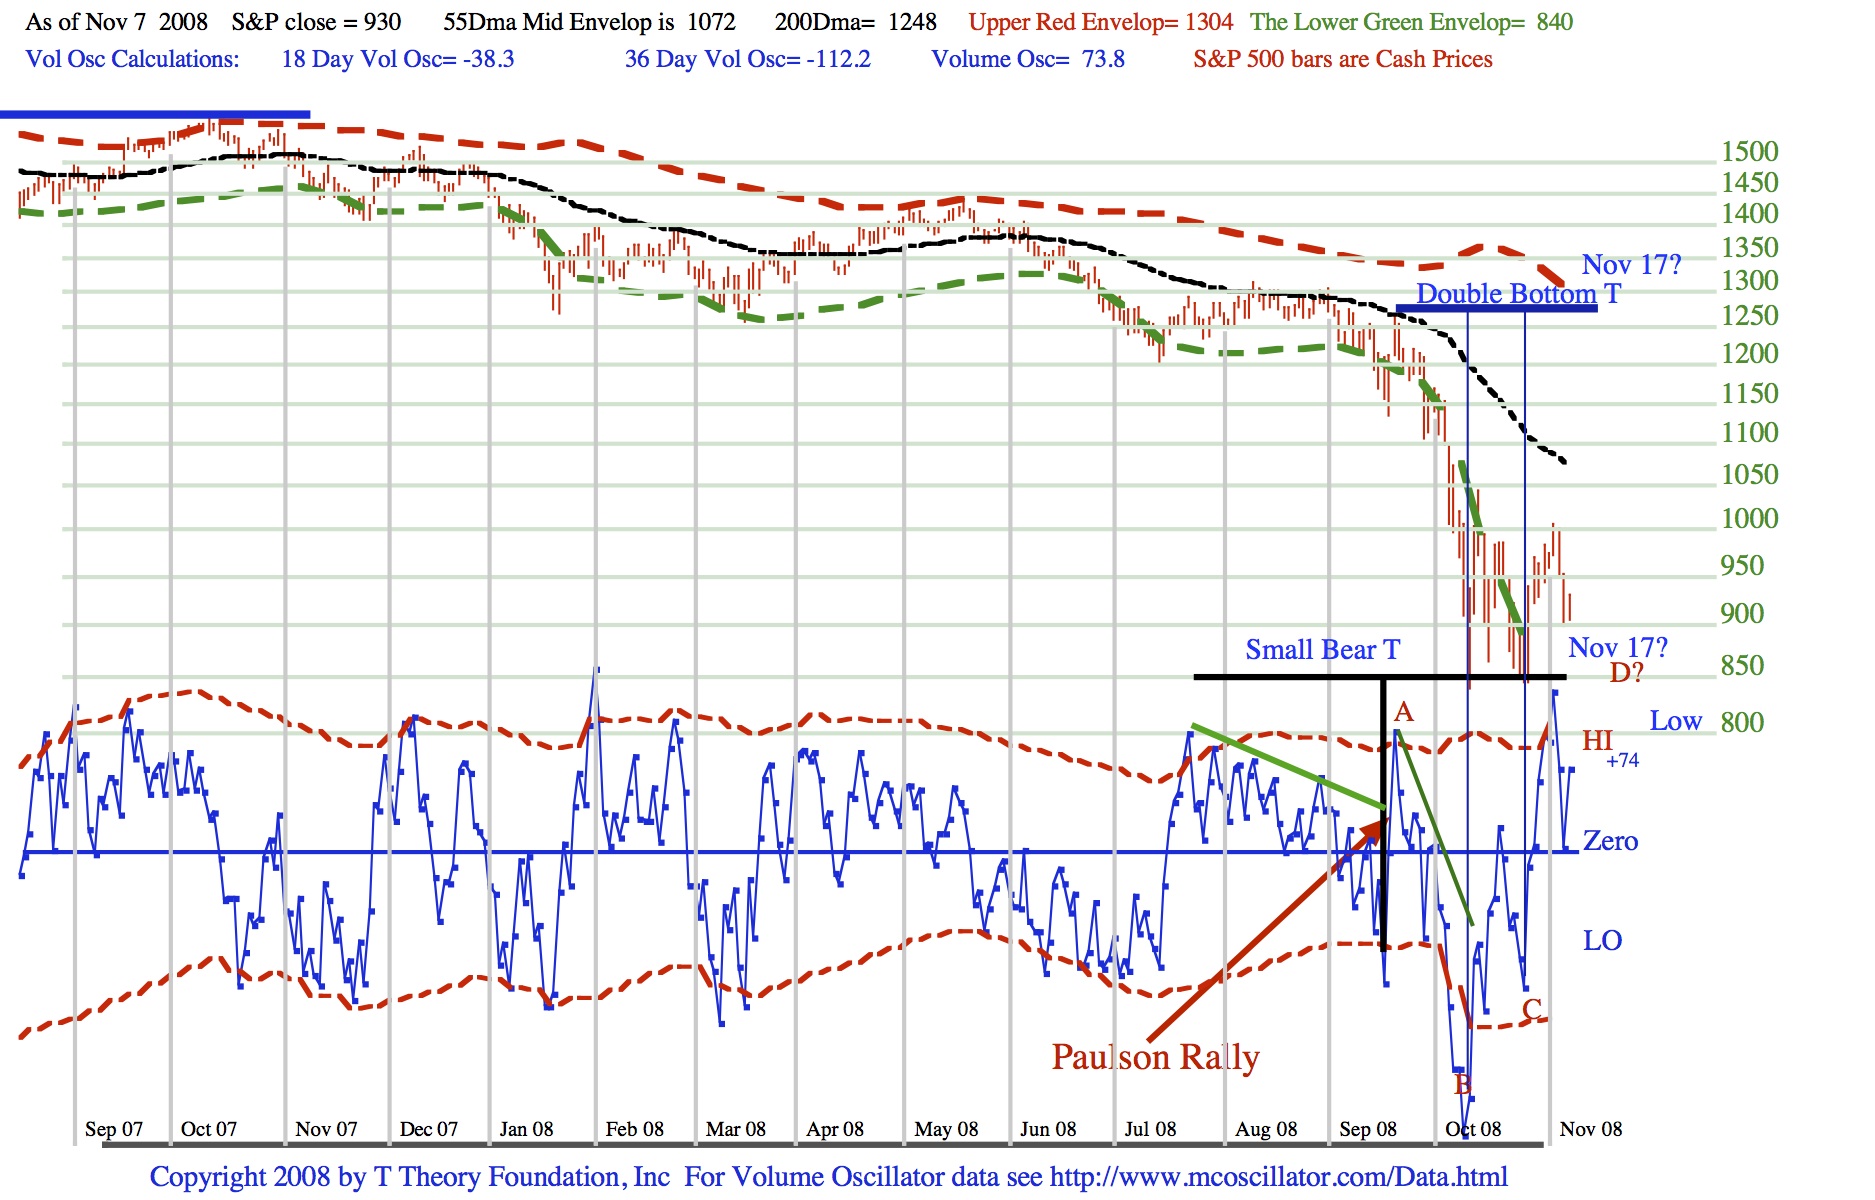
In Friday’s oscillator plot I have shown two small T interpretations with a third to be constructed probably in early December. These are complicated and not completely accurate as far as projected peak dates are concerned but I did the analysis and thought it might be interesting to make a few brief comments. The interpretation from August ’08 to Nov 17, the next projected peak can made by the two small classic T types sketched in the volume oscillator. The first is a classic bear type T formed by the Paulson Rally. The green cash build up is conventional and the Ts time symmetry calls for an early November peak. Its collapse in the right side is normal in bear markets and Nov 5 was probably its peak date.
The second T is a classic double bottom T and is nearly always reliable. It acts to extend the recovery into Nov 17, or maybe just Friday the 14th. We have used this T construction before and examples can be seen in the archives. For this kind of T the green cash build up is only counted from the peak at A to the first low at B. The rally from the second low at C is then projected to last a matching time which computes to November 17. The steepness of the decline over this period usually leads to an early peak, so I wouldn’t relay too heavily of the Nov 17th date.
Moving on, we are presuming a low at the end of the month based on the 23 week cycle discussed earlier. This should set up a third cash build up for a new T which we can work on to complete the series. It will be interesting to see what the late November correction might look like. The market should be overbought by mid November and the 23 week cycle has had a good record of forcing key lows. Once that data is in we can work out the next Ts projection for a December peak.
Finally I look forward to the next few weeks to answer the most difficult theoretical dilemma I have seen in many decades. How can the very long spanning collapsed T, featured in my Oct 20 Update, which is generally reliable, and calls for a peak near the third week of December, compete with the very opposed, and generally reliable 23 week cycle which calls for a major low in the late November to mid December period?
The conflict between these very close time projection involving key highs vs lows is either phony, because one of the concepts is flawed, or alternatively, there are some very conflicting developments going on in the “real world” which will shock the market into a bizarre scenario. I suspect we are going to see some rather bizarre and conflicting news over the next few weeks, so it is a good time to relax and watch the action for clues.
Update for November 3 2008
Download the current PDF file for the updated daily chart.
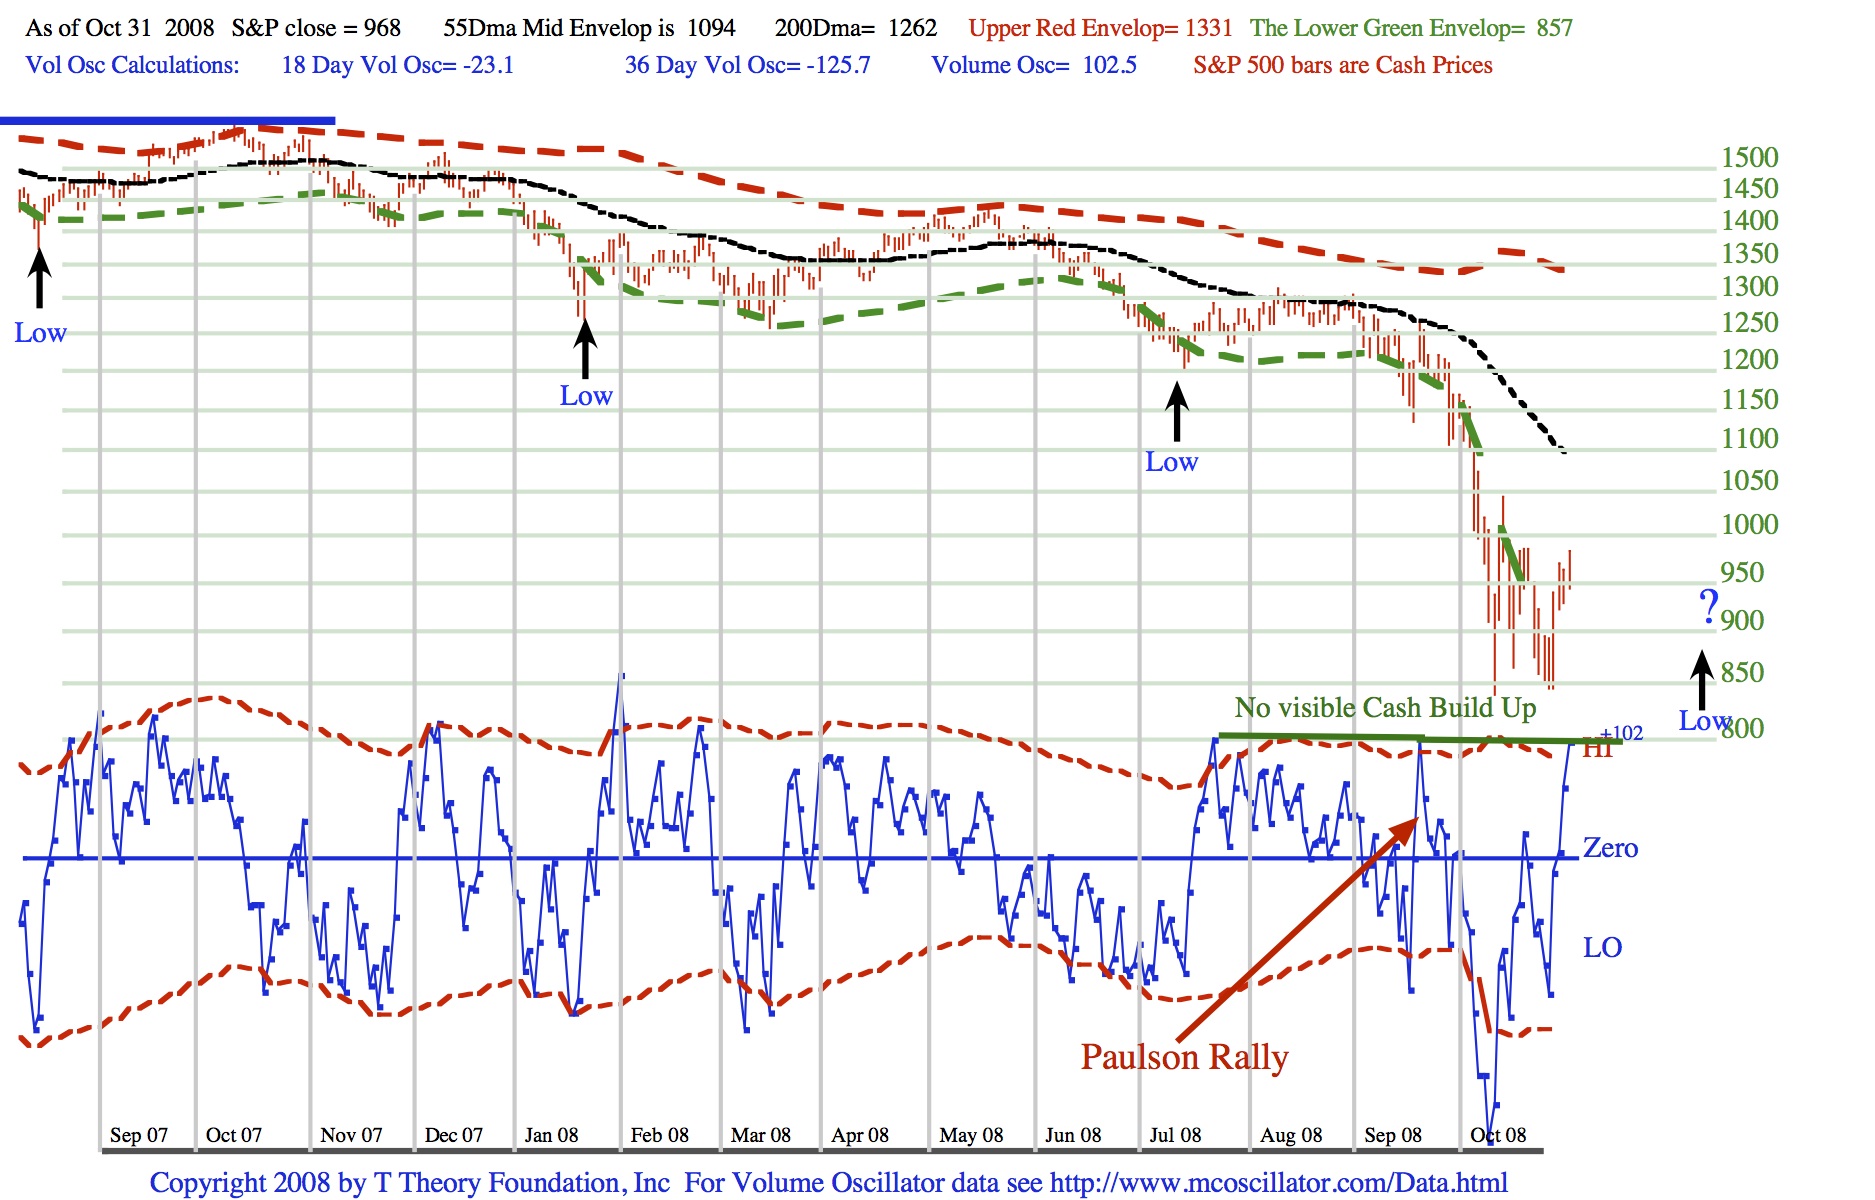
As noted in this week’s chart there is the unusual pattern of flattened volume oscillator peaks that can not form a cash build up phase, that is there is no declining tops in the oscillator, to act as the left side of a new T as I had sketched in last week’s projection. In the past this has been a long term negative although the strength to get the oscillator up so high was probably welcomed by investors near term.
Now that the oscillator has reached an overbought level the S&P should begin topping then turn down to the major 23 week cycle low noted by the black arrows. There is some uncertainty in this low date but we can deal with that later.
****************************************************************************************
All Rights Reserved By The T Theory® Foundation ©
Order the T Theory® Encyclopedia
For a complete understanding of the T Theory® and how to successfully use Terry’s unique methods, order the Encyclopedia from Paula at the above link. There is additional material in the encyclopedia not covered here. Paula will be more than happy to answer your questions too.
Many thanks to Paula Burke for her permission to re-post Terry’s old T Theory® explanations. The period re-blogged on these pages are some of Terry Laundry’s best work and was published here from public domain.
****************************************************************************************
I claim no credit for the material found under T Theory® on this blog. All of this material is the creation of Terry Laundry and was downloaded from Terry’s free blog site (TypePad). I have created a mirror of Terry’s original material and now there is a second site containing Terry’s T Theory®. One or both of these websites hopefully will survive through time as Terry’s material is too important to be lost to the ravages of time. This site is simply a memorial to his lifetime work.
The page content re-blogged here is exactly as Terry created on his original webpages (saved on my computer with ScrapBook)). Nothing has been left out from the period Dec 2003 to June 2011. From Terry’s site, I made a lot of formatting changes, creating a more easily readable webpage appearance. The PDF chart duplicates of the JPEGs have been omitted for ease and speed of recreating Terry’s pages. References to PDF charts should be ignored (but no chart was left out).
After June 2011, Terry created a paid subscription website. None of that material is found here.
There were many many, many hours spent on this project; downloading Terry’s individual charts & audio files, followed by the uploading of Terry’s charts and audio to my WordPress blog library, after which I had to insert the uploaded material into my new T Theory® webpages (hopefully in the correct places). This was a dull and arduous project and I hope you enjoy it. I don’t believe there remains any more of Terry’s material in free domain, so my T Theory® project is probably finished. If I’ve missed something, you can leave me a comment.
If you find an uploaded reference error (chart or audio in the wrong place), please note the month and year of the webpage, plus the exact name of the referenced error file. Include any other info that will help me locate the problem file and where it occurs on the webpage. Leave a comment for me with the info and I’ll fix it.
Terry’s material is very long and will take many weeks for you to finish. Don’t hurry, it’s not a marathon and you will absorb more if you go through it at a reasonable rate. This is especially true for those who don’t invest in the T Theory® reference encyclopedia. The encyclopedia is a written reference for T Theory® and includes everything of importance for Terry’s T Theory®. Without the reference encyclopedia you must depend on your memory and Terry’s method carries some rules that you could easily violate. The encyclopedia also includes new information never seen on his website.
You are welcome to save any or all of my blog material to your computer. You also have my permission to re-blog my information, but you must (1) credit me and my blog in an obvious manner and (2) don’t change my material.
FYI – I find the best way to save a webpage is using “ScrapBook” (it’s an add-on for the FireFox browser). ScrapBook saves a webpage to your computer EXACTLY as it appears on the day you saved it. You can’t tell the difference between the internet webpage and your ScrapBook saved webpage. The saved pages are not pictures. Instead the pages consist of HTML and page functionality remains identical on your computer. There is also a second method for using ScrapBook, where you can save all of the webpages down to a defined link depth. This optional method means all links will function on your computer to the link depth specified (meaning you can click on links on your saved webpages and tunnel down into pages within pages). Saving the normal way will only save the top webpage but the links that exist could continue to function by taking you to the website on the internet instead of on your computer. But sometimes the linked website doesn’t exist anymore. I’ve had this happen on some very good webpages with unique information (they just disappear into the internet void). That’s a bummer when you lost some really good info and thus rose my need for ScrapBook. You can also filter the pages saved using the optional ScrapBook method, which can exclude all pages not coming directly from the specified website (filtering is recommended using this method otherwise you wind up with a LOT of useless stuff).
.
Explore posts in the same categories: . . . T Theory®
Leave A Reply