December 2008 – T Theory® Update

Terry Laundry’s T Theory Observations for 2009
This is an audio posting of new plans for 2009.
Update for December 15 2008
Download the current PDF file for the updated daily chart.
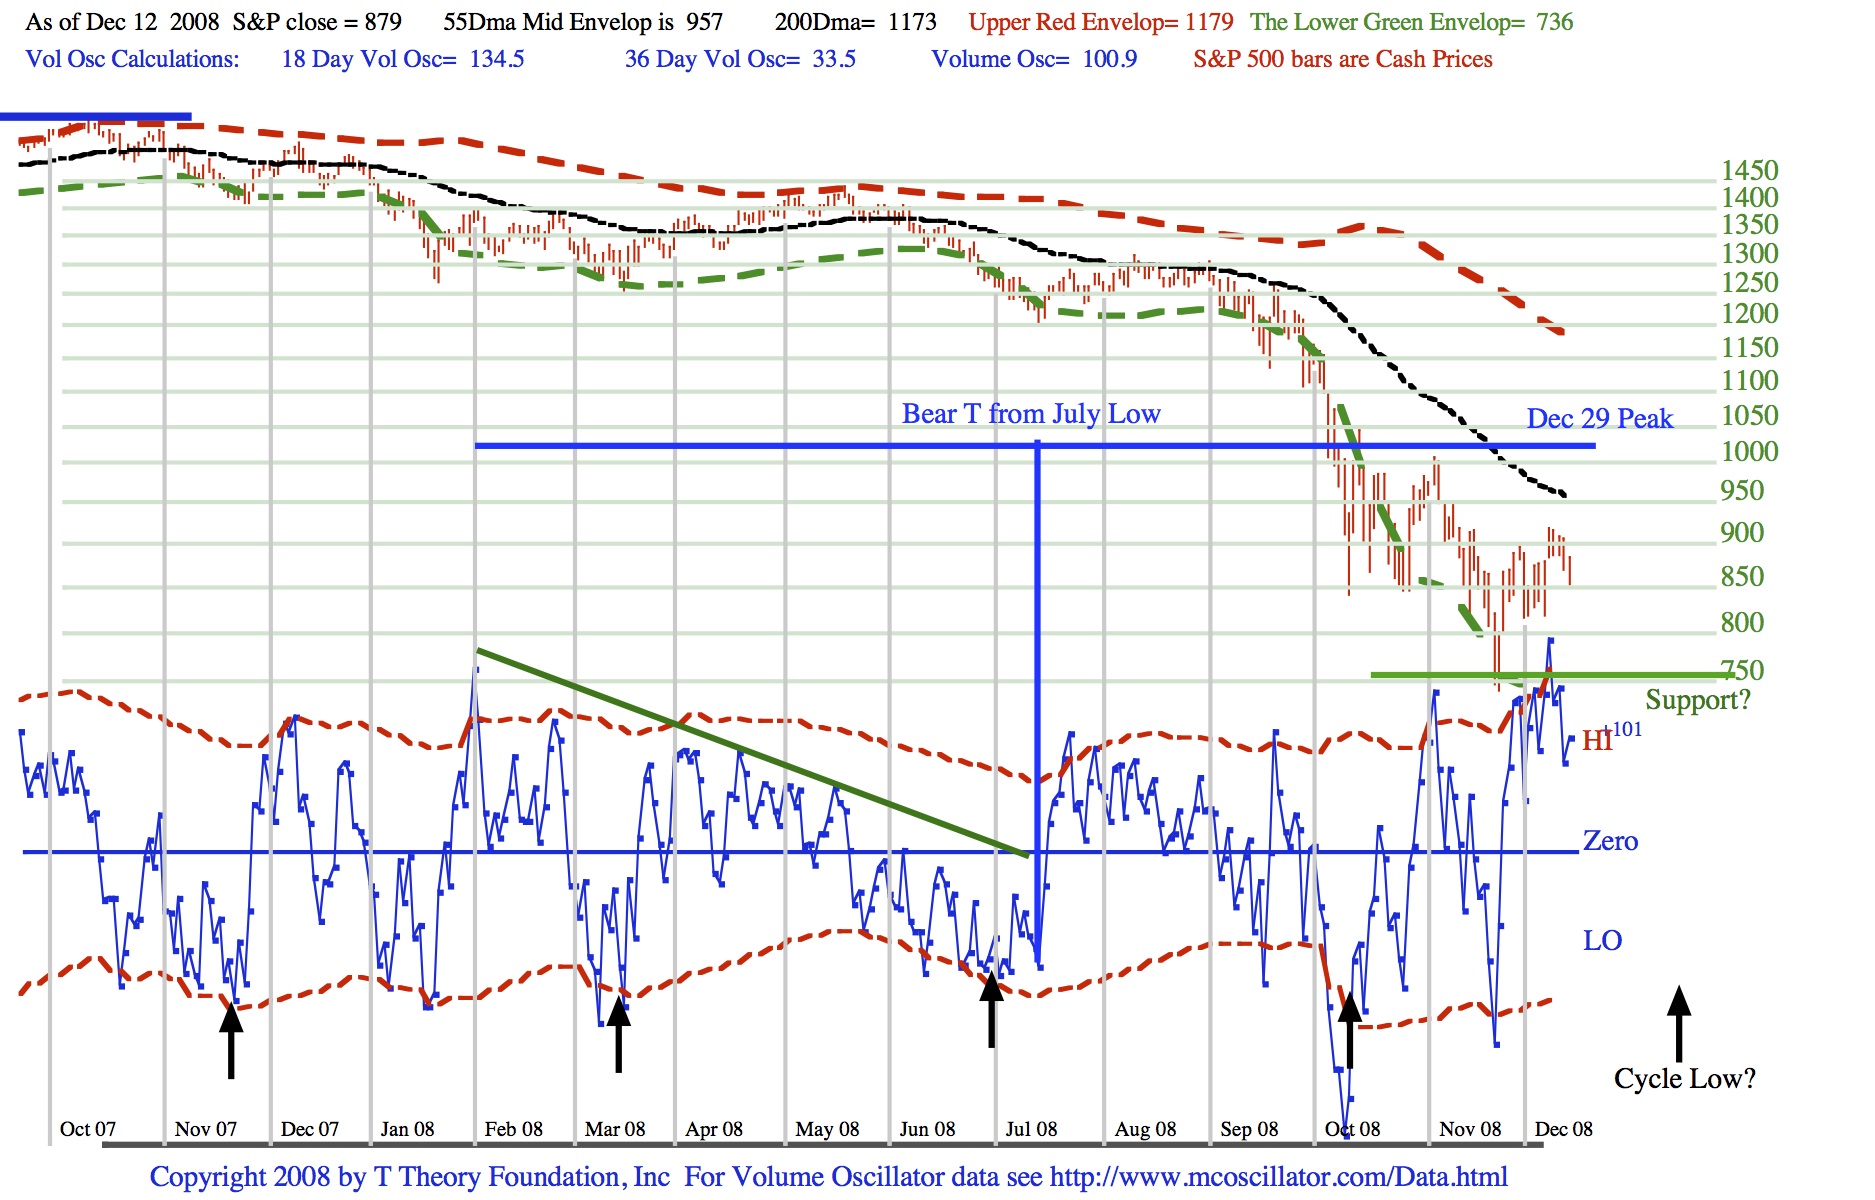
As noted in the chart we are approaching the right end peak date of this Bear T with it estimate of a December 29th peak with signs that its positive influence is temporarily over-riding the 15 week cycle lows identified here by the black vertical arrows at roughly 4 month intervals. This T agrees with the longer A-D T discussed in last week’s update and I expect the market will peak at year end then drop sharply into a mid January or later low.
The S&P should try to retest the November lows shown here by the green Support? line. A successful retest would be bullish, a failure to hold would be bearish.
This week a decline is likely from the current overbought level in the blue volume oscillator at least until it falls to the zero level. At that point a short rally should bring the S&P up to its final peak for the current T. As I will be on vacation, my next post will come after we move into the new year. Have a happy Holiday Season. Terry Laundry
Update for December 8 2008
Download the current PDF file for the updated daily chart and a second chart showing the Advance-Decline T for the 2007 to present period.
The current daily chart summarized the status for 4 collapsed Ts and their unusual situation going into year end. Basically I see the 26 Day T in the lower portion of the chart halting the current enthusiasm near term as per last week’s update, followed by a new oversold condition, then a finally rally into year end. At that point in time the longer collapsed Ts with their twin Dec 29 and Jan 2 top projections will be completed, and the market will be free to fall to a new oversold condition next year.

For a more detailed analysis lets first move on to the second chart that details the long collapsed A-D T below. While we are in the decline phase of the 40 Year cycle that I have detailed in earlier discussions, this long A-D T, or any other long time spanning T will likely collapse in the right side under the negative influence of the much greater amplitude 40 year cycle. In this second chart we see a T that spans about 1.5 years (19 months) from the AD peak June 1 2007 to a projected peak Jan 2 2009 as one example of a long spanning collapsing T. The center post of the A-D T here is defined as the last low before the AD Line breaks above a prior high i.e. mid March 2008. As noted in the chart by the horizontal red line the rally from the March low exceeded the prior February peak so the T’s center post is fixed at what becomes a minor low.
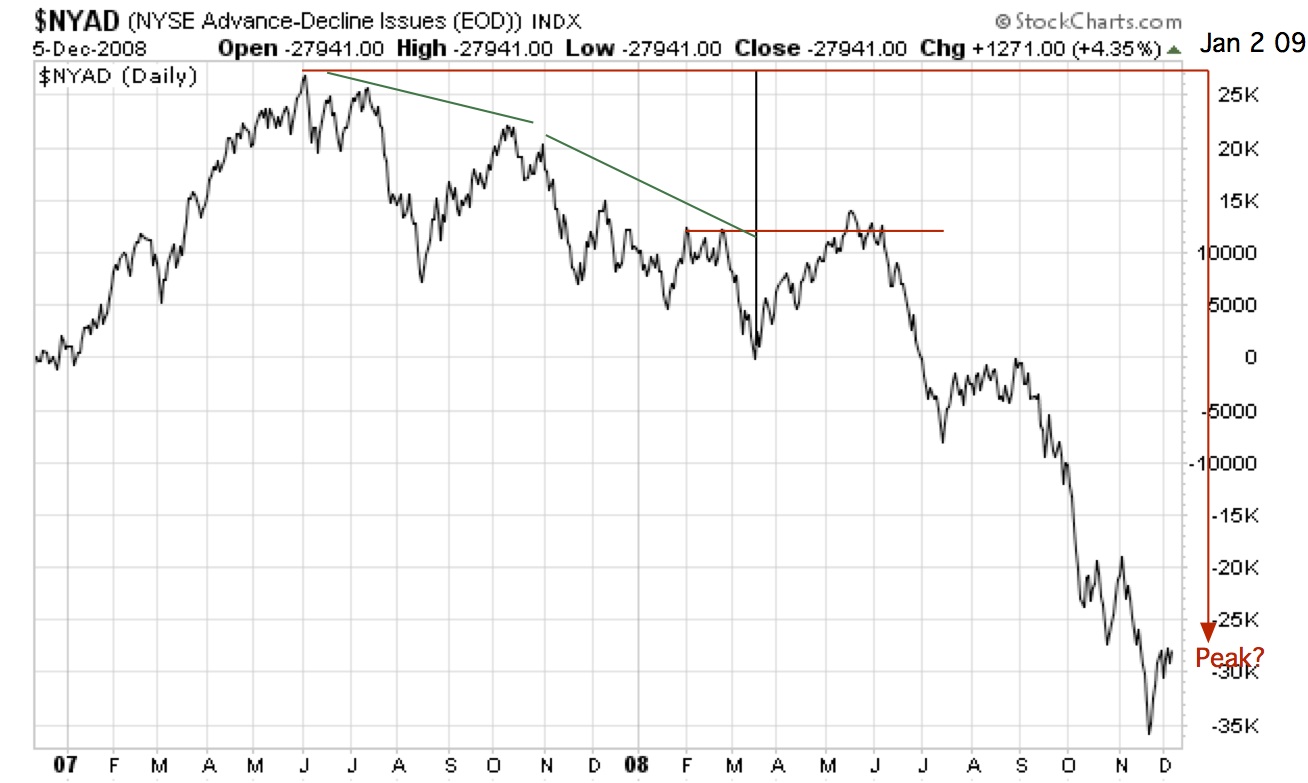
This effect is common in all bear markets but especially when the very powerful 40 year cycle exerts the downside force. Even so, all Bear or collapsing type T’s generally some sort of rally into their projected peak date. However the rally may only last a few days and it generally only amounts to spurt of short covering. There is a separate long spanning T of the same type that I am not showing today but it independently points to a Dec 29th peak. So there are two long collapsed Ts at work which makes this an interesting example and I will make a more complete summary of their outcome later next year.
With this in mind the natural question is whether or not the market might not chose to rally directly from now to this end of year projection. The short answer is no. The reason is that the two small spanning Ts in the daily chart are also collapsed type Ts (that is they have lower lows in their right side) and so their projected peak dates should be just as valid as the Jan 2 projected peak from the longer collapsed T. As I pointed out earlier this is a very interesting situation which provides a good test for T Theory.
From a practical matter, T Theory just says the 26 Day T, which is a collapsed T with a projected peak on December 3, should, despite the current enthusiasm, still force a decline to new lows or a retest going further into December before the final recovery into year end. That would be an amazing scenario because it puts a major final low in very close proximity to a final year end peak. However it has been done in the past so it has to be my forecast.
Next week we can take a look at the outcome. Then I will be off for the holiday’s, traveling and updating my computer files. I will return on the first Monday of the new year, Jan 5, ready to go for another interesting year with new tools including daily trend plots for the two completed 40 year cycles corrections 1929-1932 and 1973 -1974.
Update for December 1 2008
Download the current PDF file for the updated daily chart.
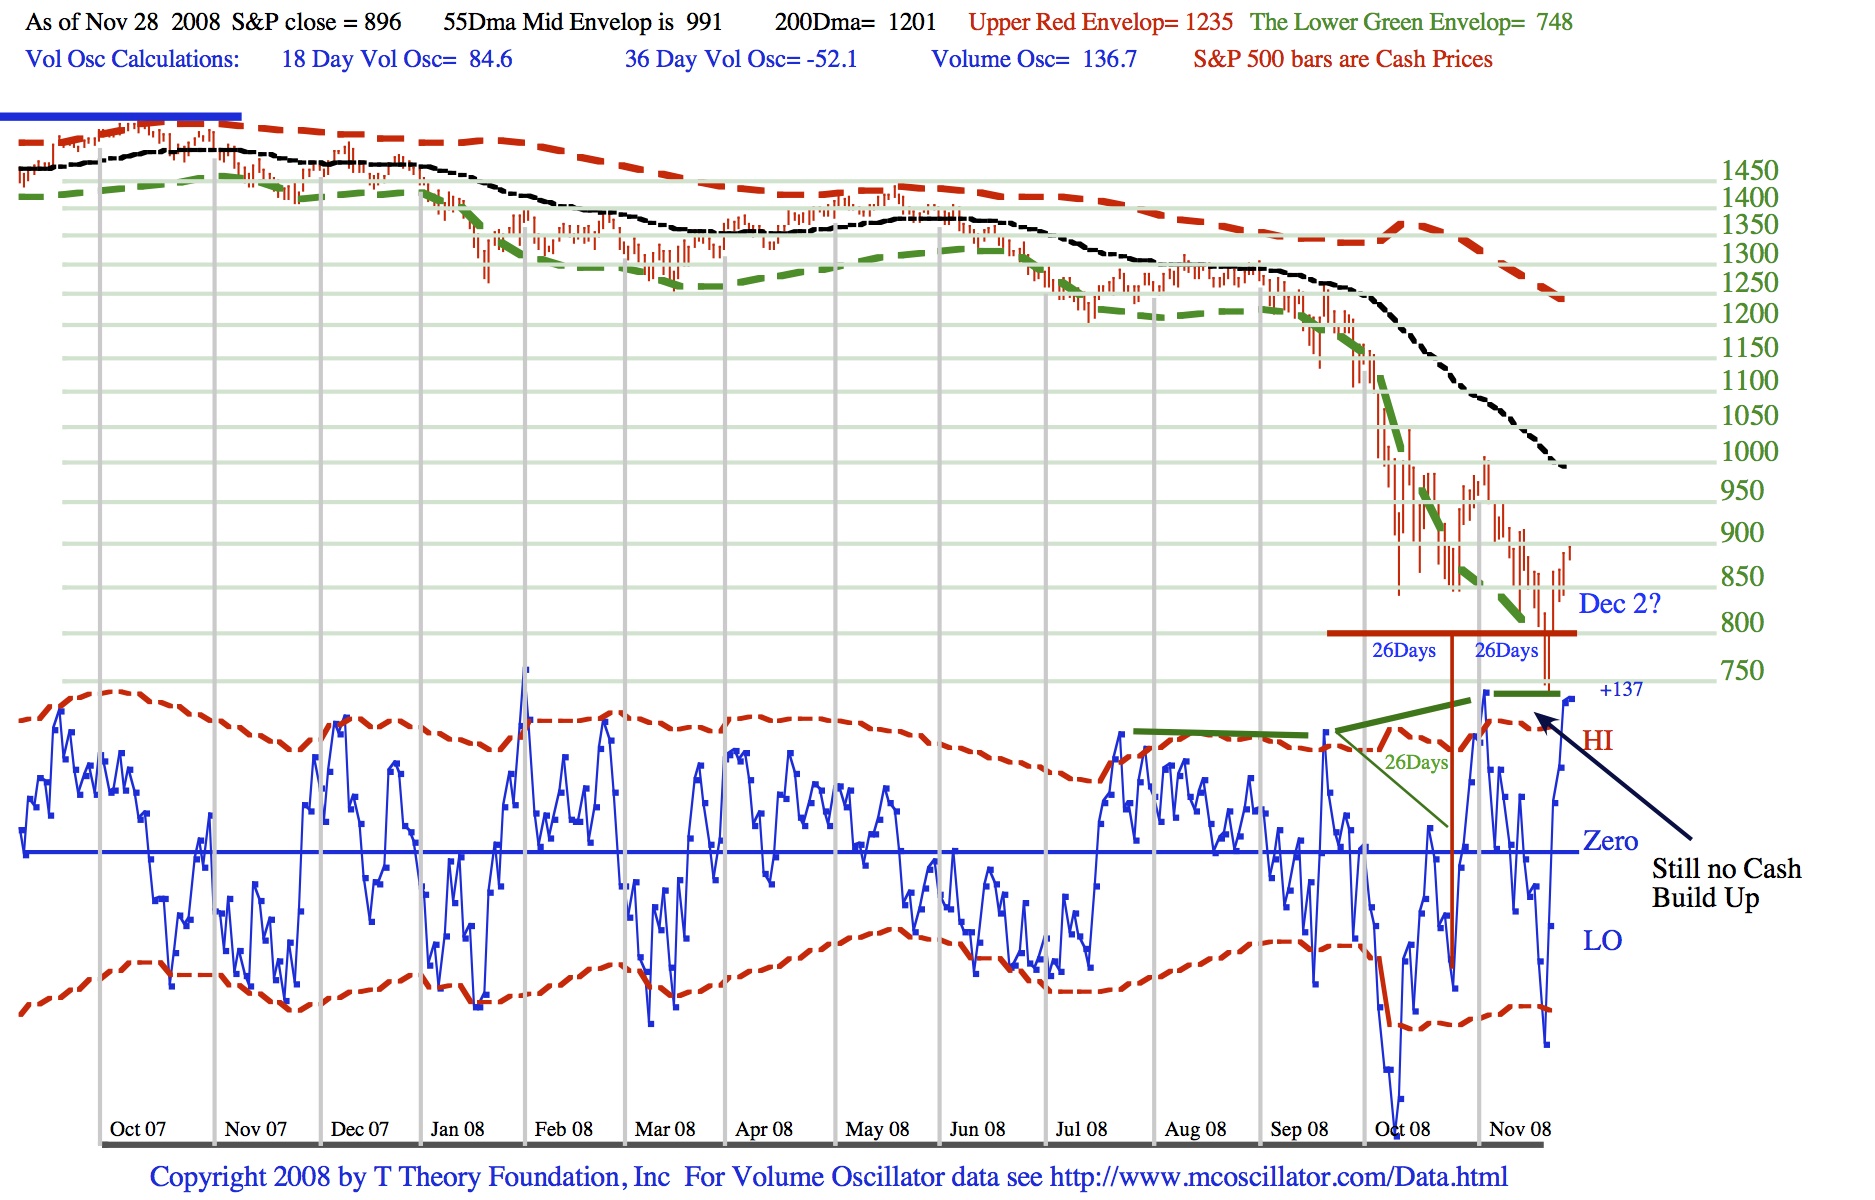
Last week the market rallied sharply but is expected to peak early this week. The source of the rally is the small red T sketched in the lower part of the chart. It has a tiny cash build up of 26 days and the inherent time symmetry calls for the peak a matching 26 days later or December 3. I would guess Dec 2 is more accurate as these small Ts keep topping out a bit early due to the weak environment.
The big picture remains quite negative longer term because there is still no new cash Buildup present in the oscillator peaks as detailed last week. However for the remainder of December we still have a mixed picture. There are two collapsed Bear Ts from earlier lows this year that point to some sort of peak at year end. One T says Dec 29 the other Jan 2 2009.
But the 23 week cycle low looks to be coming close to year end, so the two opposing effects may cancel out. In any case without a dramatic Cash Build Up it is unlikely that any big rally can develop this year. After we see the next decline phase, I will try to put all these concepts into perspective in the daily chart.
****************************************************************************************
All Rights Reserved By The T Theory® Foundation ©
Order the T Theory® Encyclopedia
For a complete understanding of the T Theory® and how to successfully use Terry’s unique methods, order the Encyclopedia from Paula at the above link. There is additional material in the encyclopedia not covered here. Paula will be more than happy to answer your questions too.
Many thanks to Paula Burke for her permission to re-post Terry’s old T Theory® explanations. The period re-blogged on these pages are some of Terry Laundry’s best work and was published here from public domain.
****************************************************************************************
I claim no credit for the material found under T Theory® on this blog. All of this material is the creation of Terry Laundry and was downloaded from Terry’s free blog site (TypePad). I have created a mirror of Terry’s original material and now there is a second site containing Terry’s T Theory®. One or both of these websites hopefully will survive through time as Terry’s material is too important to be lost to the ravages of time. This site is simply a memorial to his lifetime work.
The page content re-blogged here is exactly as Terry created on his original webpages (saved on my computer with ScrapBook)). Nothing has been left out from the period Dec 2003 to June 2011. From Terry’s site, I made a lot of formatting changes, creating a more easily readable webpage appearance. The PDF chart duplicates of the JPEGs have been omitted for ease and speed of recreating Terry’s pages. References to PDF charts should be ignored (but no chart was left out).
After June 2011, Terry created a paid subscription website. None of that material is found here.
There were many many, many hours spent on this project; downloading Terry’s individual charts & audio files, followed by the uploading of Terry’s charts and audio to my WordPress blog library, after which I had to insert the uploaded material into my new T Theory® webpages (hopefully in the correct places). This was a dull and arduous project and I hope you enjoy it. I don’t believe there remains any more of Terry’s material in free domain, so my T Theory® project is probably finished. If I’ve missed something, you can leave me a comment.
If you find an uploaded reference error (chart or audio in the wrong place), please note the month and year of the webpage, plus the exact name of the referenced error file. Include any other info that will help me locate the problem file and where it occurs on the webpage. Leave a comment for me with the info and I’ll fix it.
Terry’s material is very long and will take many weeks for you to finish. Don’t hurry, it’s not a marathon and you will absorb more if you go through it at a reasonable rate. This is especially true for those who don’t invest in the T Theory® reference encyclopedia. The encyclopedia is a written reference for T Theory® and includes everything of importance for Terry’s T Theory®. Without the reference encyclopedia you must depend on your memory and Terry’s method carries some rules that you could easily violate. The encyclopedia also includes new information never seen on his website.
You are welcome to save any or all of my blog material to your computer. You also have my permission to re-blog my information, but you must (1) credit me and my blog in an obvious manner and (2) don’t change my material.
FYI – I find the best way to save a webpage is using “ScrapBook” (it’s an add-on for the FireFox browser). ScrapBook saves a webpage to your computer EXACTLY as it appears on the day you saved it. You can’t tell the difference between the internet webpage and your ScrapBook saved webpage. The saved pages are not pictures. Instead the pages consist of HTML and page functionality remains identical on your computer. There is also a second method for using ScrapBook, where you can save all of the webpages down to a defined link depth. This optional method means all links will function on your computer to the link depth specified (meaning you can click on links on your saved webpages and tunnel down into pages within pages). Saving the normal way will only save the top webpage but the links that exist could continue to function by taking you to the website on the internet instead of on your computer. But sometimes the linked website doesn’t exist anymore. I’ve had this happen on some very good webpages with unique information (they just disappear into the internet void). That’s a bummer when you lost some really good info and thus rose my need for ScrapBook. You can also filter the pages saved using the optional ScrapBook method, which can exclude all pages not coming directly from the specified website (filtering is recommended using this method otherwise you wind up with a LOT of useless stuff).
.
Explore posts in the same categories: . . . T Theory®
Leave A Reply