September 2008 – T Theory® Update

Theory Observations for September 2008
During September I will post weekly Monday morning comments concerning the Daily Short Range T chart as usual. Please read the important new Study below which described my most important discovery of a 40 Year Cycle. This cycle will have a very profound impact on the markets trend going into late this year and a 2010 major low. Download this two page study in PDF format.
forty_year_cycle_080827_finaldoc
Update for September 29
Download the current PDF file for the updated daily chart.
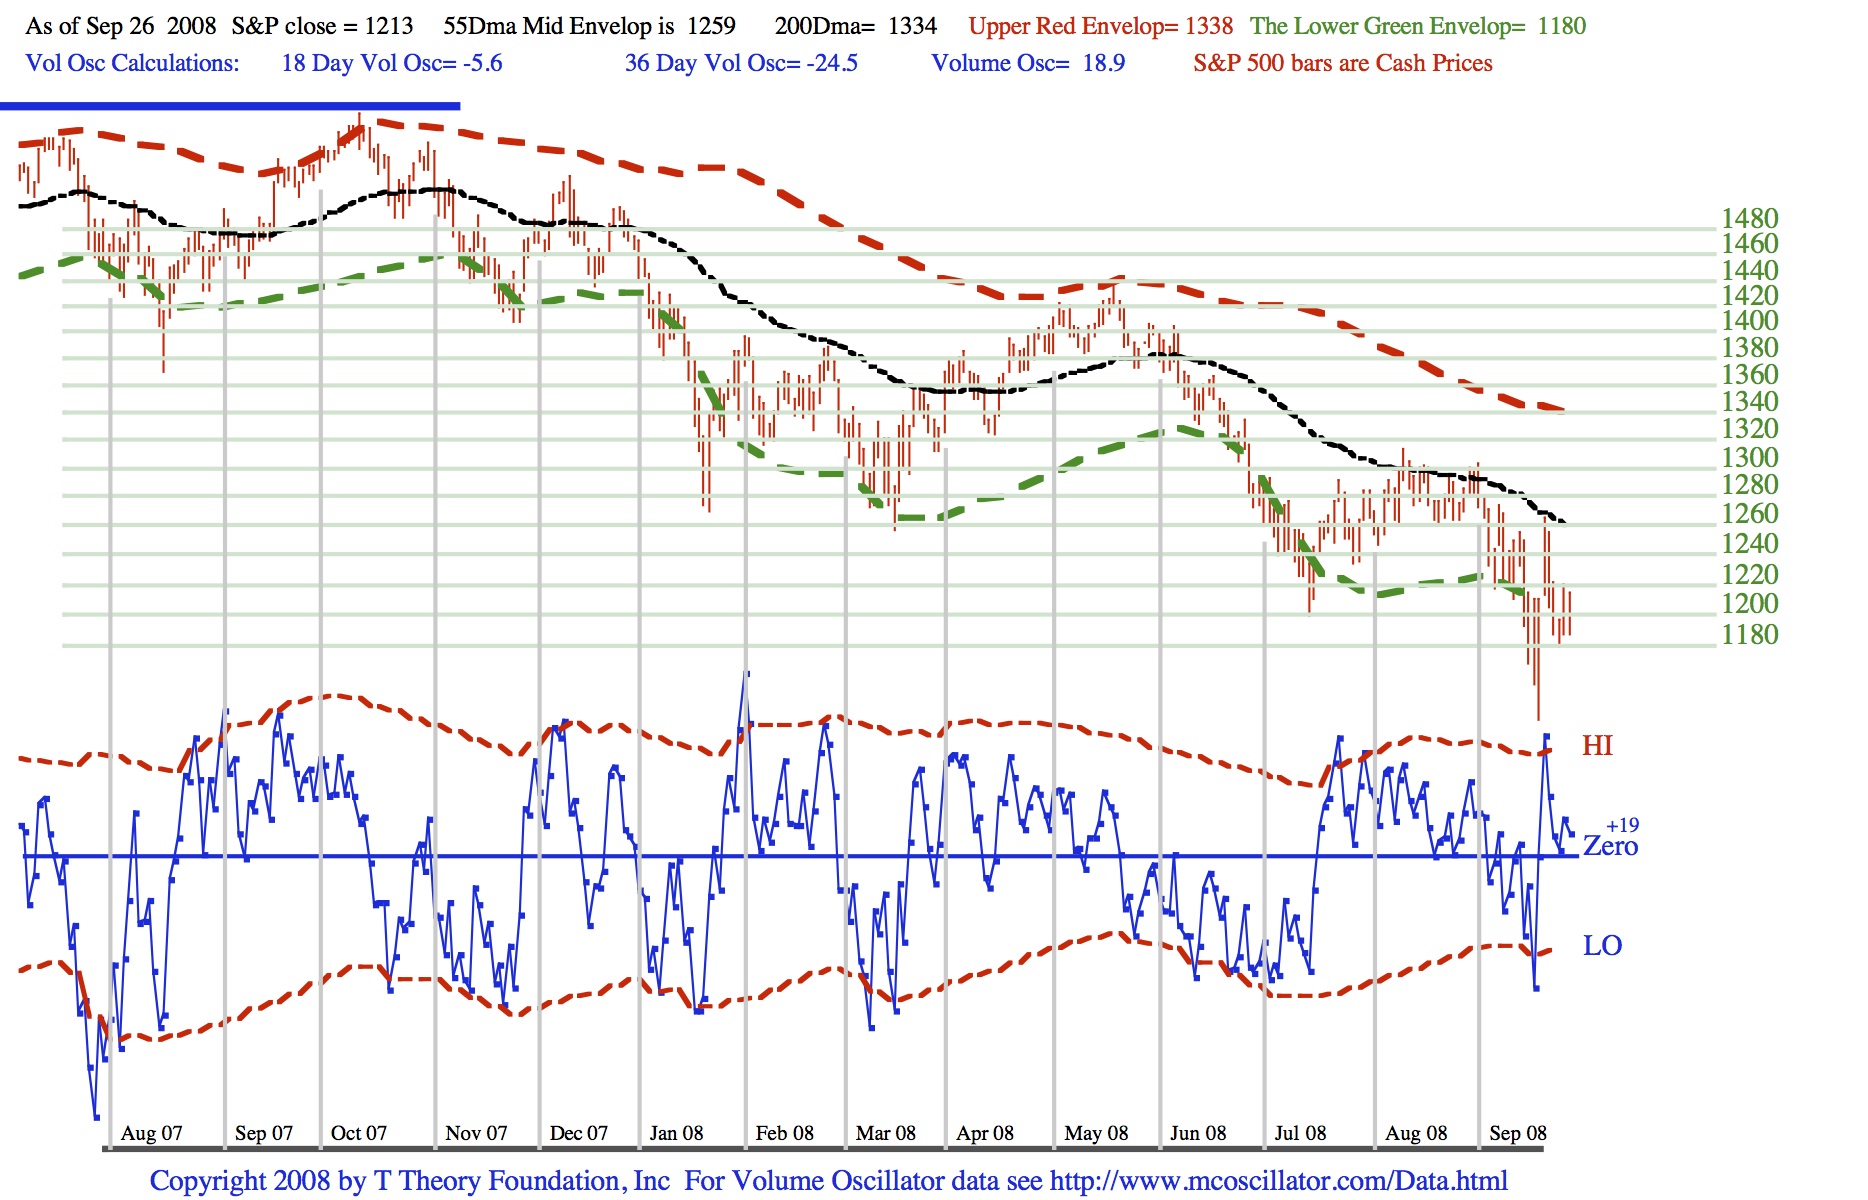
I think it is negative for the market that trading range remains beneath the black 55 Day MA at mid channel. As long as this persists, the cycle projections of a low around mid October and late November look OK to me.
Clues to this roadmap will be seen in three responses to news events over the next 2 months. Next week we should see the market’s reaction to the bailout proposal. In mid October the market will be reacting to the new flow of earnings reports. And through most of November the market will be reacting to the new President and his plans. Should make for an interesting period.
Finally, I will post a summary of bear/bull markets since 1929 around Oct 2 to start off the new month.
Update for September 22
Download the current PDF file for the updated daily chart.
Last week we saw the first concrete verification that my 40 year cycle had materialized in the eyes of the financial community. Now that it is a real threat I would first point out it can not be defeated by gimmicks such as the Paulson Plan, currently to have the US Gov’t buy up 700 Billion dollars to prevent a 1930s type of meltdown at the cost raising the the Federal debt to 11.3 Trillion. In practical terms the 40 year cycle a correction phase, lasting a couple of years, is for all the excesses built up in 1974 to 2007 bull market and as such cannot be defeated by short term accounting gimmicks. Either more marginal securities will become toxic to the system or the Gov’t debt will grow to the point that questions will be raised as to whether the US dollar is worth anything.
Of course there is nothing that says this plan will not be adopted or that investors will not become even more enthused of prospects that they will be bailed out of defaulting securities. However we do have the tools in the daily chart to continue the forecast. It would be better for me to have a few more days of data so as to resolve some of the envelope channel fine points, but I think I can cover the alternatives right now, and guess at the outcome. If need be, I will post an update later in the week.
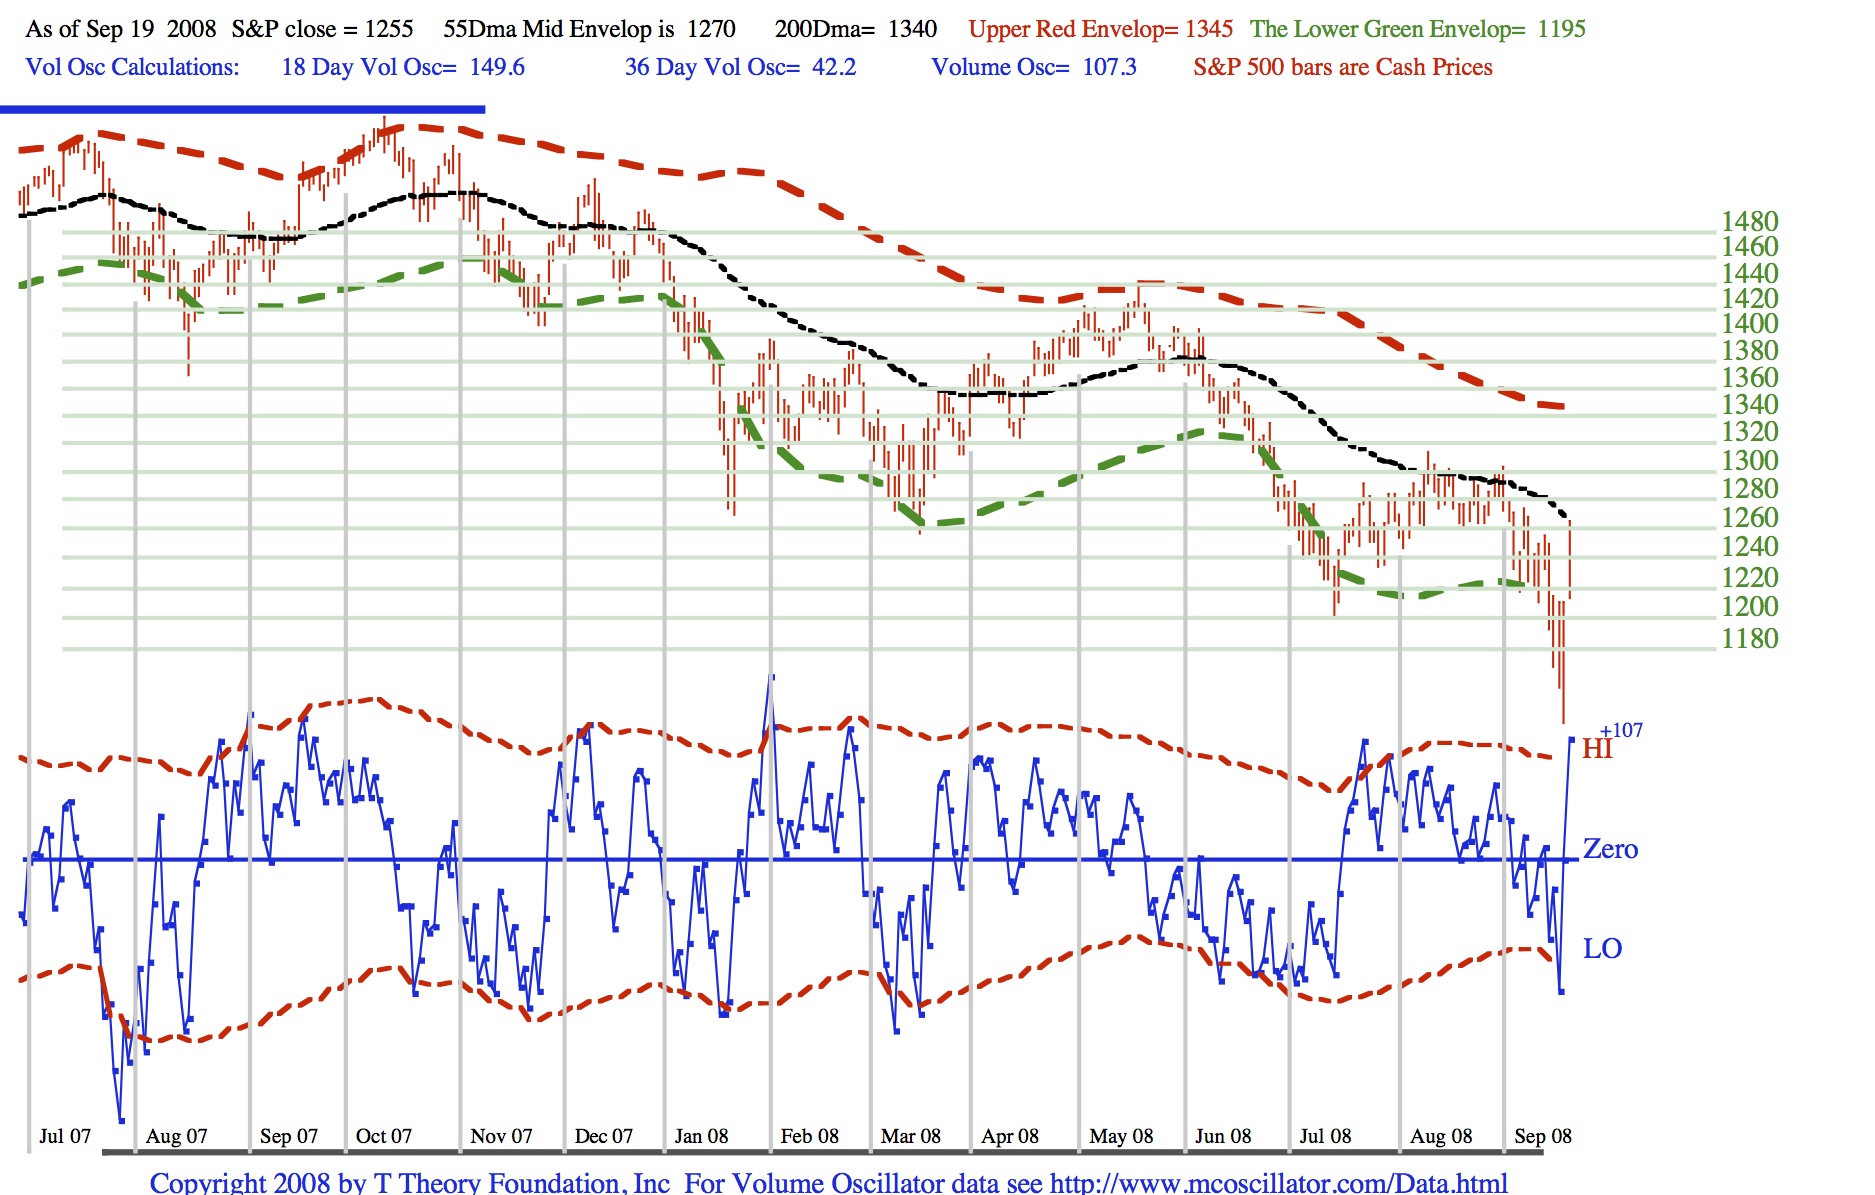
Starting from the S&P peak in early August, recall my Envelope Theory specifically requires that any move of consequence must travel the full distance from mid channel (the black line) all the way either up or down to the colored edges of the envelopes, recently about a 5% move. Furthermore at mid channel this decision must be made fairly quickly because history shows it is an unstable point for the S&P. An example occurred in December 2007. The twin peaks separated by about 9 days just above the black line in December are comparable to the recent twin peaks in August. For simplicity sake let us say the market didn’t like the outlook and took the downside alternative and met its quantum jump requirement that I discovered by moving well below the minimum target of the Green line now 1195 as listed in the table. The green line is a stable point during any bear market trend so continued weakness into the mid October low would have been the normal outcome.
Once the sharp rally began these same set of envelope rules require a minimum rise to the 55 day MA listed now at 1270 vs Friday’s close of 1255, all cash prices. In general if the optimism continues this week we will be back to the August situation where we will have to evaluate the possible outcomes of either a run up to the red dashed line currently 1345 or back down to the green dashed line. Right now it is best to let the market sort out the S&P trading pattern around the 55 day MA. Usually the outcome becomes obvious in a short period of time but if not, I will post and update.
Update for September 15
Download the current PDF file for the updated daily chart.
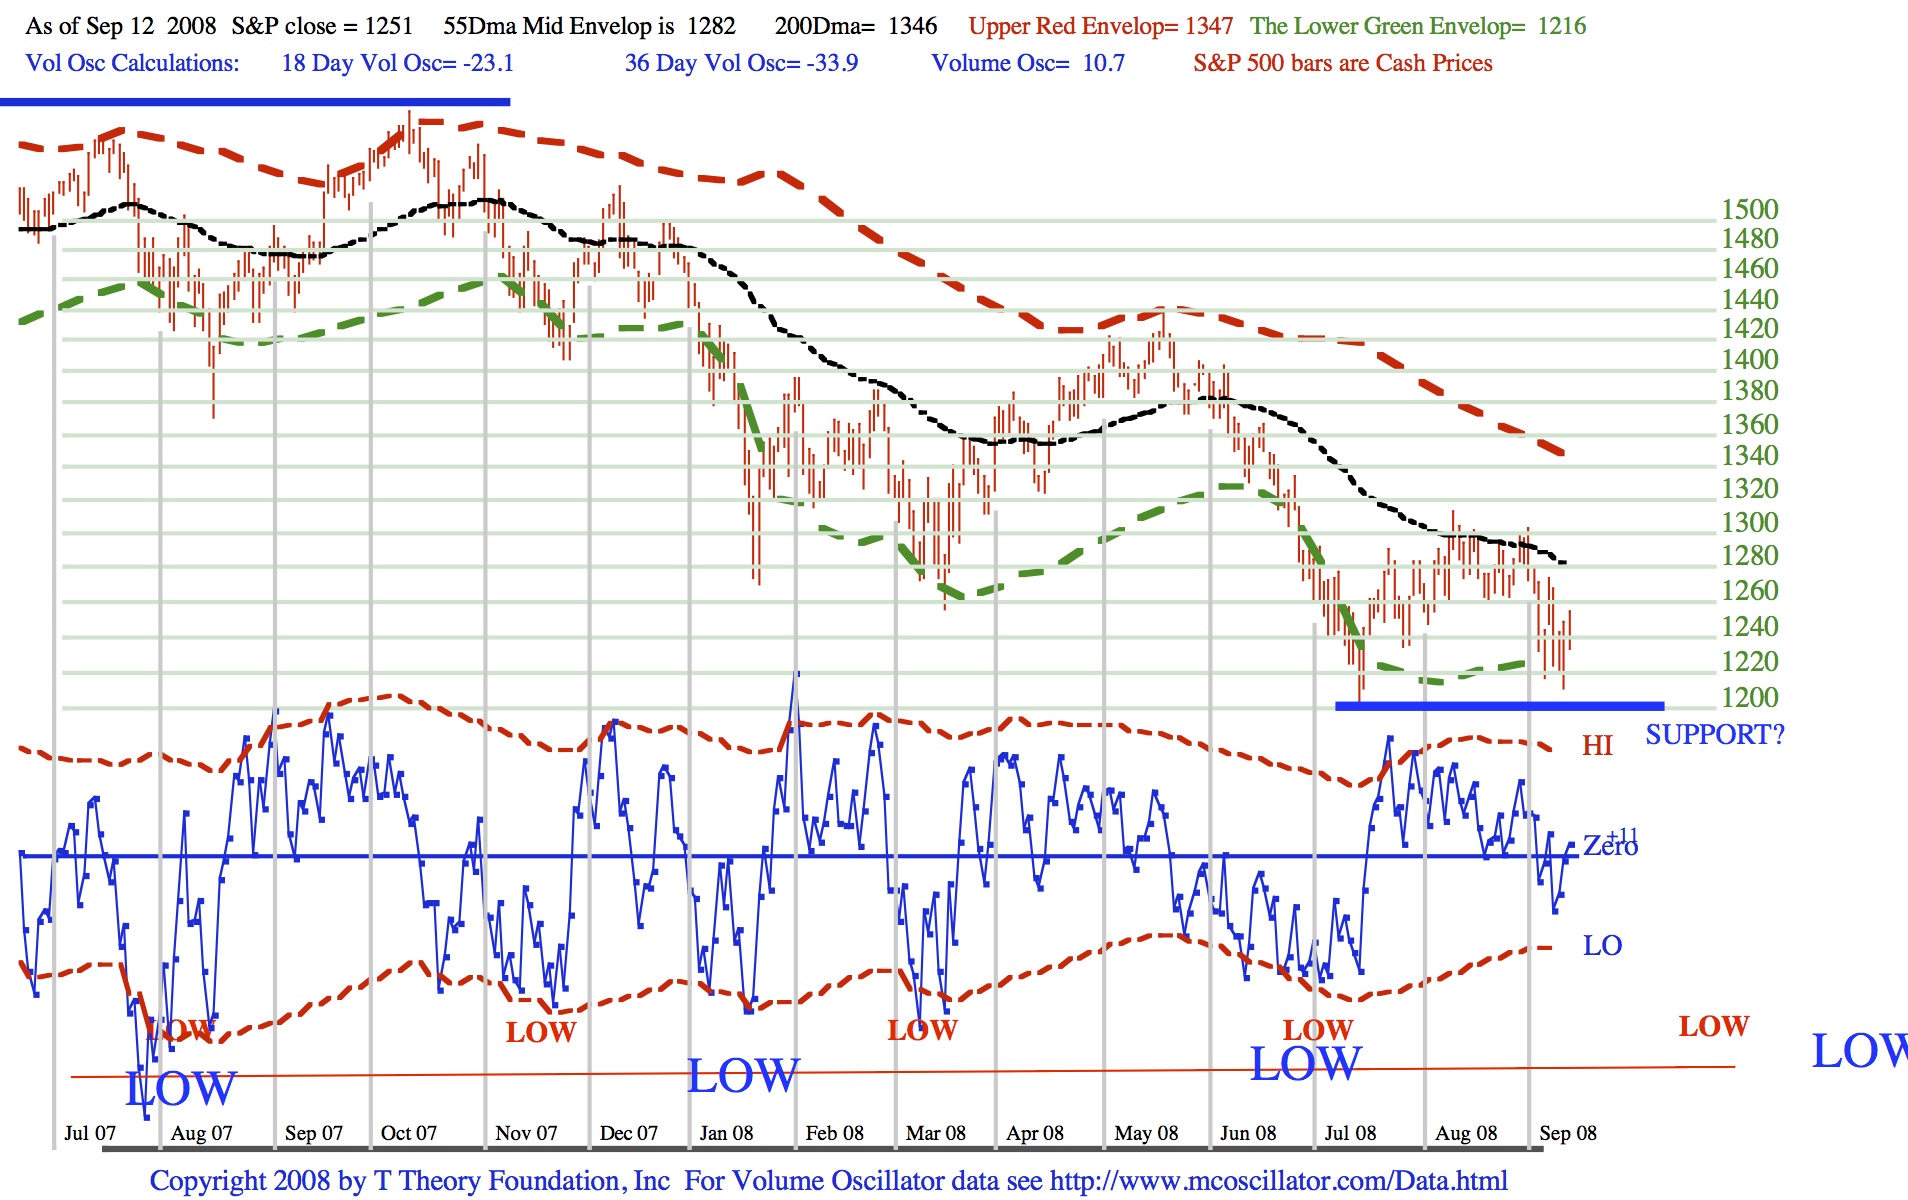
All T Theory projections for the current period are expired as noted in last week’s update and I now expect the S&P to fall below the Support? level defined by the July lows. The near term downside projections for the continuation of the bear market which began from my Advance-Decline T projection of a major peak in Fall 2007 is assumed to be fueled by the 40 Year cycle (summarized in the September topic above) and look to have new shorter term cyclical lows that might appear in the mid October and late November period. In this report I will concentrate on some aspects of cycle theory as laid out by J.M. Hurst in his 1970 book Profit Magic of Stock Transaction Timing which I obtained from Traders Press, Inc Greenville, South Carolina many years ago. It is worth reading for its specific insights that I will discuss below.
Hurst reached two conclusions that have greatly influenced my work as I have moved beyond the simple time symmetry of the T into more complex patterns. His most important contribution was the complex price vs time patterns were composed of different cycles having different time spans and each time span had a separate amplitude, but in general, longer term cycles had larger amplitudes, and therefore were more forceful when they arrived. This characteristic which he felt was fundamental is called the “amplitude-duration relationship” and has great implications at the highest level of investment forecasting. For example if you view the present status of the mortgage related financial crisis as very very important, and you are looking for a cycle related explanation, then the cycle explanation must be of very very long duration. This conclusion led me to investigate very very long cycles and therefore pushed me towards he eventual discovery of the 40 year cycle which represents a completely new discovery.
Hurst’s second important contribution to my work was the insight that cycles are most easily seen by enclosing their price fluctuation through time within constant vertical price width envelopes much as I have done in my chart. I would never have thought that trends were contained within envelopes until he proposed it as a fundamental property of the “amplitude-duration relationship”. This led to my most recent discovery that, while the daily price progressions within the red/green envelopes is statistically distributed to a normal degree, the key turning points for trends is “quantized” to one of the three specific price levels in the chart. Turning points can only occur at the three levels defined by my proprietary envelopes; the upper red dashed line as per mid May 08 , the lower green dashed line as per July 08 or at the mid channel line as per this August. In certain extreme cases such as 9/11 the trends will over run the envelope characteristics but within a few weeks the adaptation that I have built into the equations will restabilize the conclusions. In particular if the Support? level is broken and a sharp decline results near term, these channels will begin to adapt to the continuation of the bear market and the envelope rules for rallies will be maintained by the modified channel envelopes.
Additionally Hurst provides guidance as to why there are two cyclical patterns, the simple one of Red Lows spaced about 15 weeks apart, and a longer cycle with blue lows spaced about 23 weeks apart. At first glance the simplest pattern of lows was seen to be the red Lows because they are more numerous and the Low pattern appears to be quite precise. I asked Chappy, friend of some 30 years if he felt the 15 week cycle in my chart was real and accurate. He said yes it is accurate and there will be a mid October low as a result. Then I asked my equally good friend of 30 years, Bob, what he thought from his work. Bob said he didn’t see an October low, instead he saw a late November low. The resolution of this conflict using Hurst principles can be seen by close observation of the 15 week cycle low in Red. It clearly defines the lows at 15 week interval quite precisely but the January 08 sharp decline falls mid way in the 15 week cycle which suggests the presence of a longer cycle with a key low in January. Because the January 08 drop in the S&P is the most sever in amplitude, Hurst’s “amplitude-duration relationship”suggests that low must be the product of a cycle longer in duration than the 15 week cycle. The simplest alternate cycle is the Aug 07 to Jan 08 sequence which defines the 23 week cycle in blue. Note these two cycles become coincident at the July low making it very deep. This implies that a 46 week cycle is also present.
In summary then we have identified what seem to be repetitive cycles of approximately 15, 23 and 46 weeks duration in addition to the standard 4 year cycle and my newly discovered 40 year cycle. Of all these cycles the 15 week and the 40 year cycle are probably most significant for the next few weeks. The 15 week cycle is about at its mid-point so it is turning down and the 40 year cycle is already in its destructive mode. So over the next few weeks the S&P will easily take out the sketched in Support? then press the S&P into the green dashed line going into mid October before seeing any relief. But even then, any rally will only last a couple of weeks as the stronger 23 week cycle re-captures the downside into late November.
In my next report we can start a refinement of the basic outline.
Update for September 8
Download the current PDF file for the updated daily chart.
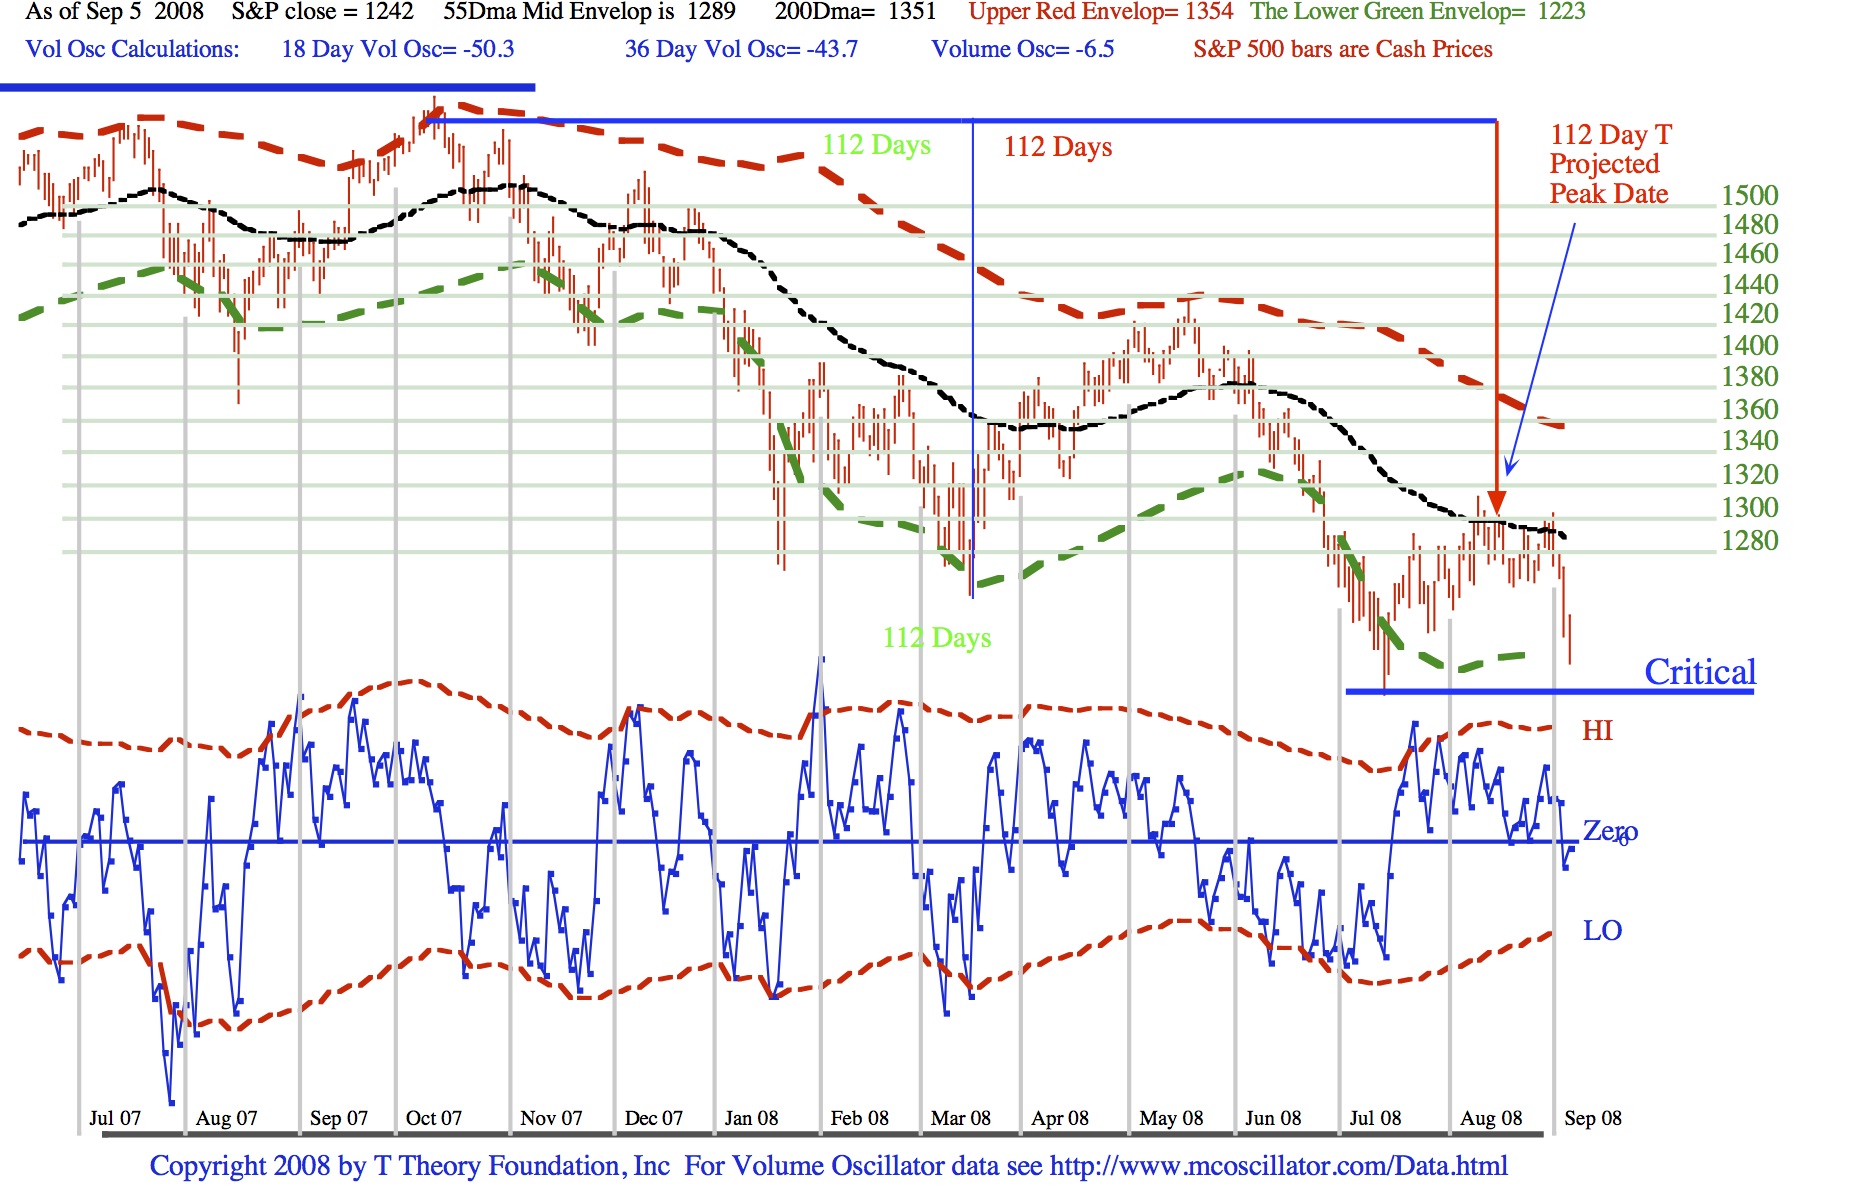
Last week the market discovered the 112 Day Big T calling for the August peak was “real”.
Over the next few week we need find out whether the 40 Year cycle is real enough to push the S&P below the Critical support level marked by the July low.
A breakdown would confirm the 40 Year Cycle continues to maintained its once in a lifetime control and the bear market will continue. Update: a small T in the July low calls for a peak around Sept 11
Update for September 1
Download the current PDF file for the updated daily chart.
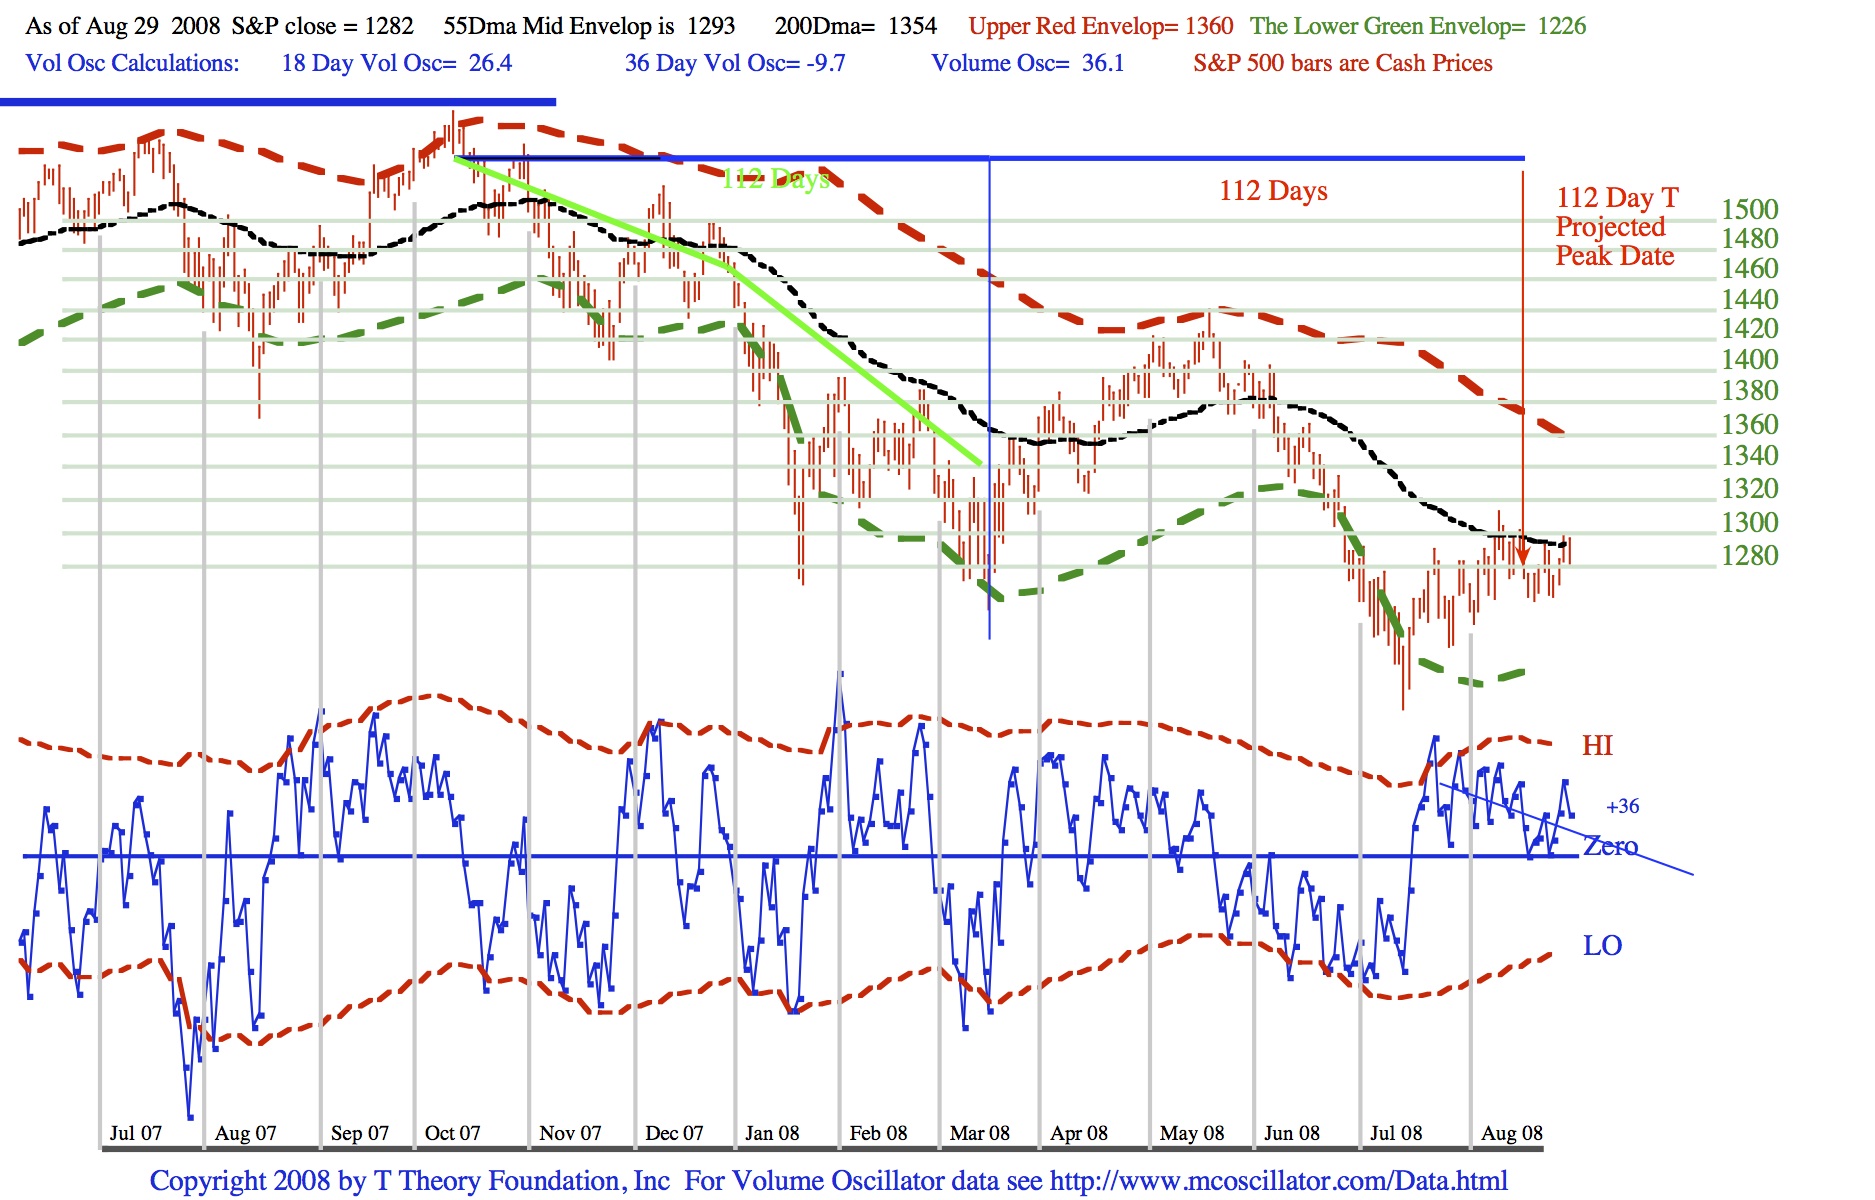
My T Theory forecast remains unchanged from last week. The 55 Day MA (the black line at 1293) should be strong enough resistance to halt Wall Street’s current infatuation with the bullish case. It is OK for a brief upside penetration of the 1293 level to occur but the market is constrained by my envelope theory only to make quantum jumps from the 55 Day MA, either to the upper red channel envelope or down to the lower green envelope( i.e. jumps of plus or minus 5%) No other moves or fractional jumps in the S&P are allowed.
You may be thinking that the mid May peak to the July low could represent a cash buildup that defines the left side a T which by the usual rules calls for continued strength into September. This may work out OK but I have learned the hard way that the big T shown here is more reliable. We will see how it turns out.
****************************************************************************************
All Rights Reserved By The T Theory® Foundation ©
Order the T Theory® Encyclopedia
For a complete understanding of the T Theory® and how to successfully use Terry’s unique methods, order the Encyclopedia from Paula at the above link. There is additional material in the encyclopedia not covered here. Paula will be more than happy to answer your questions too.
Many thanks to Paula Burke for her permission to re-post Terry’s old T Theory® explanations. The period re-blogged on these pages are some of Terry Laundry’s best work and was published here from public domain.
****************************************************************************************
I claim no credit for the material found under T Theory® on this blog. All of this material is the creation of Terry Laundry and was downloaded from Terry’s free blog site (TypePad). I have created a mirror of Terry’s original material and now there is a second site containing Terry’s T Theory®. One or both of these websites hopefully will survive through time as Terry’s material is too important to be lost to the ravages of time. This site is simply a memorial to his lifetime work.
The page content re-blogged here is exactly as Terry created on his original webpages (saved on my computer with ScrapBook)). Nothing has been left out from the period Dec 2003 to June 2011. From Terry’s site, I made a lot of formatting changes, creating a more easily readable webpage appearance. The PDF chart duplicates of the JPEGs have been omitted for ease and speed of recreating Terry’s pages. References to PDF charts should be ignored (but no chart was left out).
After June 2011, Terry created a paid subscription website. None of that material is found here.
There were many many, many hours spent on this project; downloading Terry’s individual charts & audio files, followed by the uploading of Terry’s charts and audio to my WordPress blog library, after which I had to insert the uploaded material into my new T Theory® webpages (hopefully in the correct places). This was a dull and arduous project and I hope you enjoy it. I don’t believe there remains any more of Terry’s material in free domain, so my T Theory® project is probably finished. If I’ve missed something, you can leave me a comment.
If you find an uploaded reference error (chart or audio in the wrong place), please note the month and year of the webpage, plus the exact name of the referenced error file. Include any other info that will help me locate the problem file and where it occurs on the webpage. Leave a comment for me with the info and I’ll fix it.
Terry’s material is very long and will take many weeks for you to finish. Don’t hurry, it’s not a marathon and you will absorb more if you go through it at a reasonable rate. This is especially true for those who don’t invest in the T Theory® reference encyclopedia. The encyclopedia is a written reference for T Theory® and includes everything of importance for Terry’s T Theory®. Without the reference encyclopedia you must depend on your memory and Terry’s method carries some rules that you could easily violate. The encyclopedia also includes new information never seen on his website.
You are welcome to save any or all of my blog material to your computer. You also have my permission to re-blog my information, but you must (1) credit me and my blog in an obvious manner and (2) don’t change my material.
FYI – I find the best way to save a webpage is using “ScrapBook” (it’s an add-on for the FireFox browser). ScrapBook saves a webpage to your computer EXACTLY as it appears on the day you saved it. You can’t tell the difference between the internet webpage and your ScrapBook saved webpage. The saved pages are not pictures. Instead the pages consist of HTML and page functionality remains identical on your computer. There is also a second method for using ScrapBook, where you can save all of the webpages down to a defined link depth. This optional method means all links will function on your computer to the link depth specified (meaning you can click on links on your saved webpages and tunnel down into pages within pages). Saving the normal way will only save the top webpage but the links that exist could continue to function by taking you to the website on the internet instead of on your computer. But sometimes the linked website doesn’t exist anymore. I’ve had this happen on some very good webpages with unique information (they just disappear into the internet void). That’s a bummer when you lost some really good info and thus rose my need for ScrapBook. You can also filter the pages saved using the optional ScrapBook method, which can exclude all pages not coming directly from the specified website (filtering is recommended using this method otherwise you wind up with a LOT of useless stuff).
.
Explore posts in the same categories: . . . T Theory®
Leave A Reply