November 2007 – T Theory® Update

T Theory Update for November 26 2007
The S&P has been in a correction mode long enough to begin an sharp upside “pop” as we close out this month, perhaps continuing into early December, but probably only up to the 55 Day MA of the S&P.
Click on the link to download the most recent daily PDF chart with key my oscillator trend lines and the current S&P moving averages.
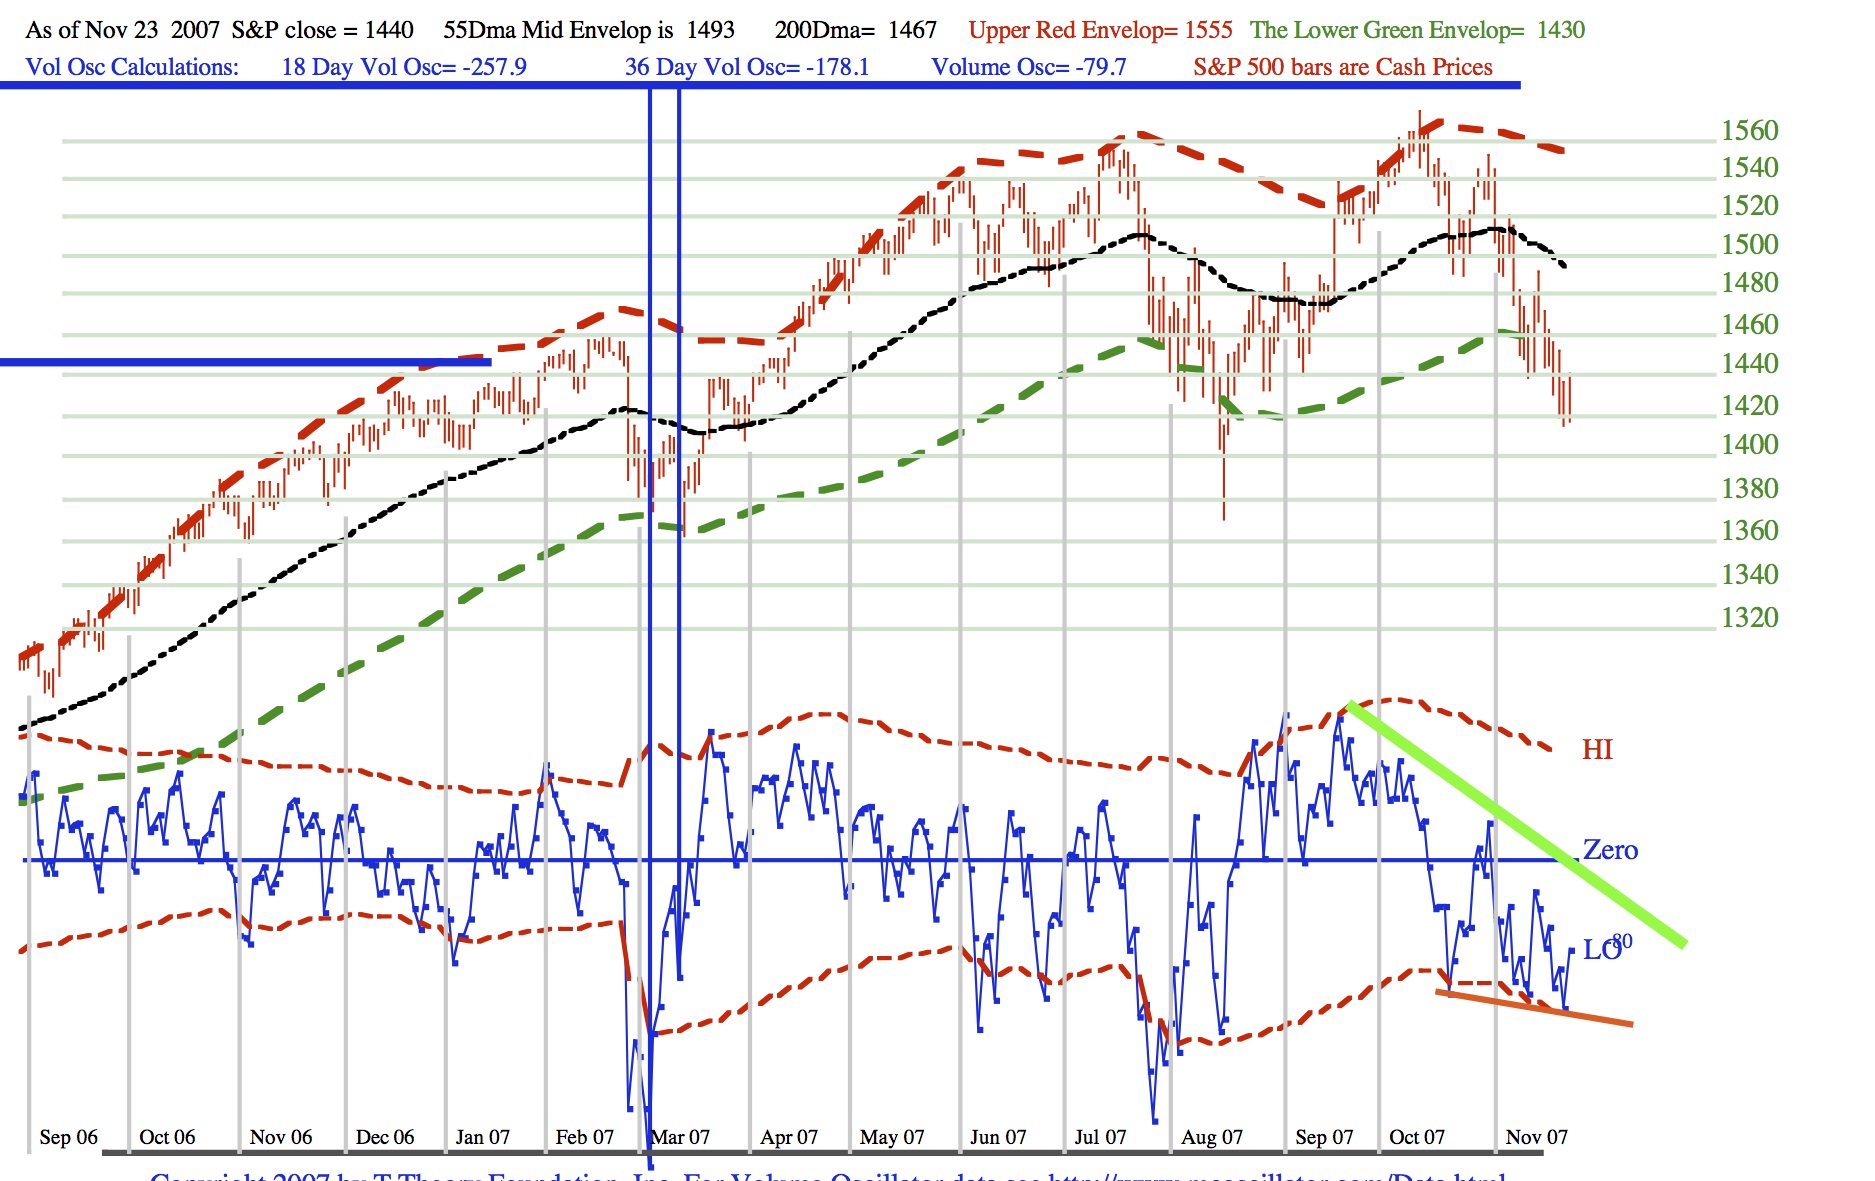
I still do not believe we have found a basis for a new Short Range T’s more sustainable rally but the triangle pattern of declining peaks in green (a potential cash build up line) is running into a shallower declining bottoms pattern and should have produced enough downside compression over recent week to require an upside technical bounce of a week or two. This rally in the S&P (etc) should begin as we close out November, but will likely peak in early December around the S&P 55 Day MA because the declining bottoms pattern in the blue volume oscillator does not show the required accumulation pattern (rising bottoms) needed for a sustained rally.
Last month I had an interesting conversation with Peter Eliades (www.stockmarketcycles.com) on his extensive research of Norm Fosback’s initial discovery of the historical significance of end of month rallies. Eliades concluded from his recent research that if one looks at market trends from 1929 to the present, nearly all the overall equity profitability of this 78 year period is in fact compressed within the abbreviated segments beginning a few days before the end of any month and ending a few days into any new month.
In terms of my chart, Peter is saying that most market gains, from the very narrow short term traders standpoint, occur starting just from the left side of the monthly division markers that I have programed into my chart to separate one month’s data from the next, and lasting a few days to the right of this marker.
Like all concepts, including my own, there are exceptions to any of these hard and fast rules. For example the probability of gains beginning from late October and lasting to early November did not materialize as well as the average case would expect. From T Theory perspective this would be expected because the small Advance- Decline T was expiring at the end of October in an overbought, toppy fashion so the market was in this instance vulnerable. See the prior updates.
However the situation is now completely reversed and a sharp recovery would be expected as we move to close out November and enter December. Next Monday I will comment further as I hope to see this recovery pattern develop.
T Theory Update for November 19 2007
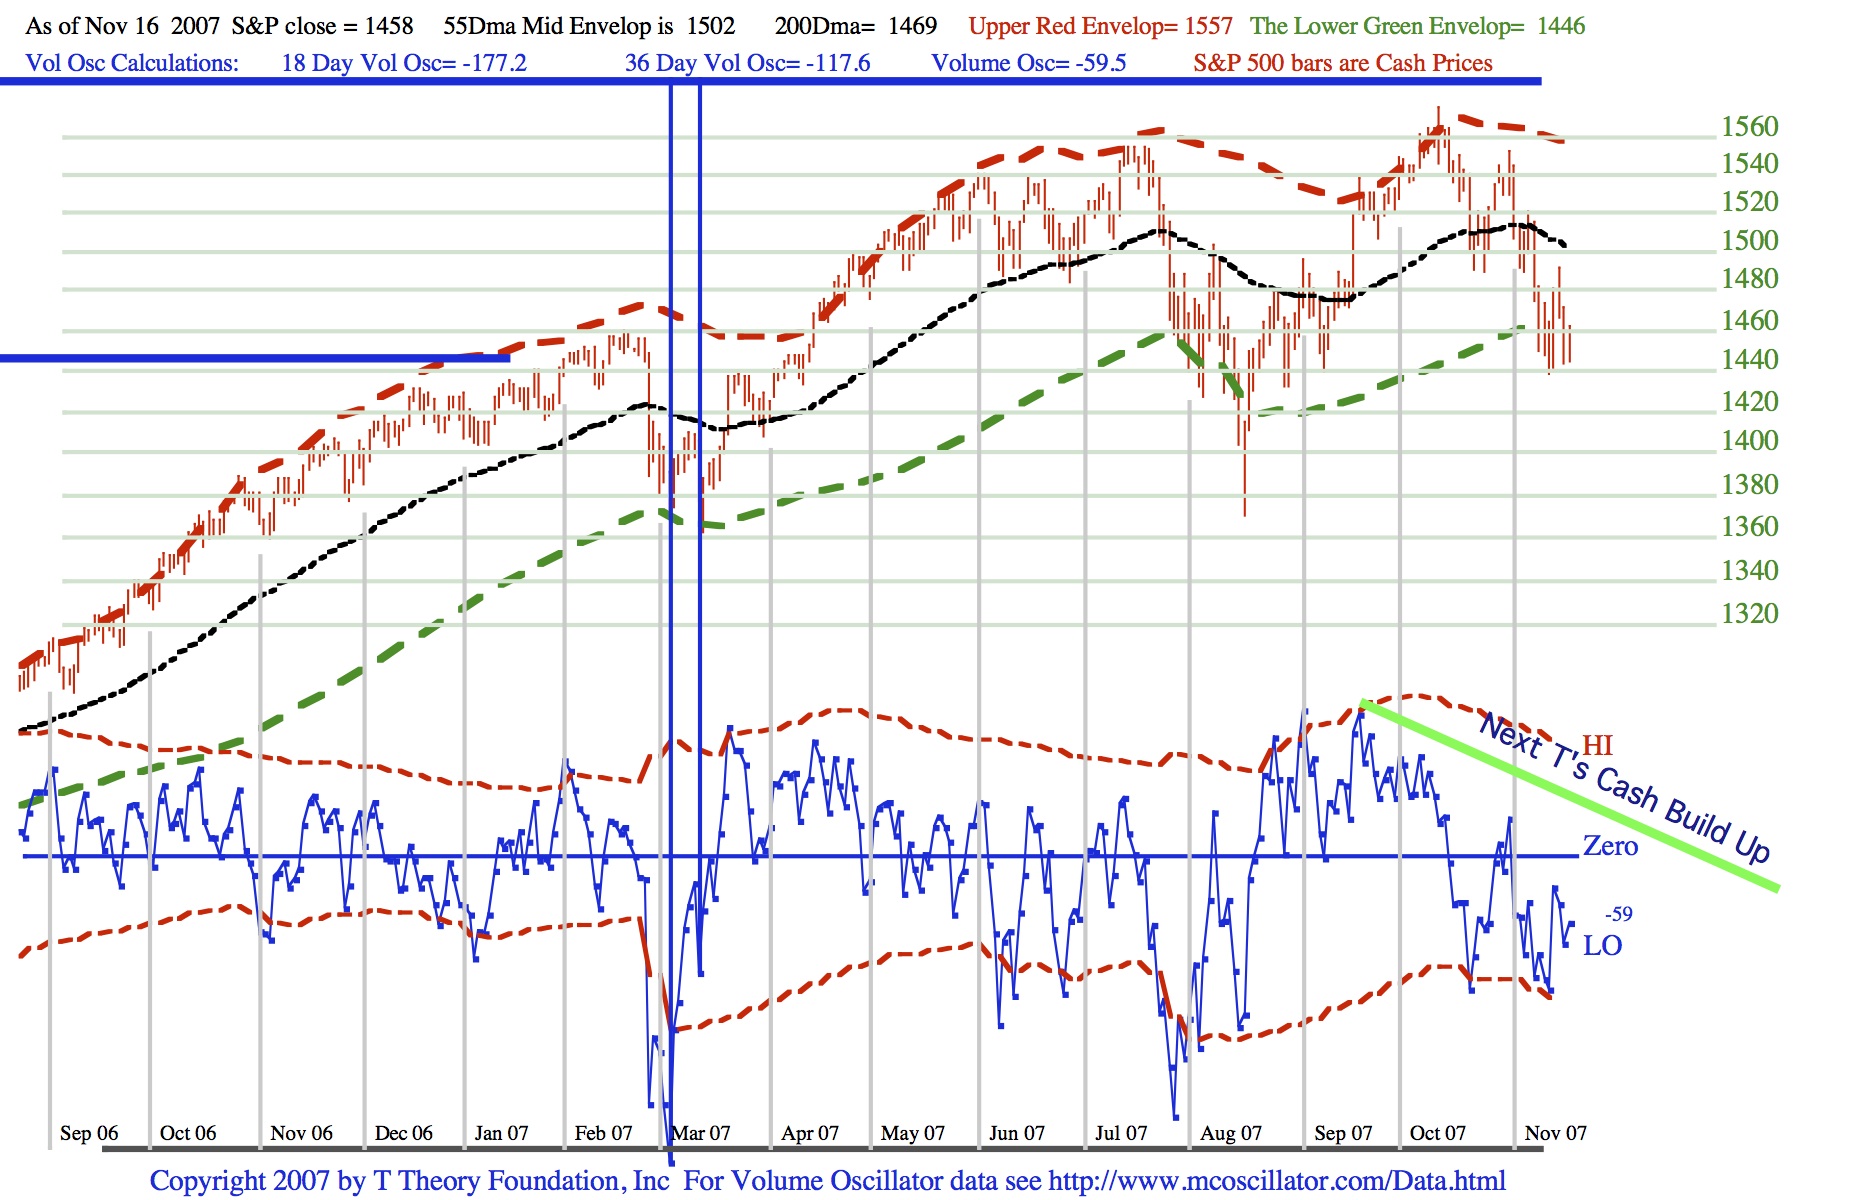
The S&P is in a normal, but yet incomplete correction mode, as illustrated in the PDF file below. Click on the link to download the most recent daily chart.
Strictly speaking, T Theory has no detailed insight into the nature of a market decline once one of these Ts expires near its right end date. It does however claim that no new significant rally can occur until we see the conditions being set up for a new T which we can determine over the next few weeks.
In the present case the big blue T and the small Advance -Decline T, discussed in earlier updates, together produced two peaks before the full decline set in. So we know the market buying power (which is assumed to be generated during the Cash Build Up phase of the T in its left side) has been near term exhausted. Thus a significant decline in terms of the upper red and lower green envelopes, which generally define the S&P’s trading range, is normal. We also suspect the more significant longer range Advance-Decline T from the late 2002/early 2003 lows, which have always contended that some sort of top in the market’s much longer term will occur during late Fall 2007, is probably correct, since the A-D Line was weak on the last rally into October.
However, based on history of long term peaks, it is also likely that any important top be completed as a series of sequential S&P peaks and valleys which technically can be interpreted as a “distribution zone” prior to the beginning of a more serious long term decline, usually into the next sequential 4 year cycle low, which I have previously interpreted to be roughly Oct 2010. This long term possibility will be my primary topic for my weekly T Theory Observations during 2008. Generally, I see one more rally in a new Short Range T whose left side cash build up is represented by the green descending line in the updated chart above.
If so, we can now put into place some of the T Theory conclusion that we will need next month to prove (or disprove) my thought that one final rally will begin, once the blue volume oscillator can break above the green descending cash build up line and trigger the initial rally of a new T.
I believe this new T’s “purpose in life” is to “suck in” the last upside potential for this major top, probably using a December surprising rate cut, once the Fed recognizes the impending real estate driven recession potential looming into 2008. According to T Theory this negative fundamental will more likely last into late 2010 as the many diverse negatives in the US economy (declining real estate values, ascending power of Asia, and the declining influence of the US due to mismanagement at the highest levels, etc) begin to snowball into 2010.
But near term, if all goes well with this thesis, the S&P will rally from an eventual low near the green envelope or the 200 day MA (or slightly lower) and then “blow off” on the news into the new T’s rally early in the new year that will be at the red upper limit of the channel. Beyond, the more fundamental negatives will likely exert their downside influence thereafter.
The near term problem in this scenario is the lack of a climatic volume selloff in terms of the Arms Ratio, invented by Richard Arms, but also referred to as TRIN, an acronym for the “Traders Index”. From its perspective, oversold conditions require a selling volume “wash out” of potential sellers before any important rally can begin. None has occurred in this decline, but should occur by December, or at least before the new Ts gets underway.
A sharp selloff could occur this week but with “Turkey Day” coming, investors might let this needed piece of the puzzle be delayed. In any case, if it happens it will produce one low, but perhaps not the final low. In the meantime I am finishing my historical charts on the Arms Ratio and should have it and its conclusions ready for my next Monday’s Update.
Any near term rally from an oversold condition, no matter how it is defined, should peak at the 55 day MA, now listed in the Friday chart date at 1502 (cash price), but declining over time in line with the ongoing correction. Only after this secondary decline from the 55 day MA runs its course, can the year end rally develop via a brand new T.
So the time for any major advance is not likely during November, however a bounce can occur to the 55 Day MA on any selling climax.
T Theory Update for November 12 2007
The completion of the Small Advance-Decline T discussed in last weeks posting has started the S&P 500 slide which we now find approaching the normal green low envelope around the 1460 level as per the updated chart. See the PDF file below for the current chart.
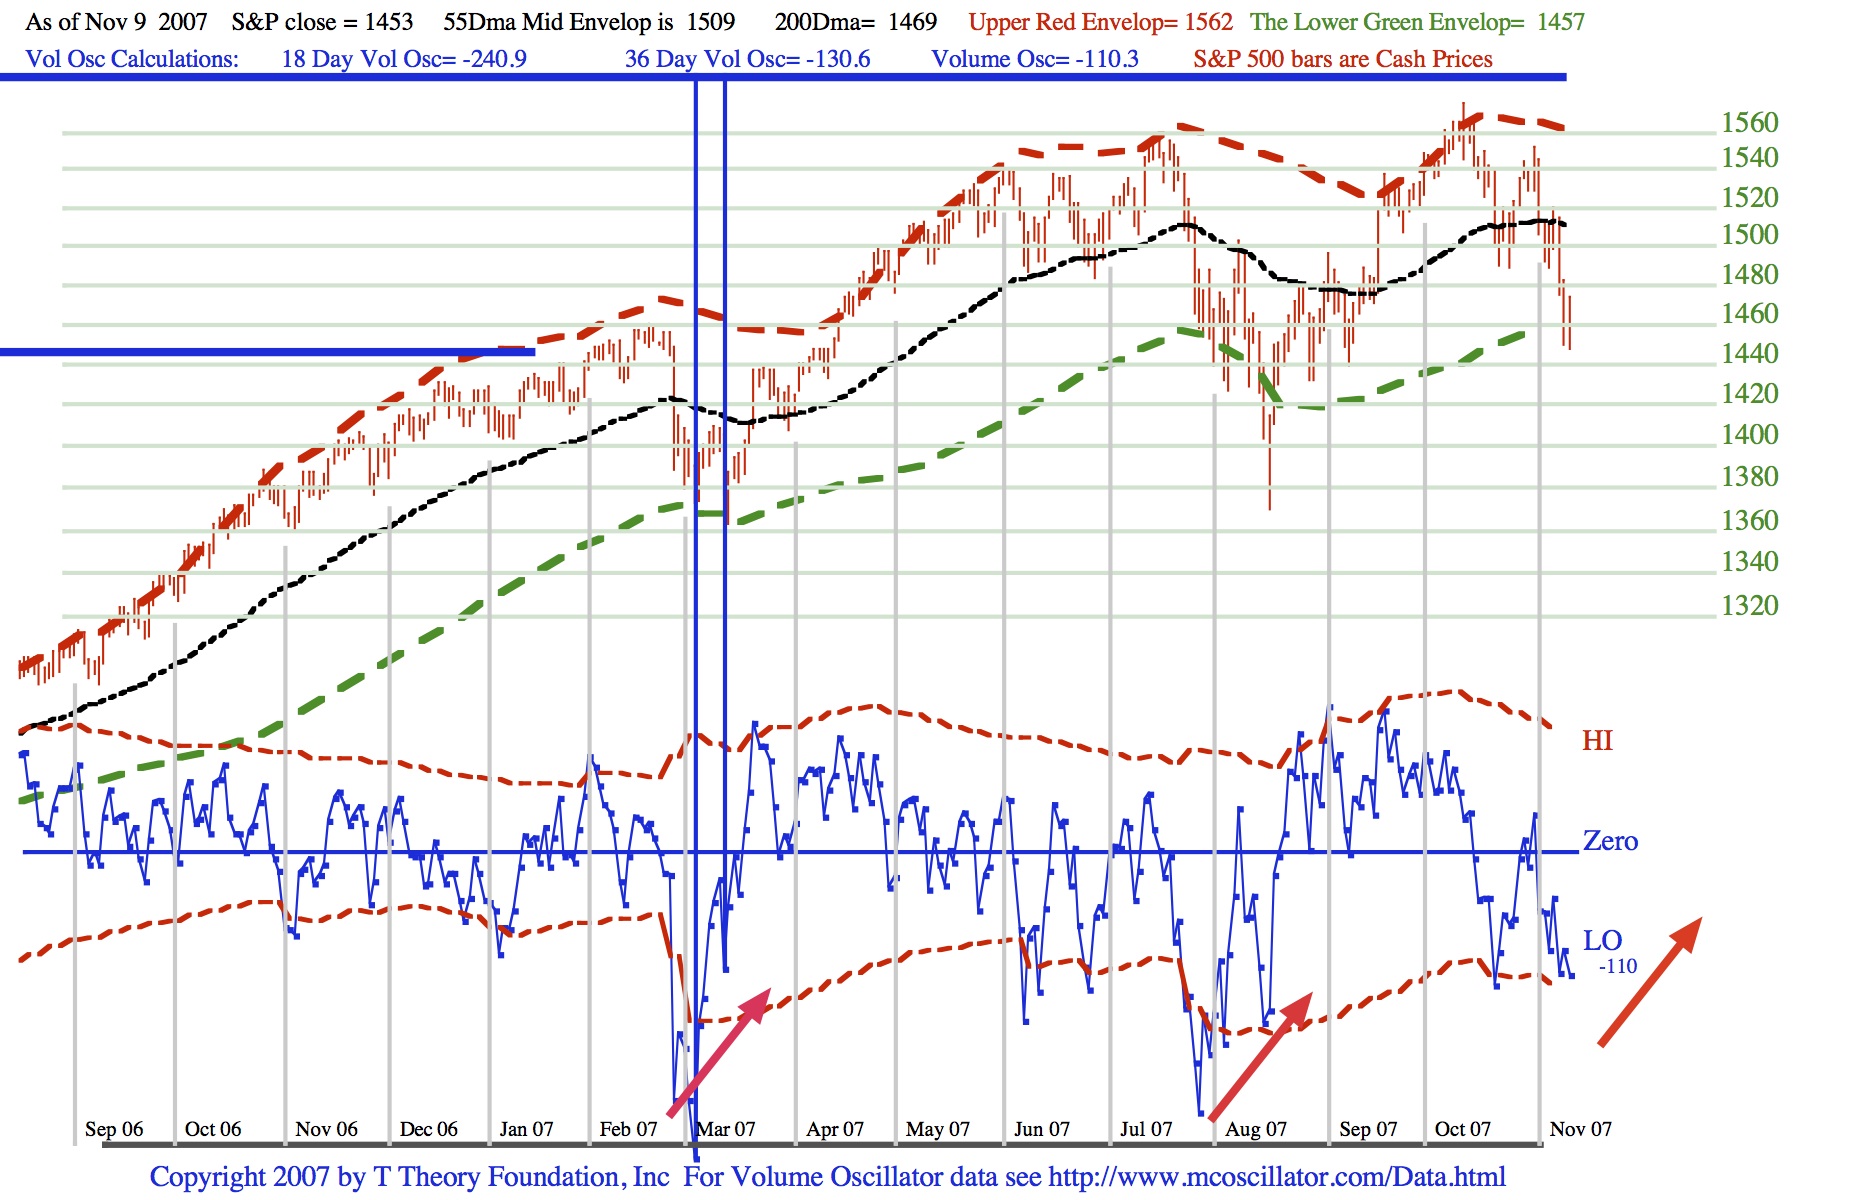
In order to find an actual low with enough of a basing pattern to begin the next Short Range T’s advance, we usually need to first find the rising volume oscillator bottoms pattern denoted in the chart by the red rising arrows. This requires a new rally that fails, as a minimum, so we need to watch the blue oscillator pattern evolve.
In the mean time the S&P 500 could reach down to its old August lows, but I am not looking for at repeat scenario, just on a contrary opinion basis. It is true that the long term A-D T (detailed in the long term Archives) could be expiring and eventually this should prove negative for the primary trend.
But it has been my experience that serious long term peaks for equities try to pull everyone into a bullish stance at the final peak. This is usually accomplished using a shorter than normal T that produces a short, but powerful, upside blow-off. This may not happen, but I would look for it based on prior history. Such a rally could begin in December.
T Theory Update for November 5 2007
Last week saw the completion of the Small Advance-Decline T discussed in the The October 15 2007 posting.
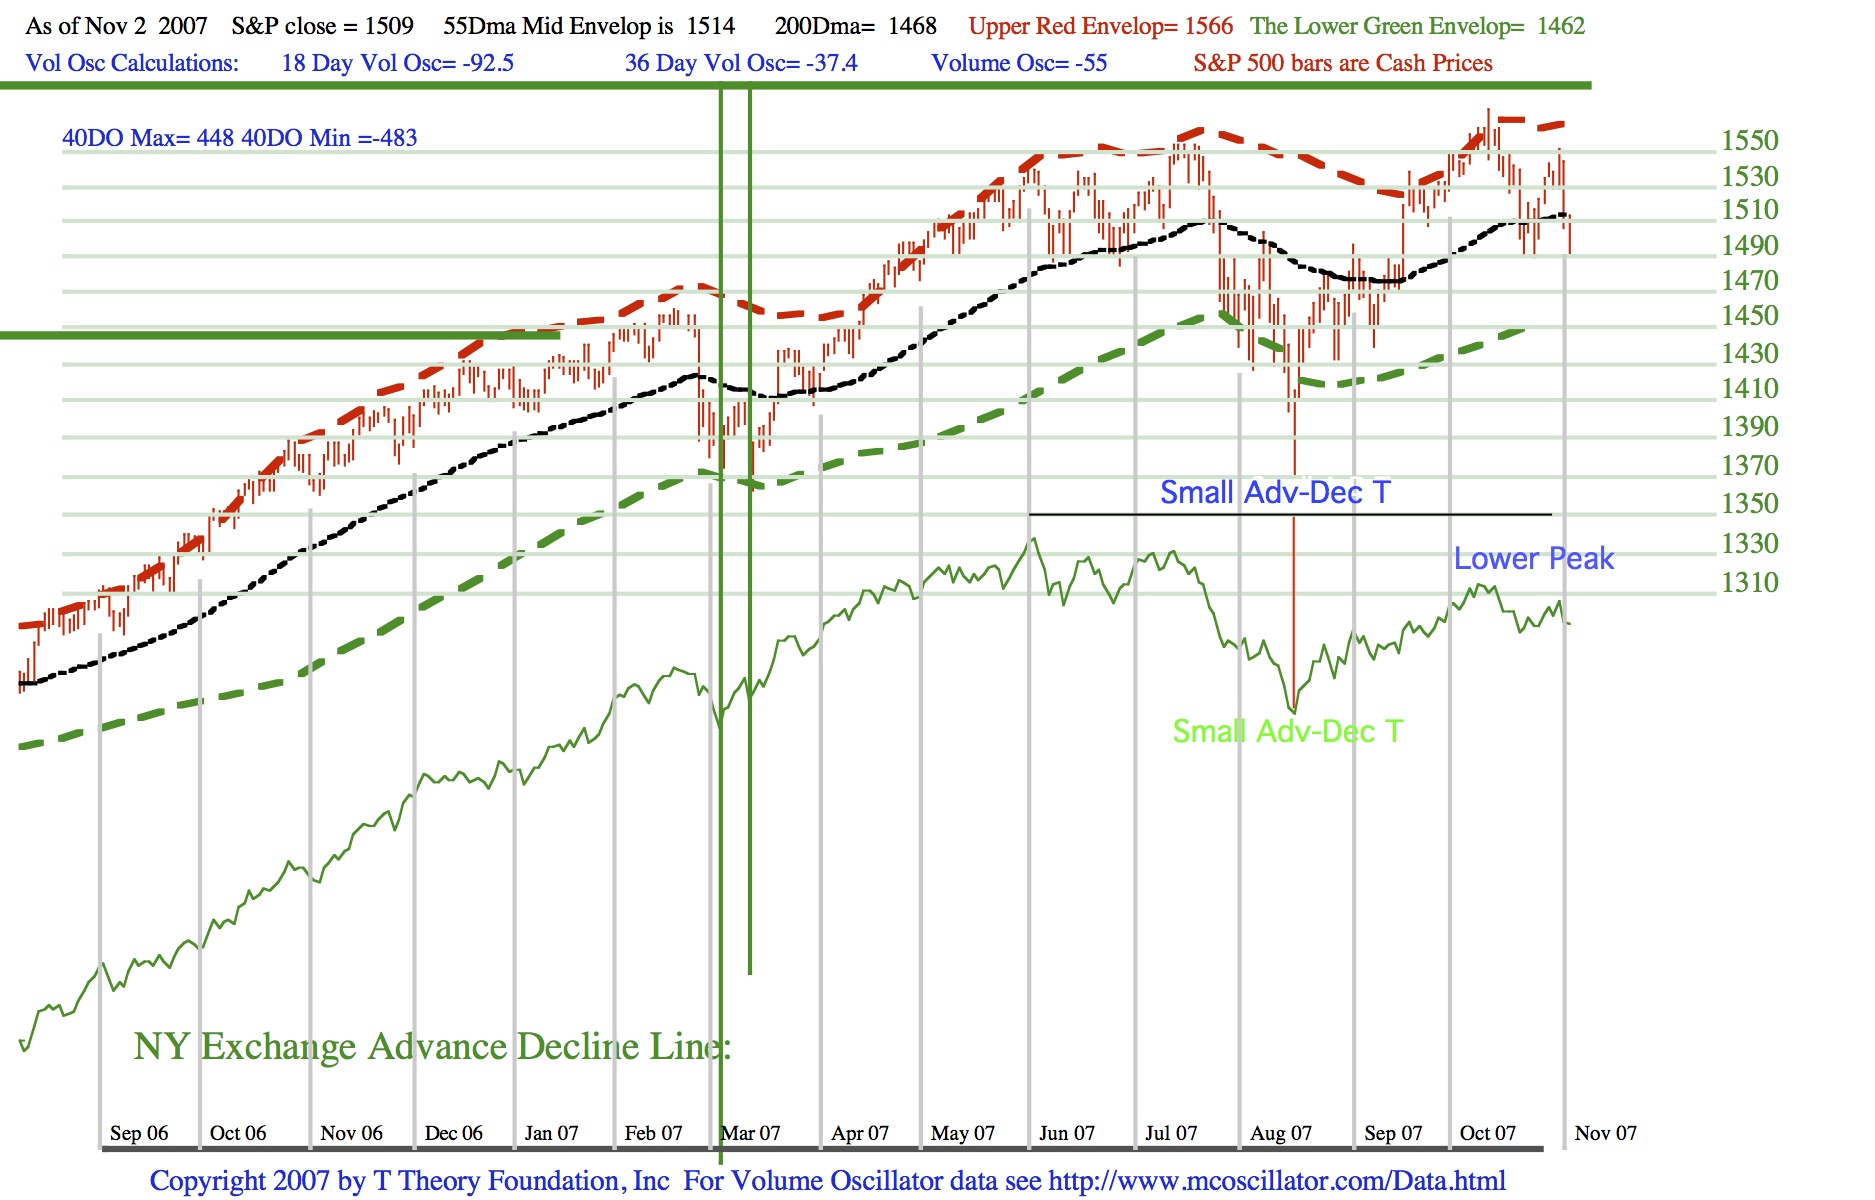
Looking ahead it is likely we will see a decline to the lower end of what looks to be a sideways trading range since the A-D line has made a lower peak at what presumably is the the end of the small A-D T.
In any case we need to let the next oversold condition develop naturally before looking for the next Short Range T that might be expected to produce the normal year end rally. It usually develops after tax loss selling for the calendar year has run its course.
Terry Laundry
****************************************************************************************
All Rights Reserved By The T Theory® Foundation ©
Order the T Theory® Encyclopedia
For a complete understanding of the T Theory® and how to successfully use Terry’s unique methods, order the Encyclopedia from Paula at the above link. There is additional material in the encyclopedia not covered here. Paula will be more than happy to answer your questions too.
Many thanks to Paula Burke for her permission to re-post Terry’s old T Theory® explanations. The period re-blogged on these pages are some of Terry Laundry’s best work and was published here from public domain.
****************************************************************************************
I claim no credit for the material found under T Theory® on this blog. All of this material is the creation of Terry Laundry and was downloaded from Terry’s free blog site (TypePad). I have created a mirror of Terry’s original material and now there is a second site containing Terry’s T Theory®. One or both of these websites hopefully will survive through time as Terry’s material is too important to be lost to the ravages of time. This site is simply a memorial to his lifetime work.
The page content re-blogged here is exactly as Terry created on his original webpages (saved on my computer with ScrapBook)). Nothing has been left out from the period Dec 2003 to June 2011. From Terry’s site, I made a lot of formatting changes, creating a more easily readable webpage appearance. The PDF chart duplicates of the JPEGs have been omitted for ease and speed of recreating Terry’s pages. References to PDF charts should be ignored (but no chart was left out).
After June 2011, Terry created a paid subscription website. None of that material is found here.
There were many many, many hours spent on this project; downloading Terry’s individual charts & audio files, followed by the uploading of Terry’s charts and audio to my WordPress blog library, after which I had to insert the uploaded material into my new T Theory® webpages (hopefully in the correct places). This was a dull and arduous project and I hope you enjoy it. I don’t believe there remains any more of Terry’s material in free domain, so my T Theory® project is probably finished. If I’ve missed something, you can leave me a comment.
If you find an uploaded reference error (chart or audio in the wrong place), please note the month and year of the webpage, plus the exact name of the referenced error file. Include any other info that will help me locate the problem file and where it occurs on the webpage. Leave a comment for me with the info and I’ll fix it.
Terry’s material is very long and will take many weeks for you to finish. Don’t hurry, it’s not a marathon and you will absorb more if you go through it at a reasonable rate. This is especially true for those who don’t invest in the T Theory® reference encyclopedia. The encyclopedia is a written reference for T Theory® and includes everything of importance for Terry’s T Theory®. Without the reference encyclopedia you must depend on your memory and Terry’s method carries some rules that you could easily violate. The encyclopedia also includes new information never seen on his website.
You are welcome to save any or all of my blog material to your computer. You also have my permission to re-blog my information, but you must (1) credit me and my blog in an obvious manner and (2) don’t change my material.
FYI – I find the best way to save a webpage is using “ScrapBook” (it’s an add-on for the FireFox browser). ScrapBook saves a webpage to your computer EXACTLY as it appears on the day you saved it. You can’t tell the difference between the internet webpage and your ScrapBook saved webpage. The saved pages are not pictures. Instead the pages consist of HTML and page functionality remains identical on your computer. There is also a second method for using ScrapBook, where you can save all of the webpages down to a defined link depth. This optional method means all links will function on your computer to the link depth specified (meaning you can click on links on your saved webpages and tunnel down into pages within pages). Saving the normal way will only save the top webpage but the links that exist could continue to function by taking you to the website on the internet instead of on your computer. But sometimes the linked website doesn’t exist anymore. I’ve had this happen on some very good webpages with unique information (they just disappear into the internet void). That’s a bummer when you lost some really good info and thus rose my need for ScrapBook. You can also filter the pages saved using the optional ScrapBook method, which can exclude all pages not coming directly from the specified website (filtering is recommended using this method otherwise you wind up with a LOT of useless stuff).
.
Explore posts in the same categories: . . . T Theory®
Leave A Reply