October 2007 – T Theory® Update

The October 29 2007 Short Range T Update
Last week saw the S&P begin its final rally for the current T coming off the 55 day MA support level. See the updated chart at the link below.
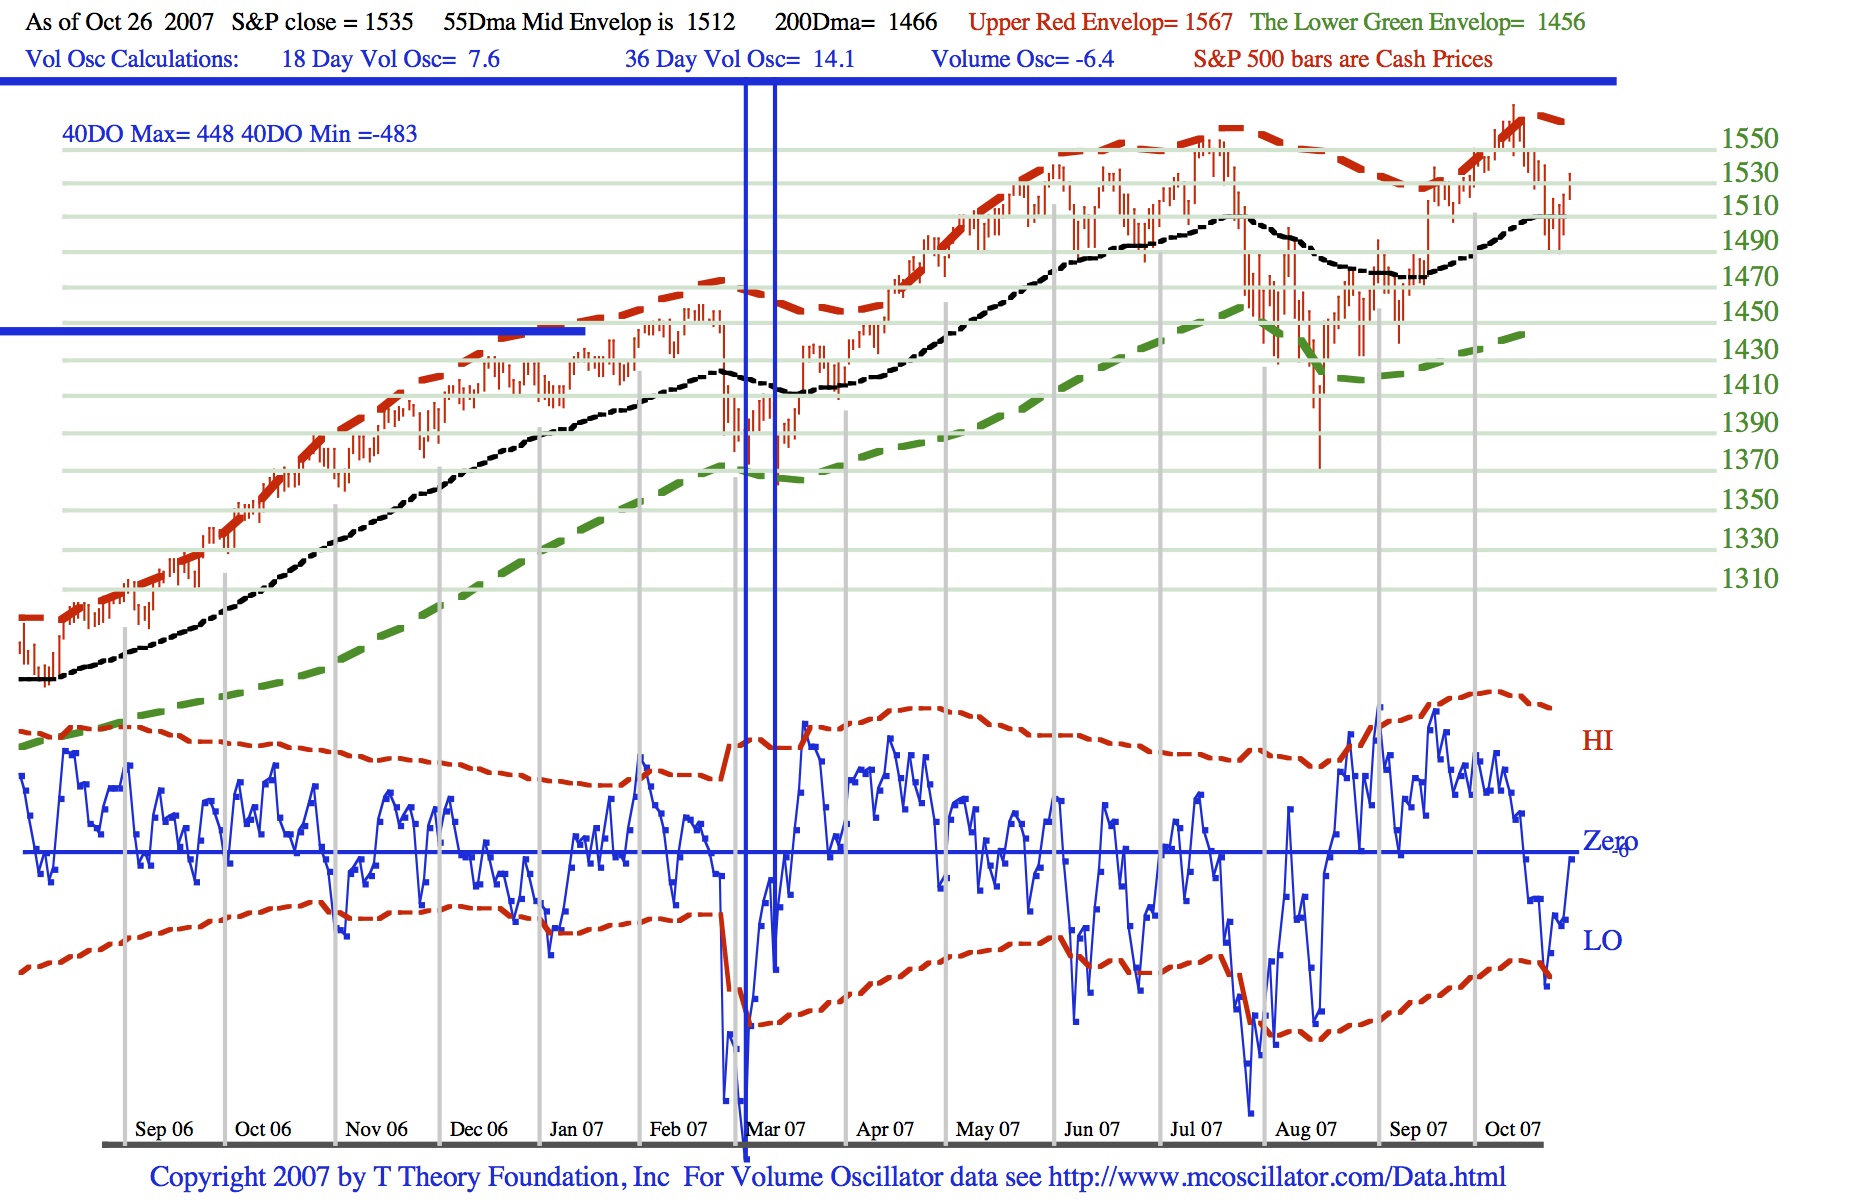
The peak for this phase is likely to be in the early November period after which a correction should occur as we move further into November. Next week I will begin the theory of the new T which should provide a good rally to finish 2007.
The October 22 2007 Short Range T with Envelope Theory Update
Last week saw the S&P drop to 1500 near the 55 day MA support level 1510 which should provide its normal support for a brief ( like 5-7 days or so) rally. See the updated chart at the link below.
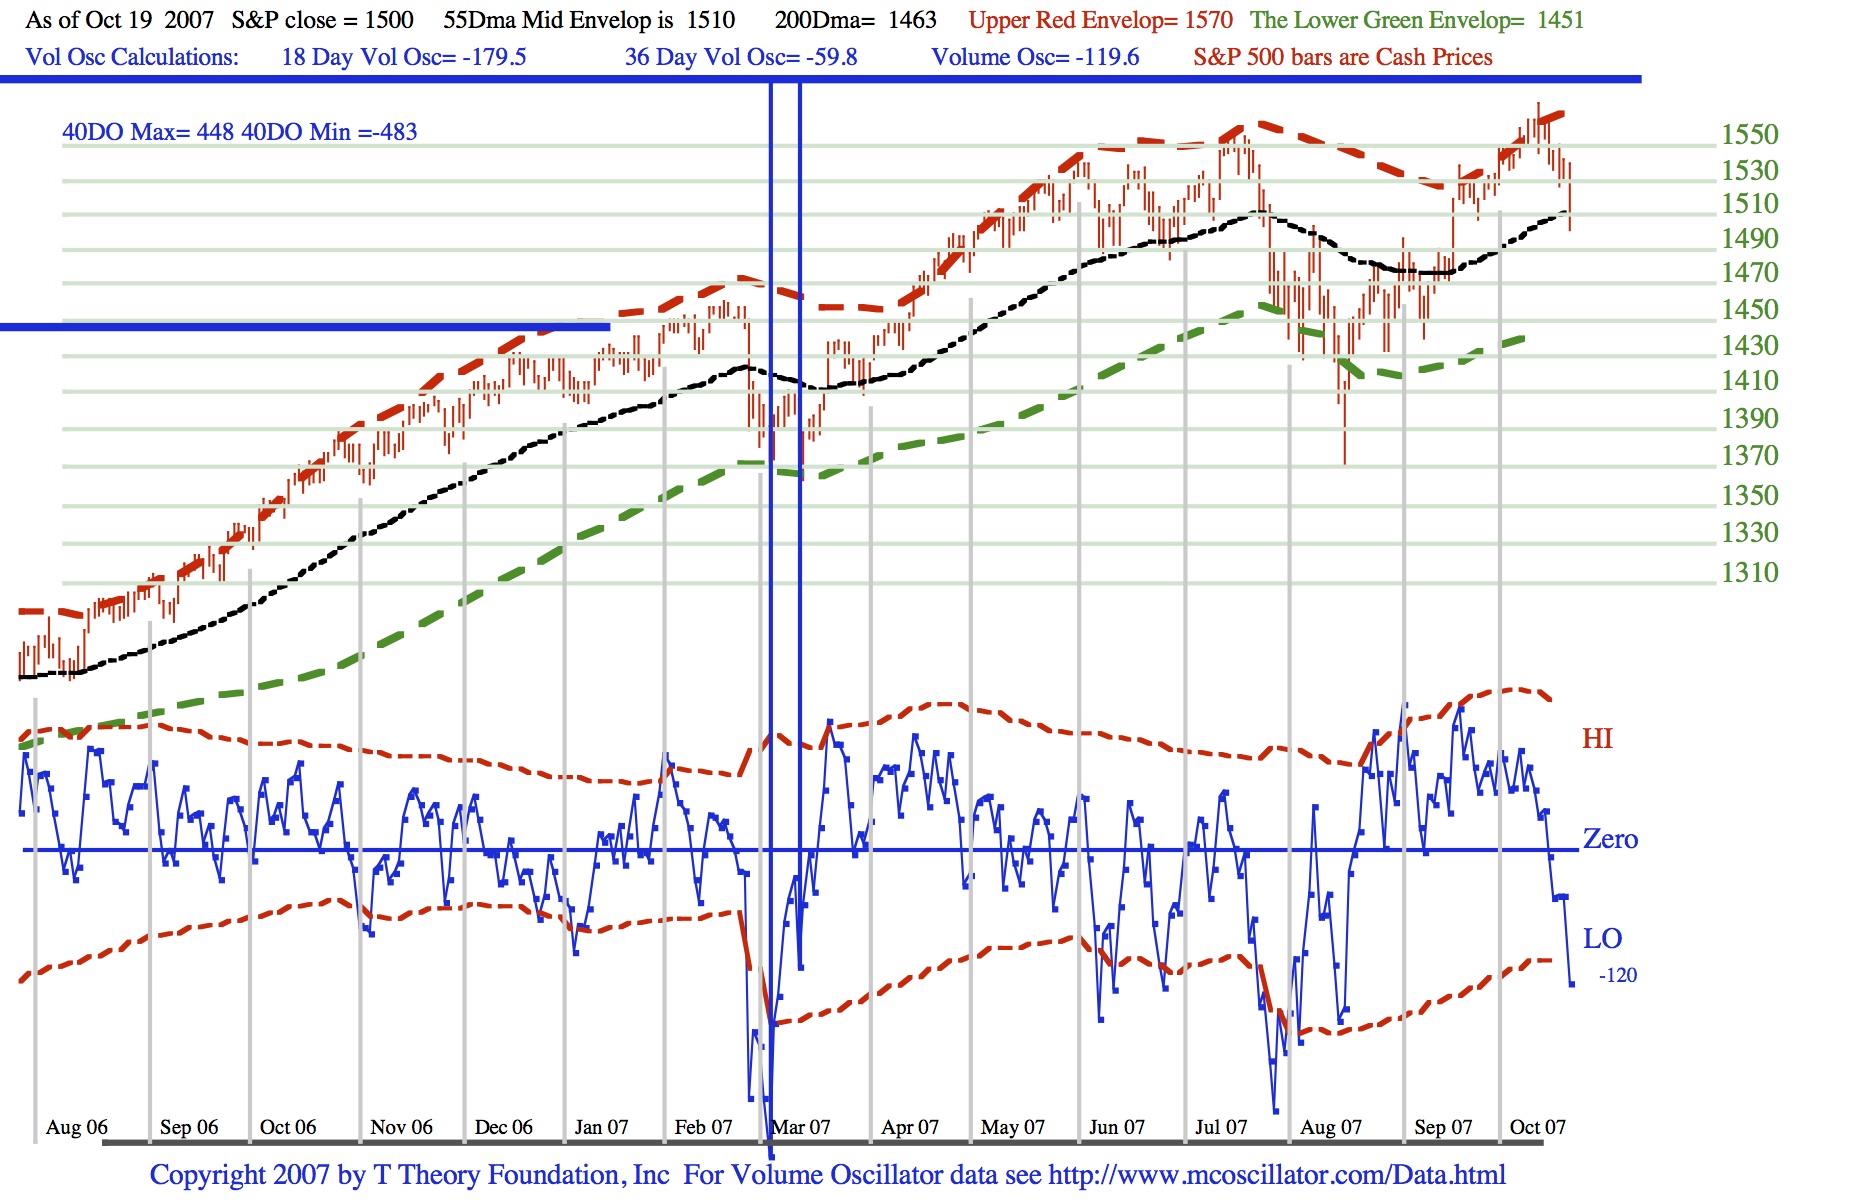
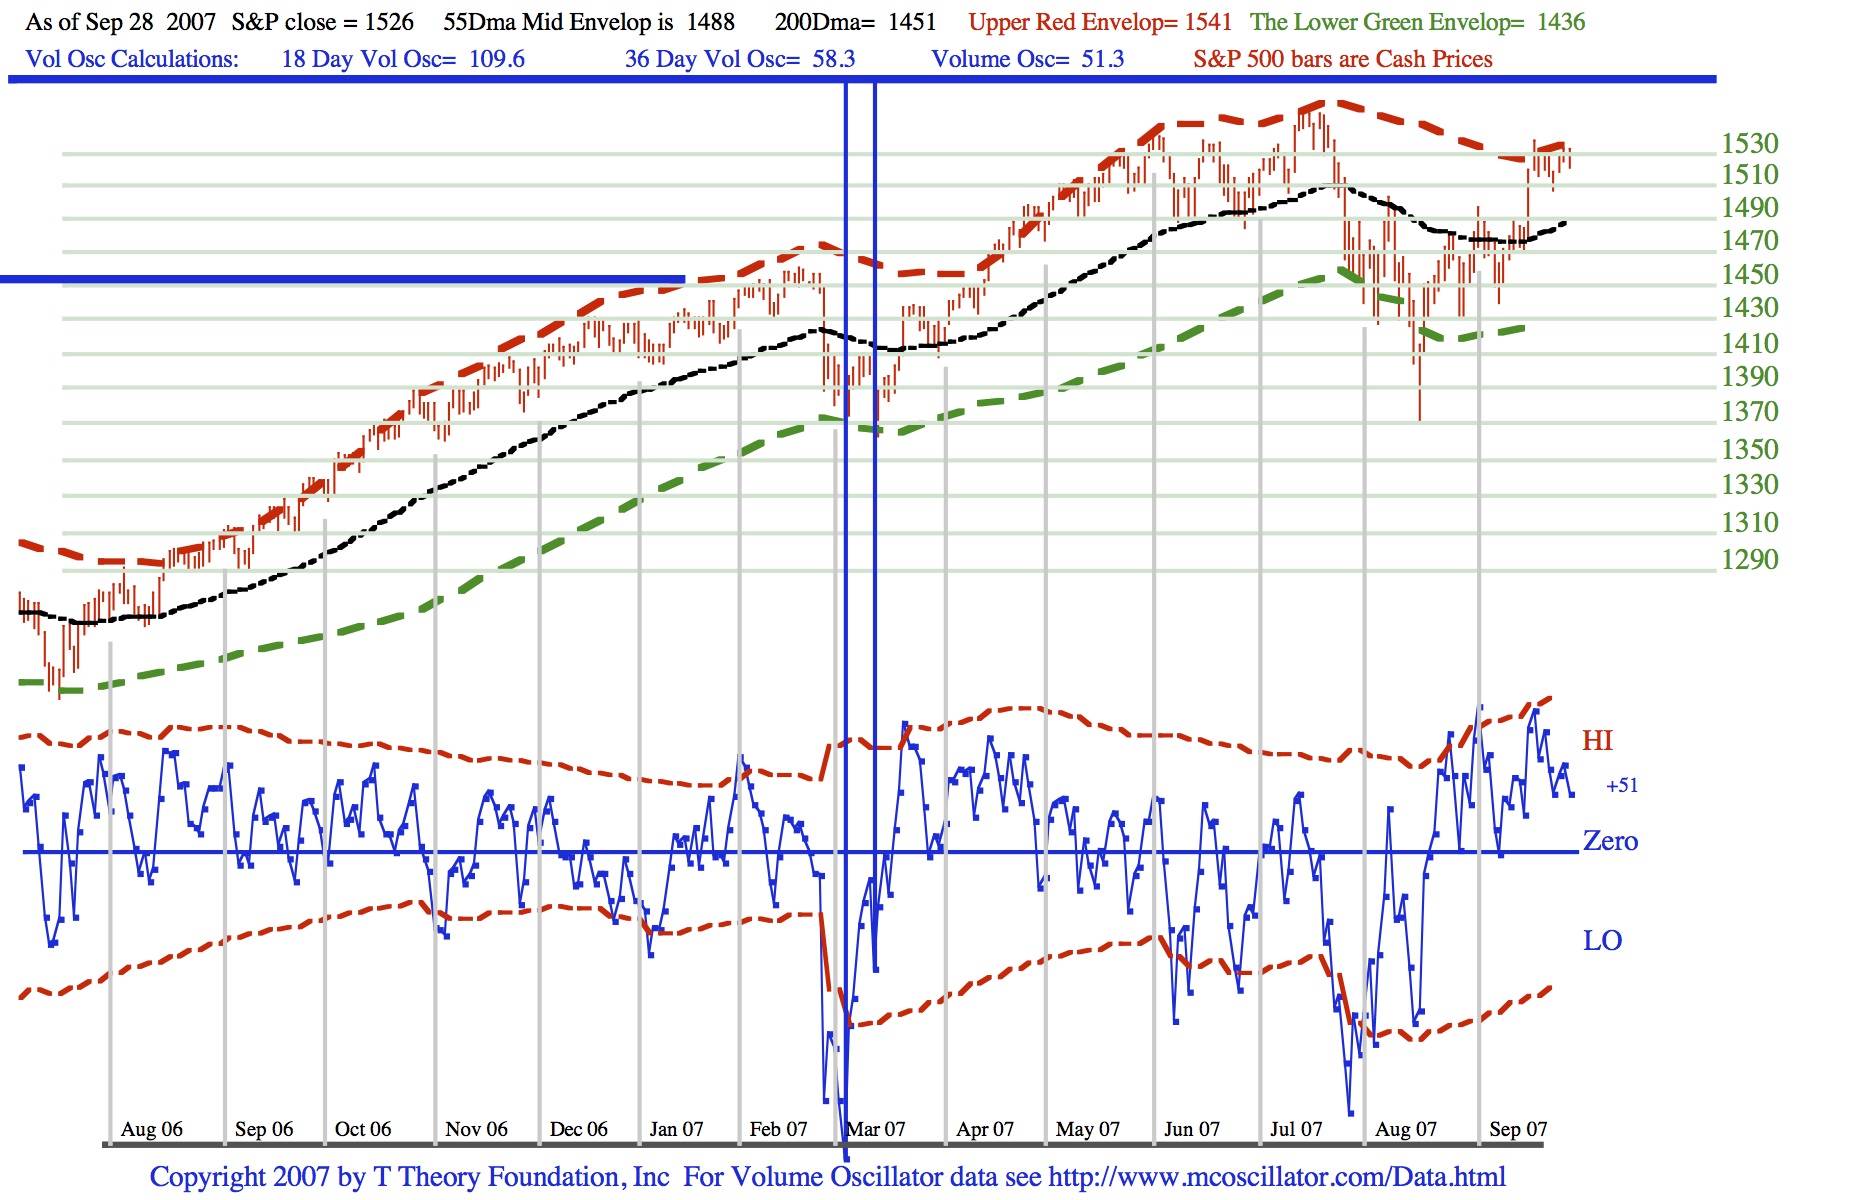
Two weeks ago I wrote that the recent history for this bull market has been to see the up-trend signal its topping by first falling to the black 55 day MA line at the mid channel of the envelopes, then rally back up to the old highs near the upper red envelope and finally fall more seriously to the lower green dashed line marking the lower envelope. This sequence can be seen during the earlier June/July period in this chart.
The new piece of information from last week came on Friday when the Arms Ratio (also known as TRIN) rose to the extreme high of 3.5, in line with its extreme oversold reading that occurred at the mid August Low. This technical overbought/oversold indicator was developed by Richard Arms and can be searched on the web for a more complete description if you are interested.
I have produced many long term studies of this indicator in the past and finally concluded that its usefulness was largely confined to the very rare cases when its value deviated very far from its neutral reading of 1.00. This occurred in mid August and again last Friday so some sort of rally is likely if the S&P can gain footing not too far below the 55 Day MA.
So for this week I will be looking for evidence the S&P can stabilize at the 55 DAy MA then mount a sharp rally into the old highs for a brief period, typically a week or so. Next Monday I will repost and we will see if this indicator is worth adding to the bottom of the current chart for those rare times when it has something important to say.
The October 15 2007 Short Range T with Advance-Decline Line Update
The general status of the indicators in the updated chart below continues to be an overbought market but one with sufficient upside momentum to reach the current T’s projected early November peak. Note the S&P 500 is steadily riding against the upper envelope limit.
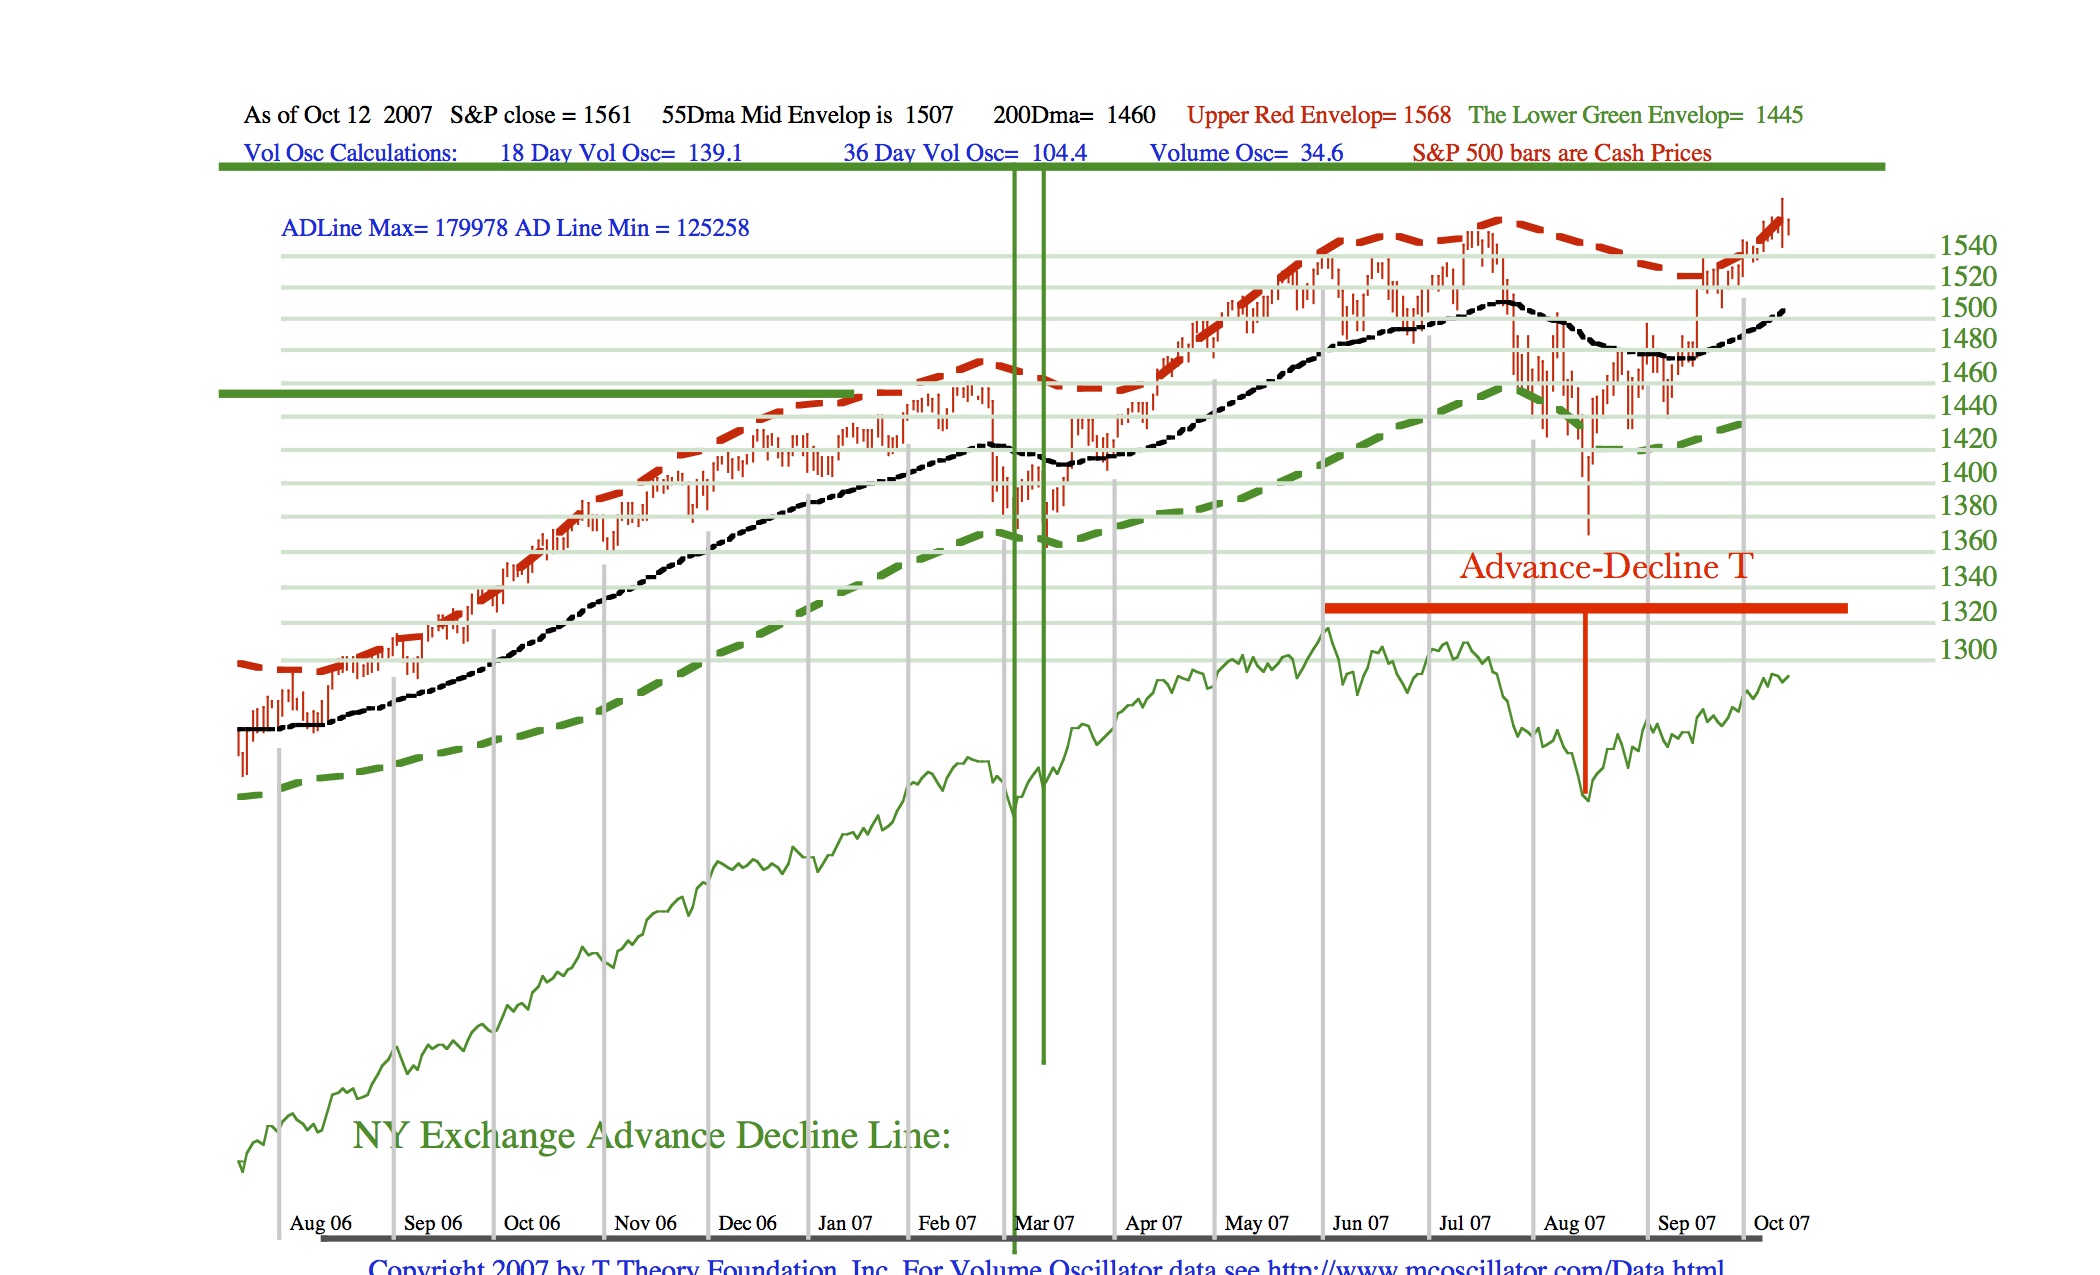
Also note in this update I have replaced the lower volume oscillator plot with a simple green Advance-Decline Line plot for the NY Exchange and added a simple time symmetrical Advance-Decline T in red. Both the regular Volume Oscillator T and this simple T project a late October or early November peak.
The October 8 2007 Short Range T and Envelope Update
The general status of the indicators in the updated chart below continues to be an overbought market but one with sufficient upside momentum to reach the current T’s projected early November peak.
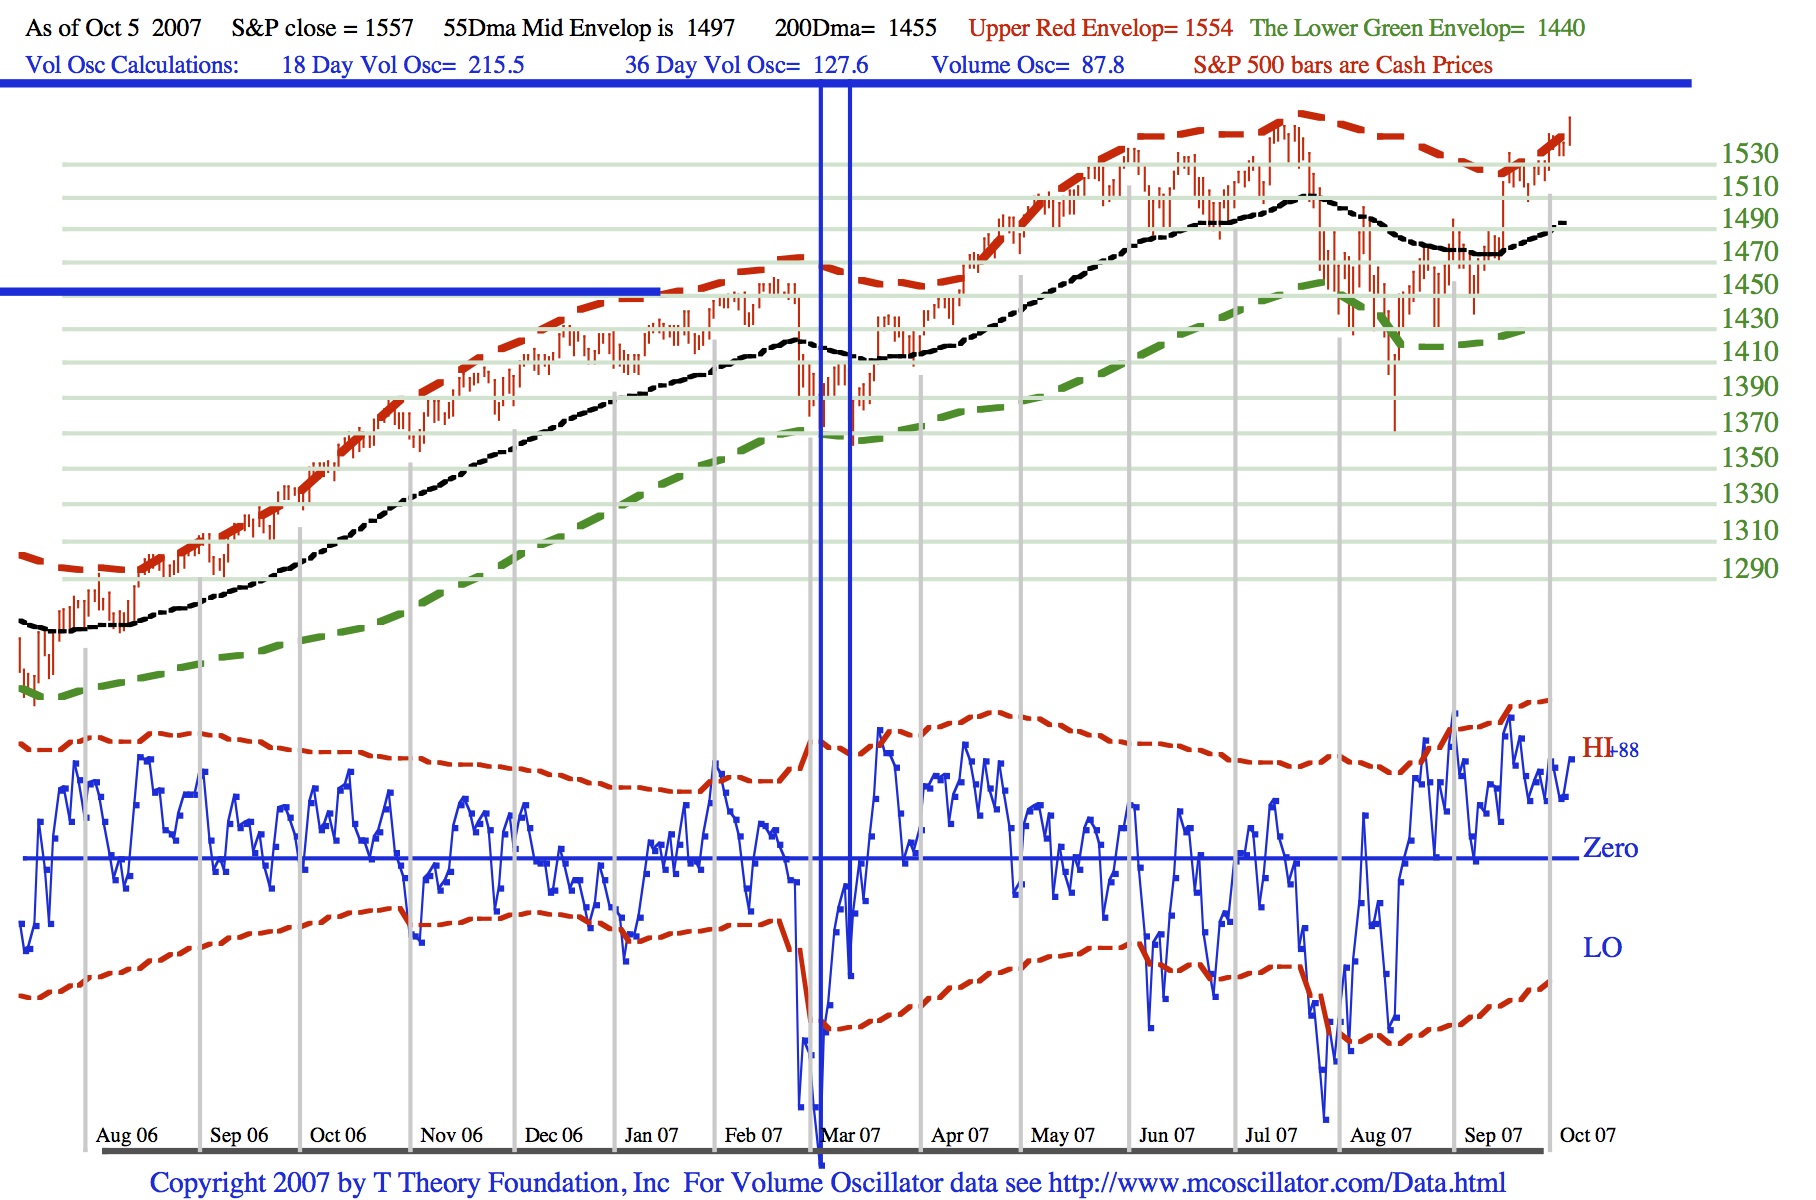
As long as any significant corrections hold the 55 day moving average at the black line in the chart, currently 1497 and rising, the projected up trend is OK from a historical perspective. In the recent past the pre-warning of a more important correction has come when the up-trend weakened to the point that a correction down to this key support level was necessary, after which, a bounce up to a retest of the old highs followed with greatly diminished enthusiasm.
If no such weakness sets in during October, a better way to confirm this Volume Oscillator T’s projection, which you can see is derived from the distant March 07 low, is to switch over to a shorter term Advance-Decline T with its center post in the mid August period. This very much to be preferred because the projection time is much shorter.
You can do this on your own for now, but I will switch to a daily chart of the cumulative NY Exchange Advance-Decline Line in my next next Monday posting, and from then on, I will work out the more precise time symmetry in order to illustrate the basic T Theory time symmetry as a real time example.
The October 1 2007 Short Range T and Envelope Update
The S&P 500 plot relative to its Red and Green (Max and Min) envelopes and the Volume oscillator as noted in my updated chart at the PDF link below are both in typical market over-bought conditions, so minor corrections can be expected within an overall up-trend. T Theory sees the momentum lasting into early November via the current T’s peak, at the right end time period of the T.
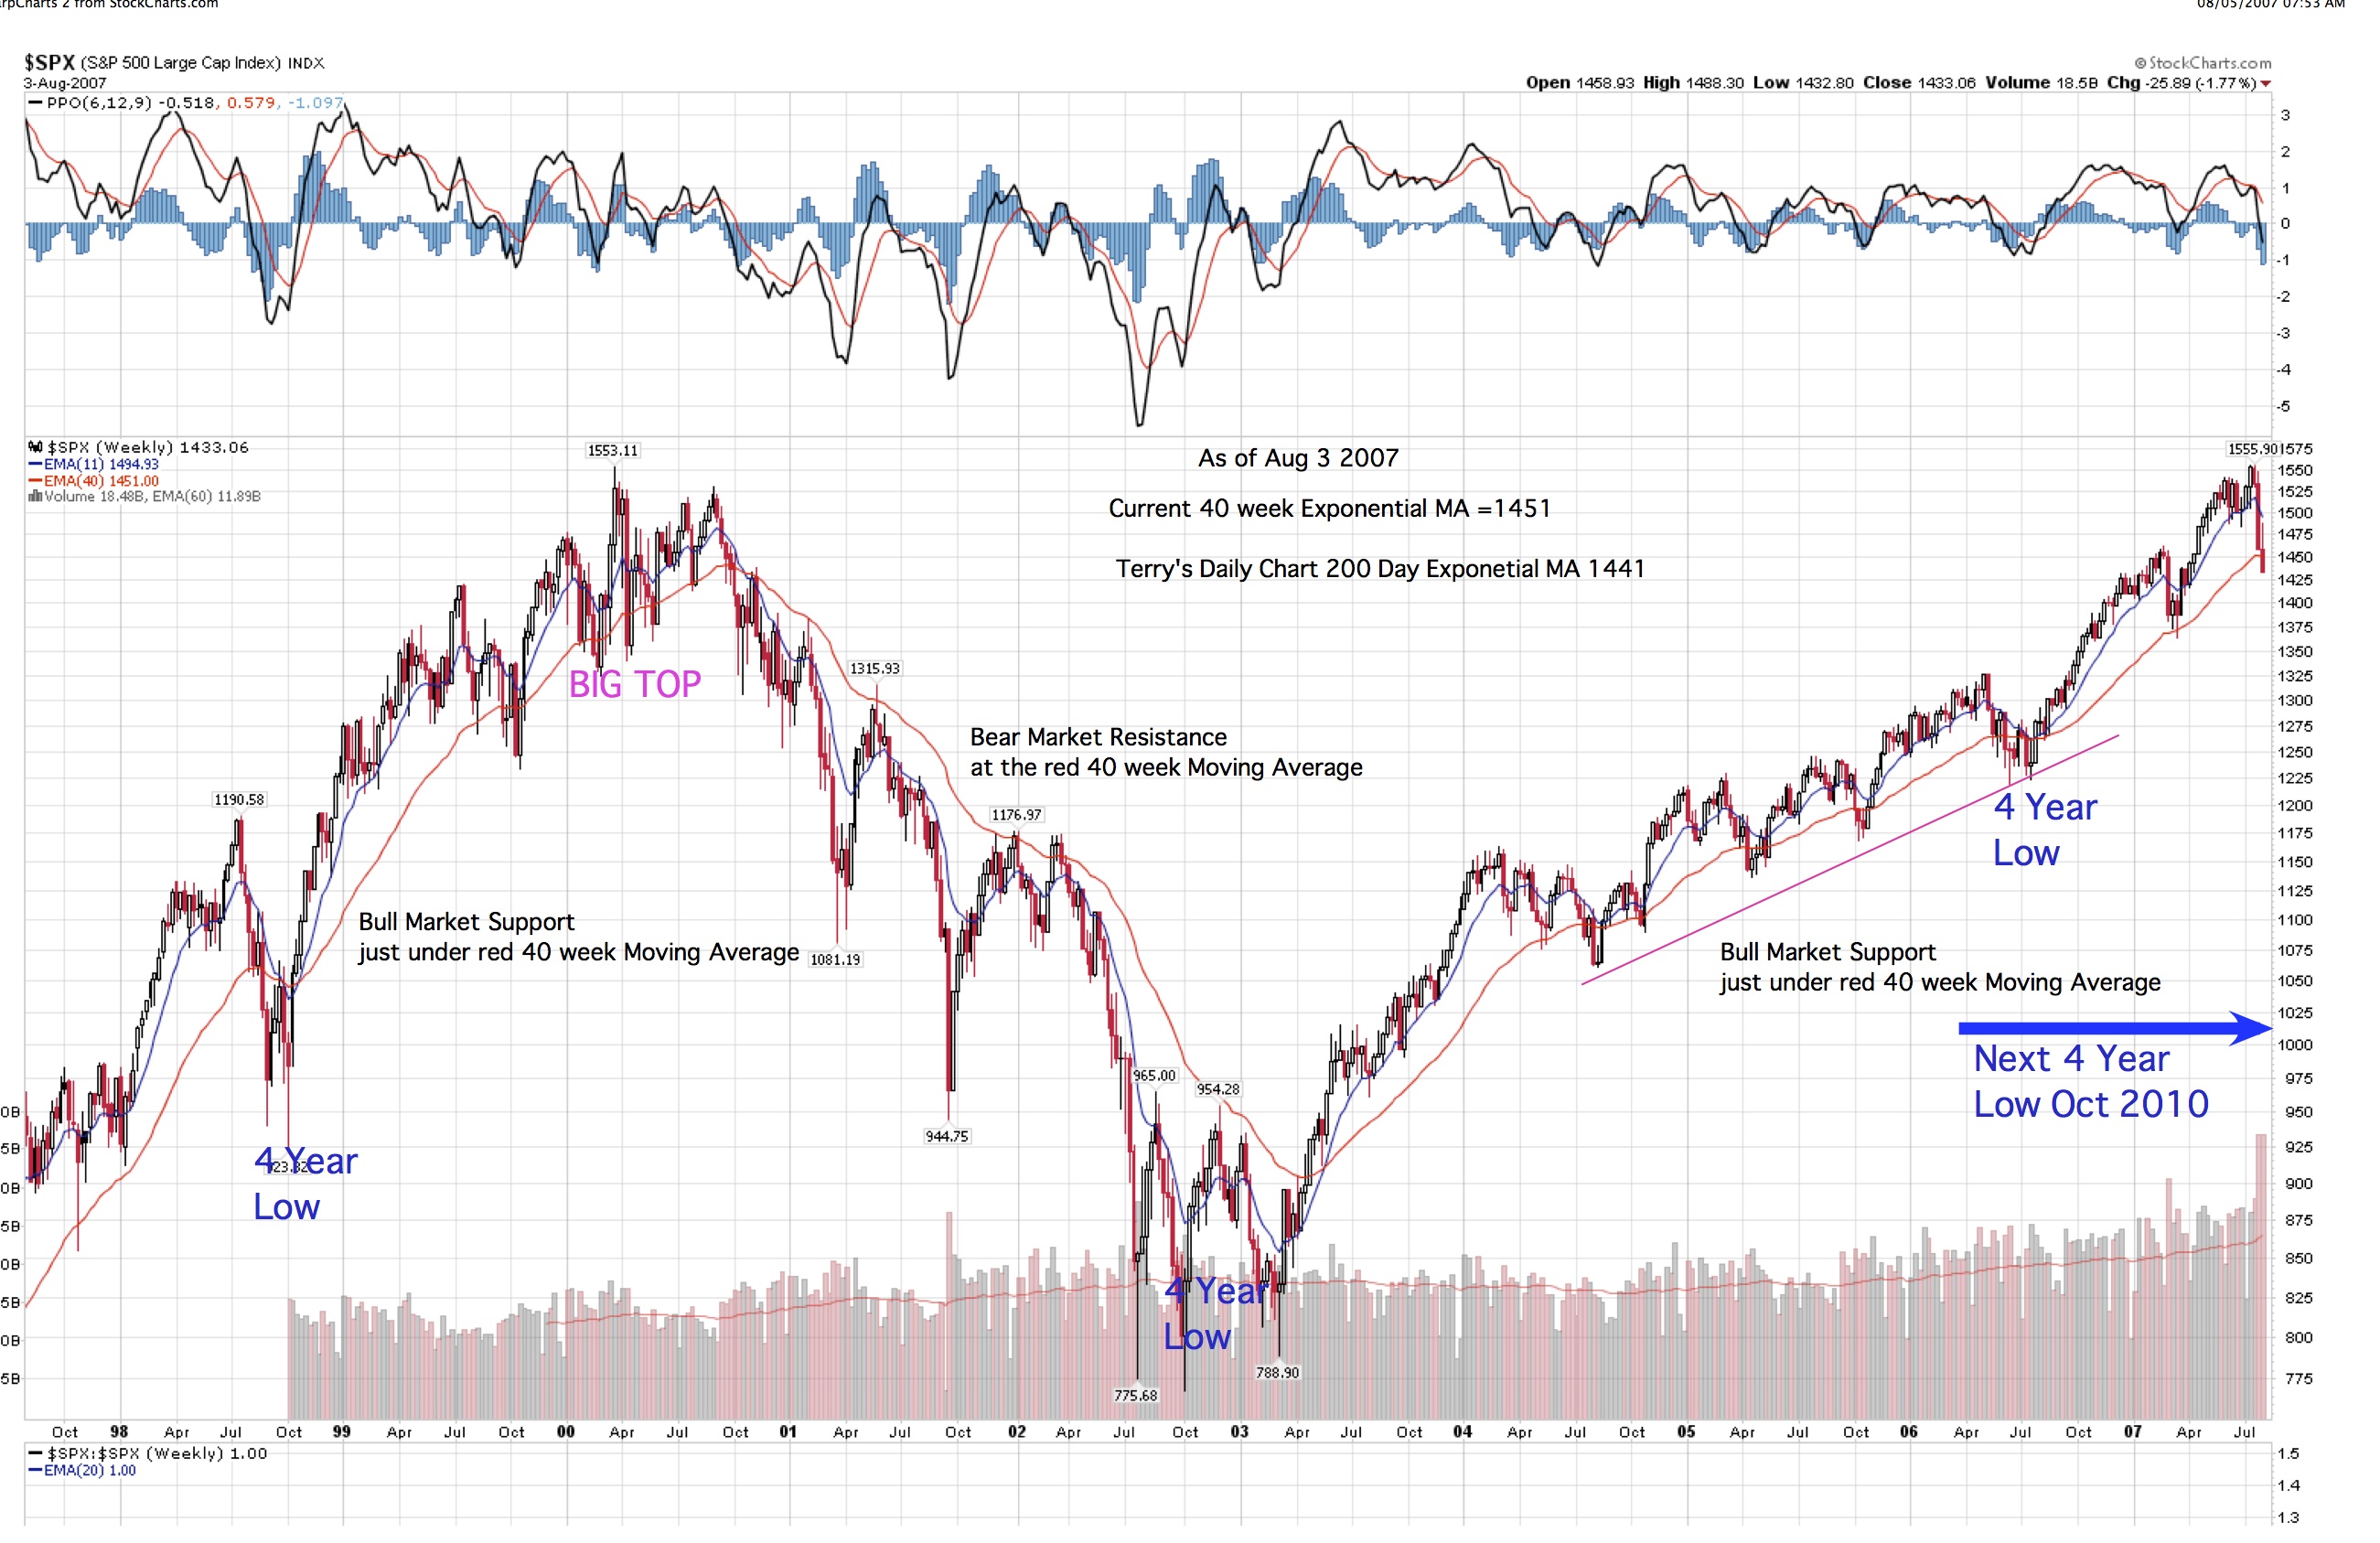
During October this would be the basic forecast from the long spanning T that has seen a serious, but not fatal dip, within its right side. It is believed that the August dip and subsequent the recovery so far is part of the long range Advance-Decline Ts projection of a major peak for equities in late 2007, with a decline beginning into the next 4 year cycle low previously estimated in the general October 2010 period.
We need to monitor this eventuality, but for now the daily swings within the envelopes are key. A successful early November peak could represent one major top for equities.
Any correction back to the black 55 day Ma is not likely to be serious, but a rally from this key resistance level, if it occurs, should be sold. If the current rally hangs tough during October and does not see a correction back to the 55 day MA, then a correction thereafter, can still recover using the alternate T construction for a year end peak as per my last update.
The issue here is that the long range T could produce a series of peaks into the Fall, any of which could represent the final topping phase of the A-D T. Most of my future analysis will concentrate on the possibility that a major peak is developing over this general time period.
So in the end, the major work for October, November and December will be to confirm (or not) the long term Advance-Decline Ts major peak forecast for the late 2007 period has occurred and whether its forecast of long term decline into the next 4 year low (roughly Oct 2010) looks to be developing normally in technical trend terms.
Terry Laundry
****************************************************************************************
All Rights Reserved By The T Theory® Foundation ©
Order the T Theory® Encyclopedia
For a complete understanding of the T Theory® and how to successfully use Terry’s unique methods, order the Encyclopedia from Paula at the above link. There is additional material in the encyclopedia not covered here. Paula will be more than happy to answer your questions too.
Many thanks to Paula Burke for her permission to re-post Terry’s old T Theory® explanations. The period re-blogged on these pages are some of Terry Laundry’s best work and was published here from public domain.
****************************************************************************************
I claim no credit for the material found under T Theory® on this blog. All of this material is the creation of Terry Laundry and was downloaded from Terry’s free blog site (TypePad). I have created a mirror of Terry’s original material and now there is a second site containing Terry’s T Theory®. One or both of these websites hopefully will survive through time as Terry’s material is too important to be lost to the ravages of time. This site is simply a memorial to his lifetime work.
The page content re-blogged here is exactly as Terry created on his original webpages (saved on my computer with ScrapBook)). Nothing has been left out from the period Dec 2003 to June 2011. From Terry’s site, I made a lot of formatting changes, creating a more easily readable webpage appearance. The PDF chart duplicates of the JPEGs have been omitted for ease and speed of recreating Terry’s pages. References to PDF charts should be ignored (but no chart was left out).
After June 2011, Terry created a paid subscription website. None of that material is found here.
There were many many, many hours spent on this project; downloading Terry’s individual charts & audio files, followed by the uploading of Terry’s charts and audio to my WordPress blog library, after which I had to insert the uploaded material into my new T Theory® webpages (hopefully in the correct places). This was a dull and arduous project and I hope you enjoy it. I don’t believe there remains any more of Terry’s material in free domain, so my T Theory® project is probably finished. If I’ve missed something, you can leave me a comment.
If you find an uploaded reference error (chart or audio in the wrong place), please note the month and year of the webpage, plus the exact name of the referenced error file. Include any other info that will help me locate the problem file and where it occurs on the webpage. Leave a comment for me with the info and I’ll fix it.
Terry’s material is very long and will take many weeks for you to finish. Don’t hurry, it’s not a marathon and you will absorb more if you go through it at a reasonable rate. This is especially true for those who don’t invest in the T Theory® reference encyclopedia. The encyclopedia is a written reference for T Theory® and includes everything of importance for Terry’s T Theory®. Without the reference encyclopedia you must depend on your memory and Terry’s method carries some rules that you could easily violate. The encyclopedia also includes new information never seen on his website.
You are welcome to save any or all of my blog material to your computer. You also have my permission to re-blog my information, but you must (1) credit me and my blog in an obvious manner and (2) don’t change my material.
FYI – I find the best way to save a webpage is using “ScrapBook” (it’s an add-on for the FireFox browser). ScrapBook saves a webpage to your computer EXACTLY as it appears on the day you saved it. You can’t tell the difference between the internet webpage and your ScrapBook saved webpage. The saved pages are not pictures. Instead the pages consist of HTML and page functionality remains identical on your computer. There is also a second method for using ScrapBook, where you can save all of the webpages down to a defined link depth. This optional method means all links will function on your computer to the link depth specified (meaning you can click on links on your saved webpages and tunnel down into pages within pages). Saving the normal way will only save the top webpage but the links that exist could continue to function by taking you to the website on the internet instead of on your computer. But sometimes the linked website doesn’t exist anymore. I’ve had this happen on some very good webpages with unique information (they just disappear into the internet void). That’s a bummer when you lost some really good info and thus rose my need for ScrapBook. You can also filter the pages saved using the optional ScrapBook method, which can exclude all pages not coming directly from the specified website (filtering is recommended using this method otherwise you wind up with a LOT of useless stuff).
.
Explore posts in the same categories: . . . T Theory®
Leave A Reply