December 2007 – T Theory® Update

T Theory Update for December 31 2007
As per the PDF chart below which you should down load, I believe the S&P is only poised for a short rally during the first week of 2008, after which the weakening Advance-Decline Line chart readily evident in the chart will begin to roll the market downward into a new long term, 2 to 3 year bear market amounting to some 35% or more in the popular indexes.
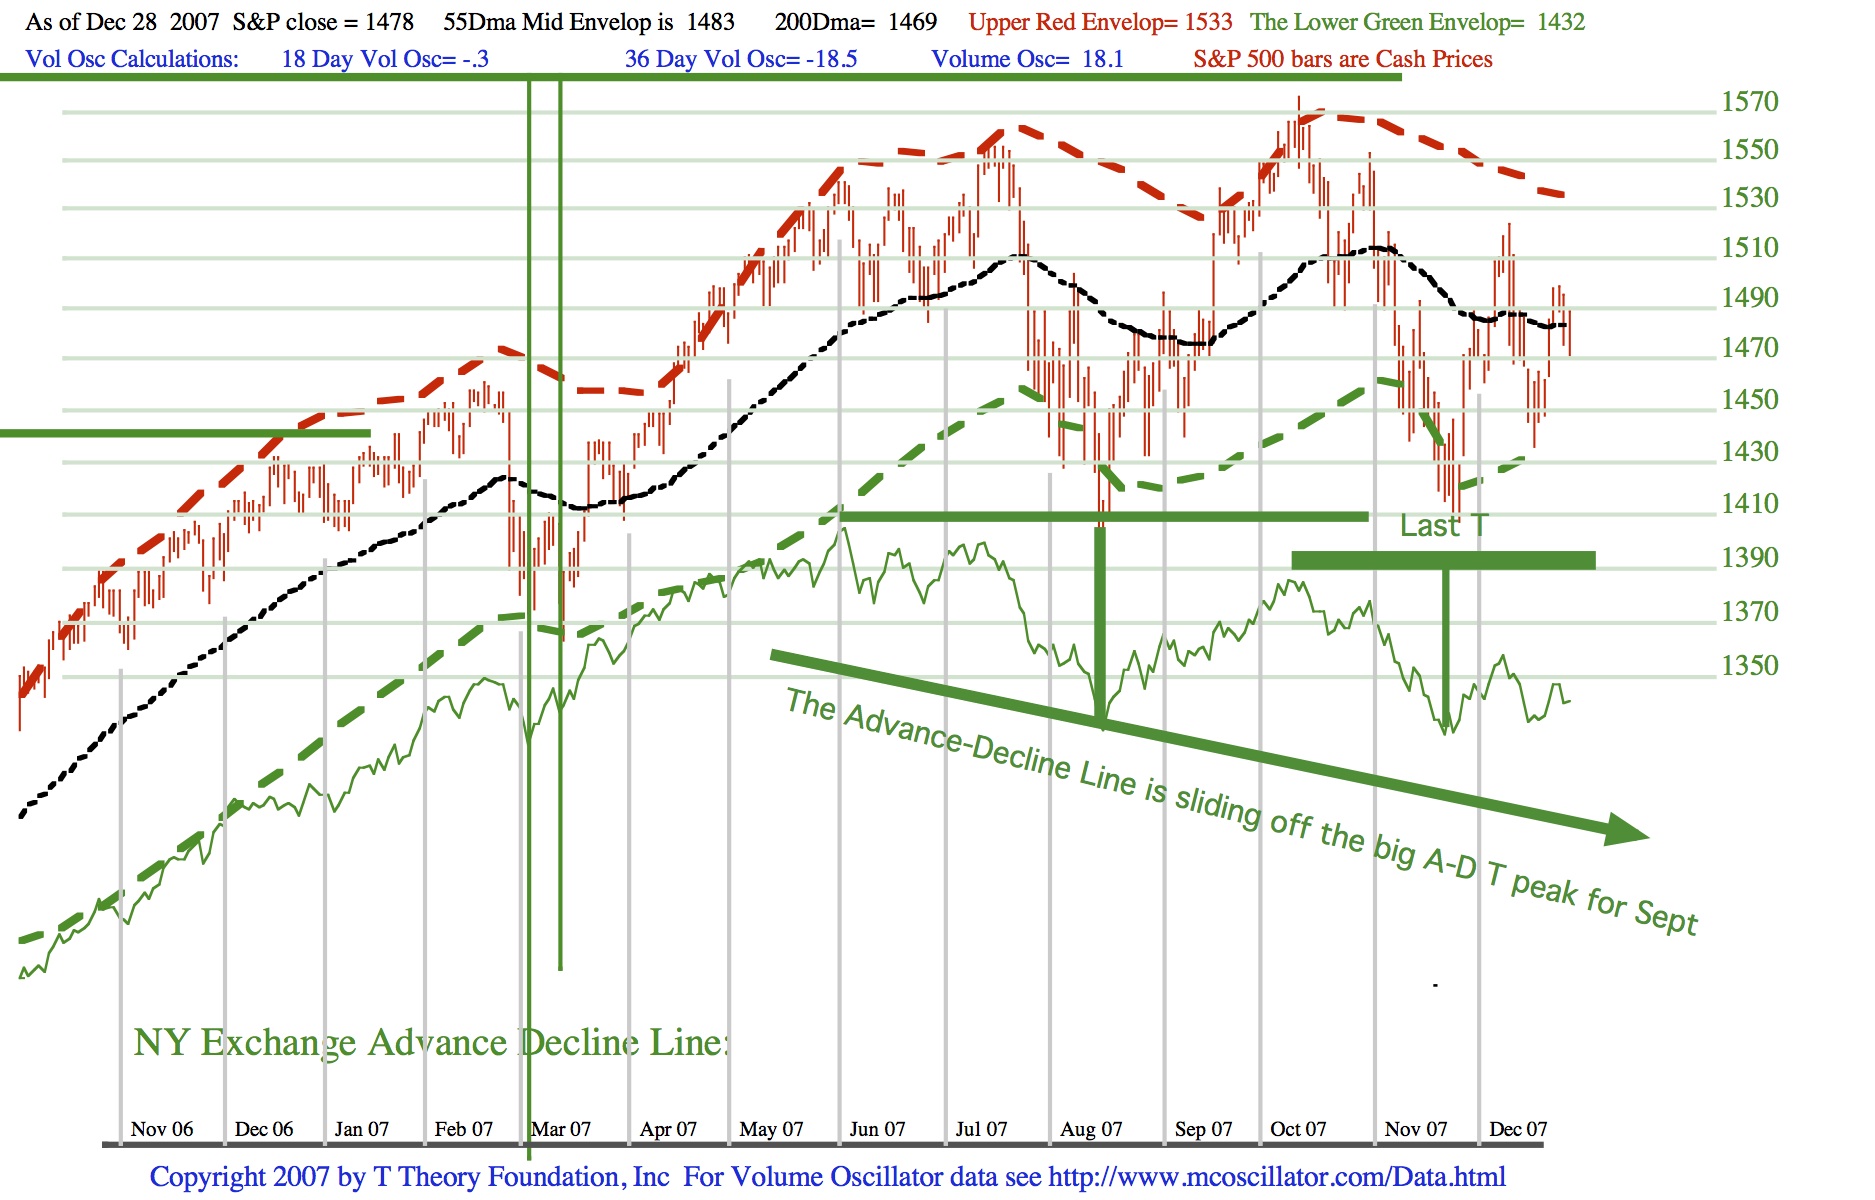
We will have plenty of time to study and refine the technical picture during the new year. The critical point I am noting in today’ chart is the very weak green A-D line trend in the chart which confirms, at least in my mind, the Big A-D Ts forecast from the late 2002/early 2003 double bottom of a projected peak in the late Fall of this year is gradually beginning to take affect.
The small Last A-D T is my best current judgement for a T Theory time projection of a final market top, but in a weak environment, all that can be expected is 2 or 3 day rally in the blue volume oscillator before a new overbought condition halts the recovery attempt. After that we may lose the long term momentum which is becoming dangerously negative.
During 2008 I will produce a long series of such T forecasts starting back from 1929 in order to summarize the bear market history from a long historical perspective. In general once an A-D T has been confirmed, the market usually begins the new bear market, but sometimes the market hangs up in a trading range before the major down trend begins. Subsequent declines average over 35% on any of the general market averages and takes some 2 or 3 years to be completed. We will check this out next year.
Next update Monday Jan 7 2008.
T Theory Update for December 24 2007
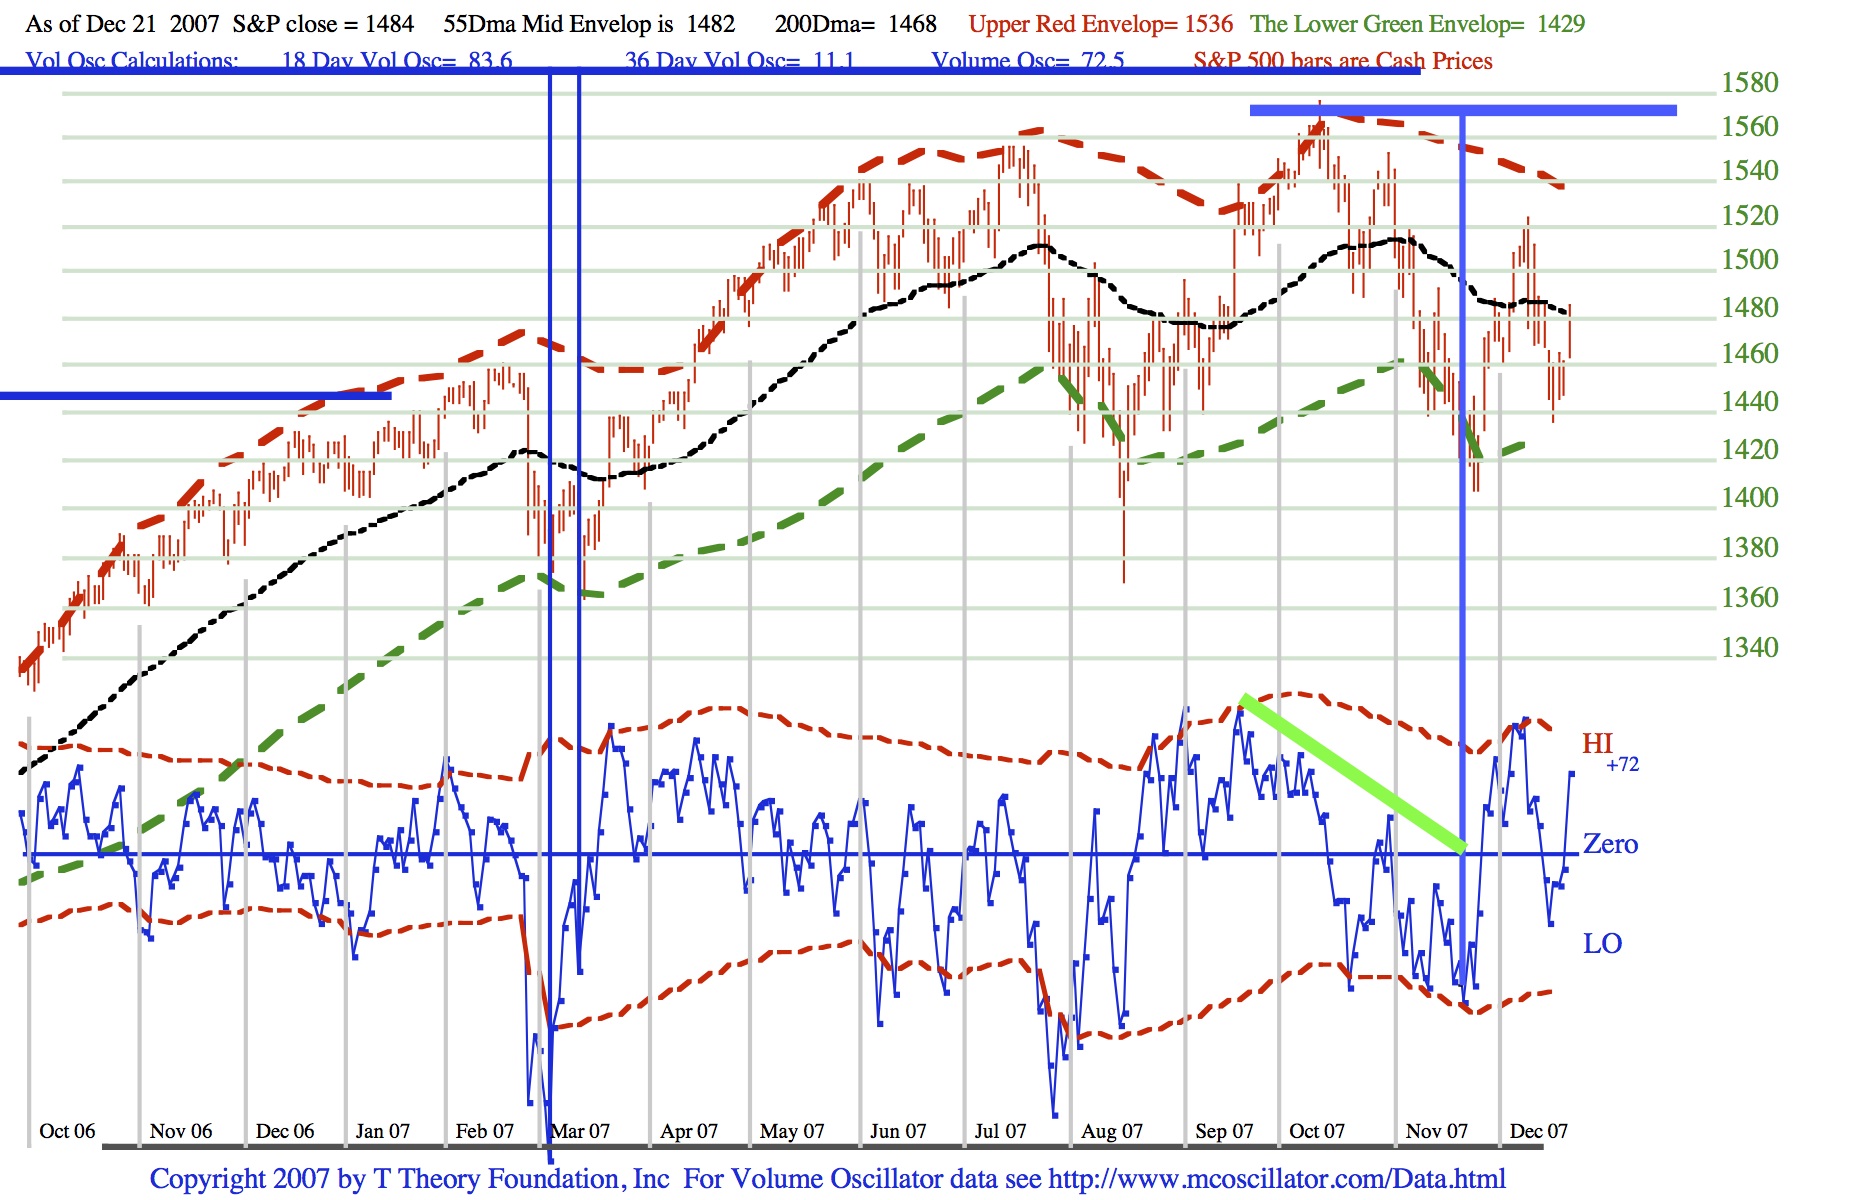
Best wishes for the Holidays. Upside progress is satisfactory as per the latest chart below. Next update Dec 31.
T Theory Update for December 17 2007
This week the S&P has corrected severely but I believe there is still enough upside left in the recent recovery to bring the market up to an important peak in line with normal seasonal and end of month characteristics which I discussed last month. I would look for the peak at year end or early January based on the daily Advance-Decline T shown in today’s posting below but would further refine it in terms of the S&P 500 red dashed upper envelope which looks for a high around 1542 on the cash price during an expected price surge into the new year.
Click on the link below to download the December 14th daily PDF chart.
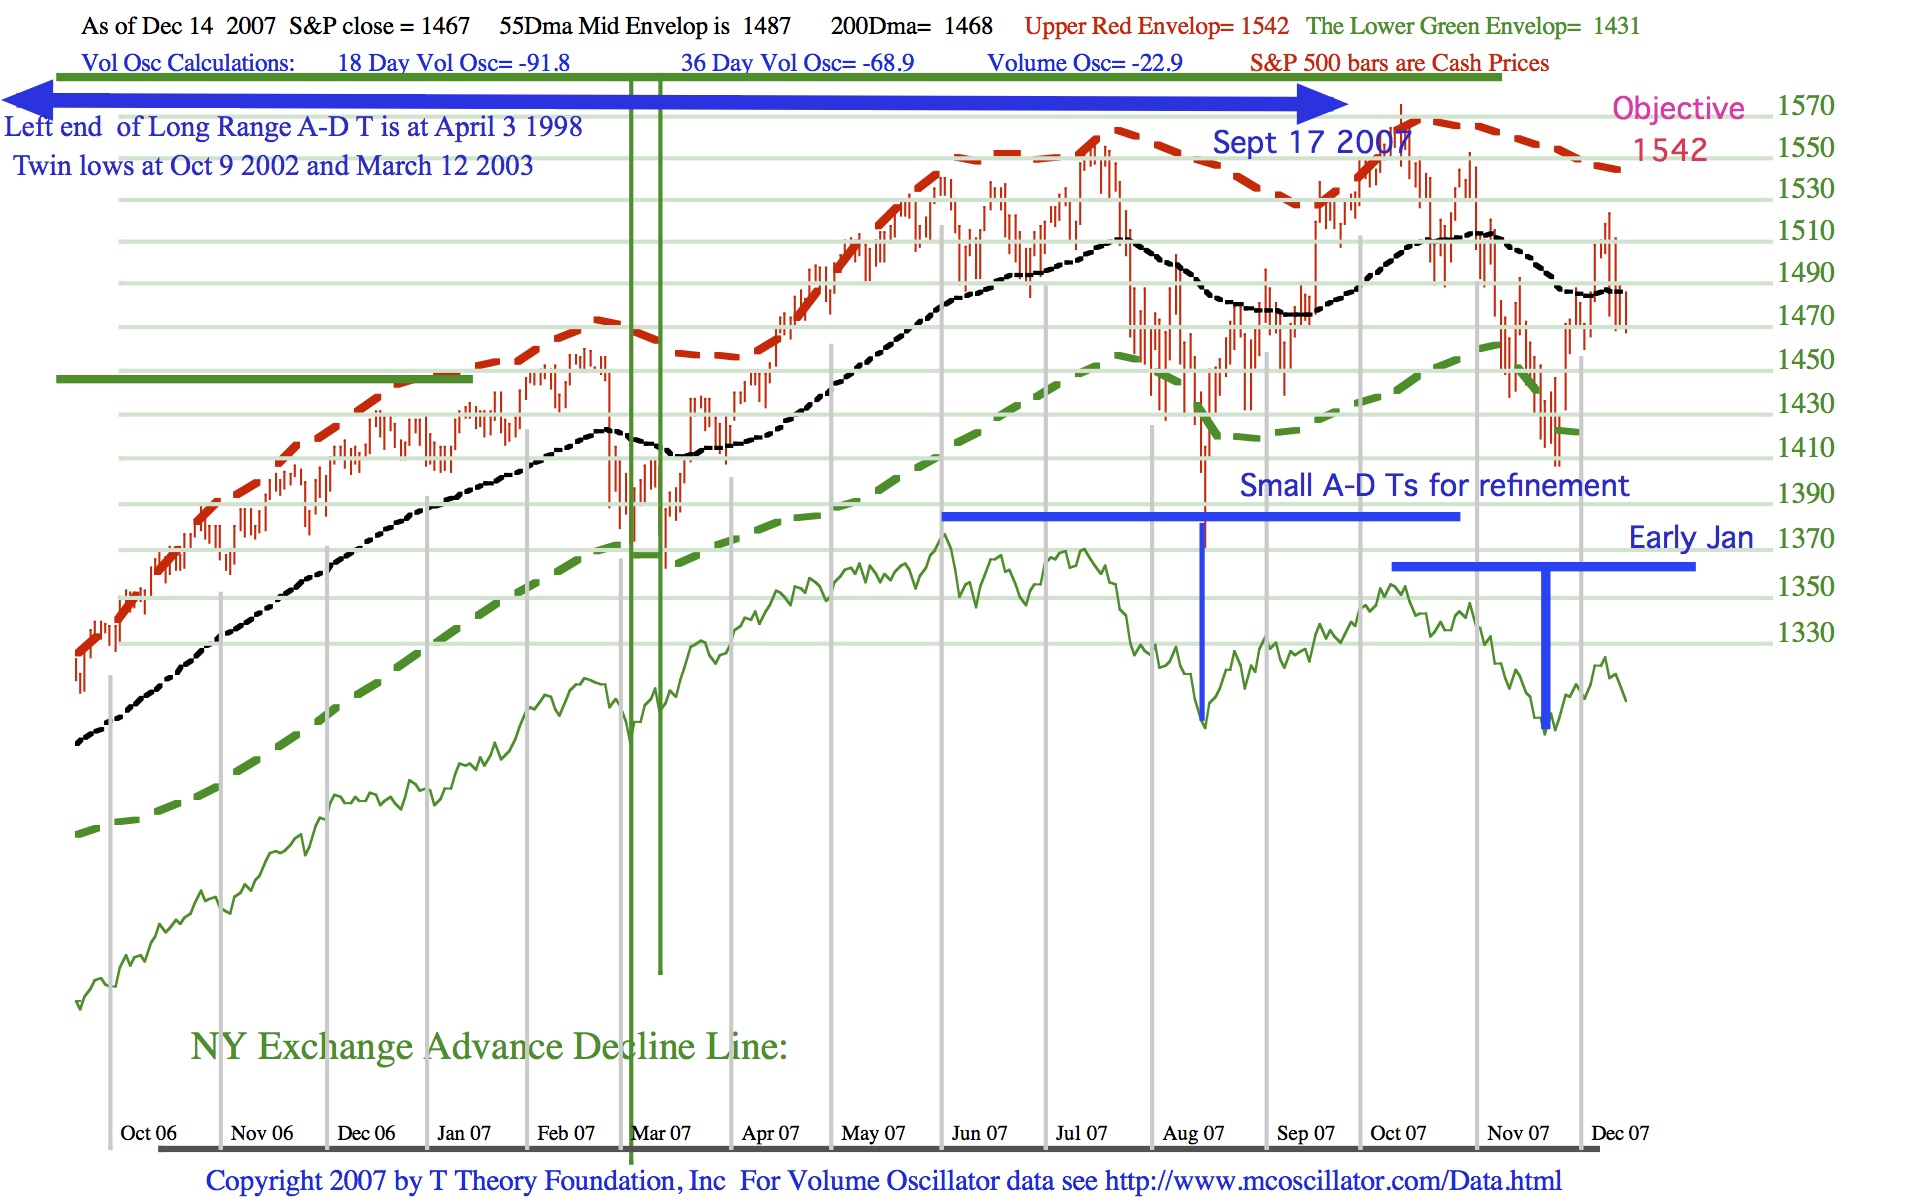
Also included in the chart is the horizontal blue line with arrows at each end representing the much longer range Advance-Decline T coming out of the late 2002/early 2003 double bottom and its precise theoretical daily projection of a September 17 2007 long term peak. The October peak, just above 1570, is the actual level which I would take as the most optimistic benchmark high for this completed T and therefore a probable historic peak for this bull market. It could be retested on any new rebound from a late February or March low but otherwise I will stand by it as a T Theory long term projected peak reference level for the S&P.
If you wish to read my long winded version of this T, go to the long term discussions link at the left and read the 2005 A-D T General Discussion. Otherwise I will summarize the current picture in next weeks discussion and during the 2008 observations will lay the ground work next year’s long range bearish T Theory forecast. Three years ago I assembled the continuous Advance-Decline history from 1926 and convinced myself that their were no serious errors in its contention that when the market averages rallied a time equal to the prior decline in the A-D line, the the bull market in effect was “dead on arrival”.
This will be our first new project during the new year. In the meantime we will watch the smaller A-D T’s projection of one more surge into year end.
T Theory Update for December 6 2007
Contrary to my expectations, the S&P 500 broke well above the 55 day MA resistance level thereby confirming the Short T sketched into the new Chart below.
Click on the link to download the December 6th daily PDF chart.
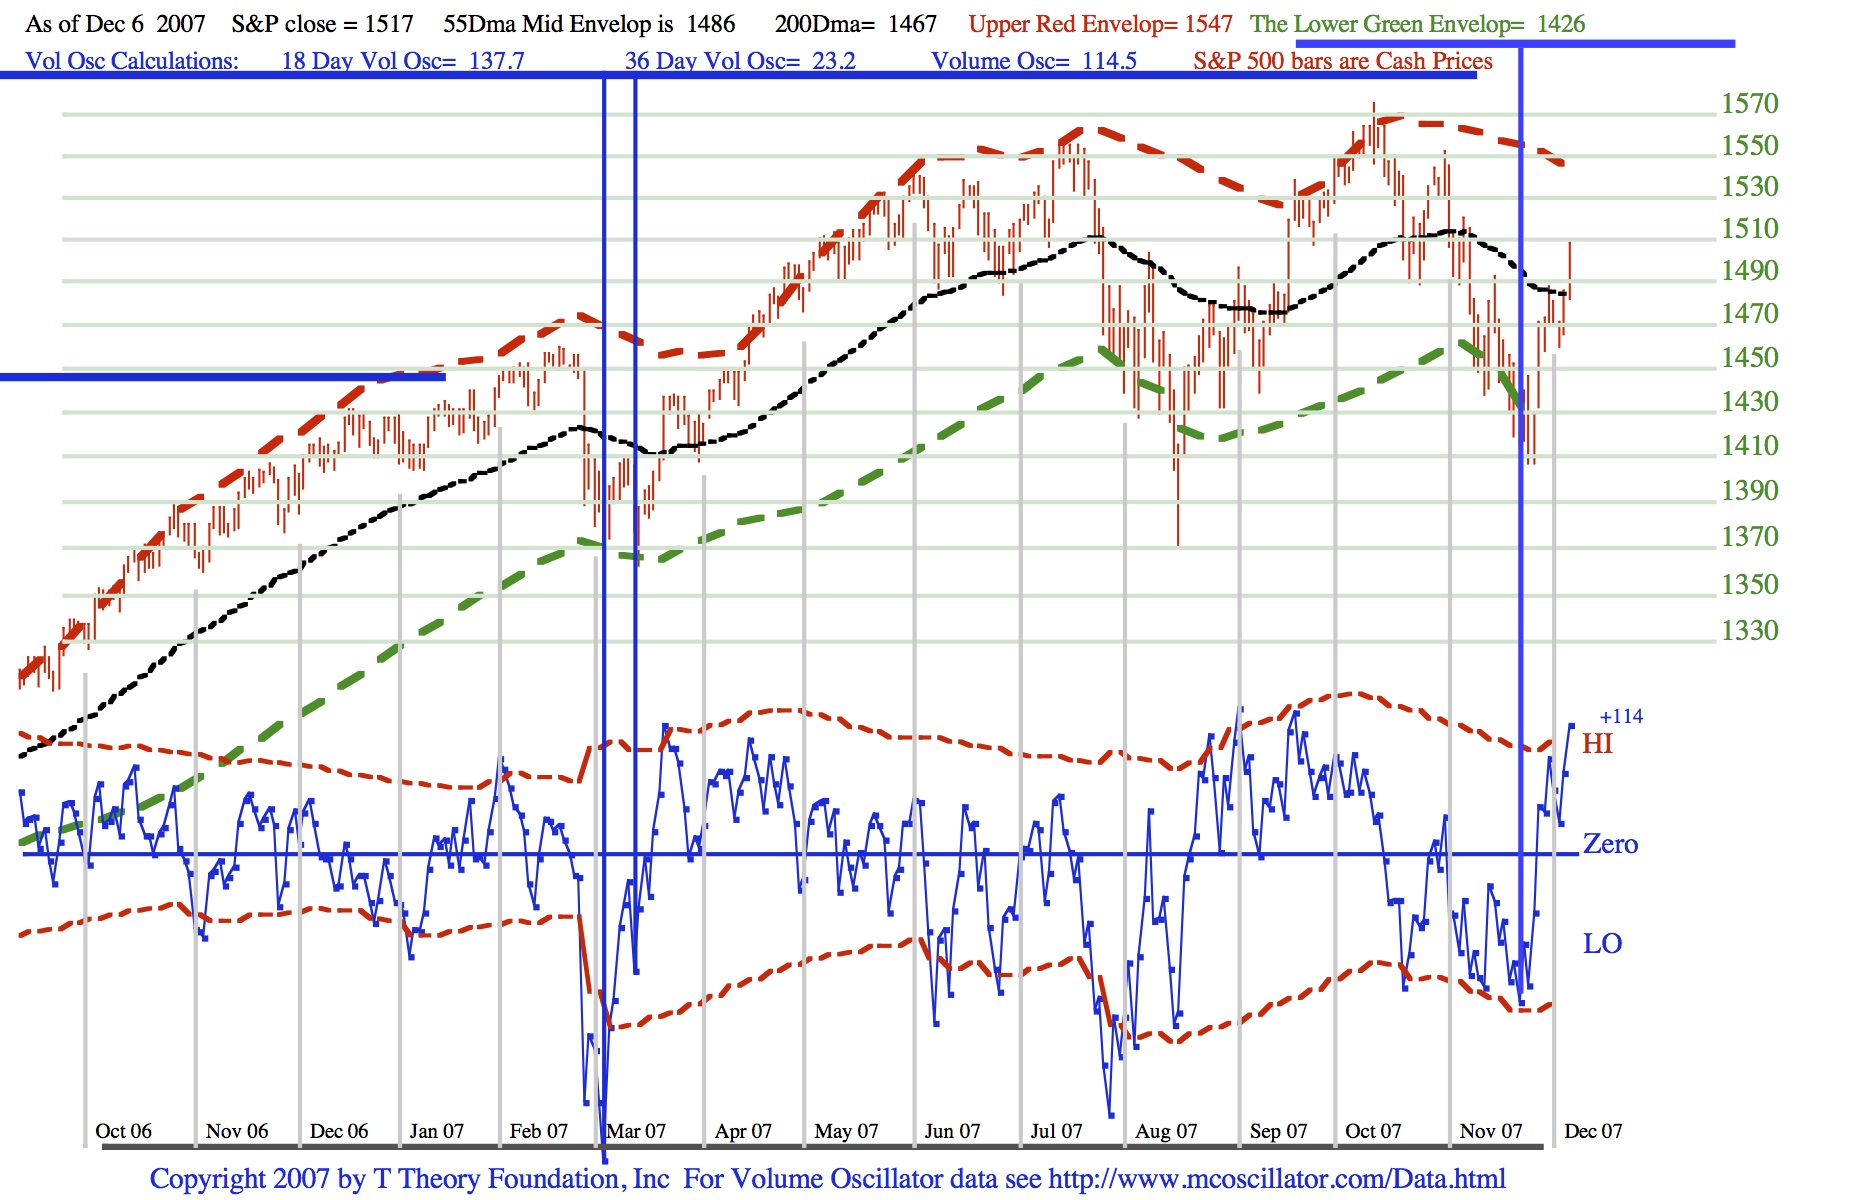
As long as any set back holds at the black 55 Day MA, the trend should remain up throughout most of the right side of the T. The upside price objective is the red dash line which marks the normal upper envelope which typically contains advances. Note this rally will be quite short in duration.
T Theory Update for December 3 2007
The S&P has made its expected bounce up to the 55 Day MA of the S&P as noted in this weeks chart. Click on the link to download the most recent daily PDF chart.
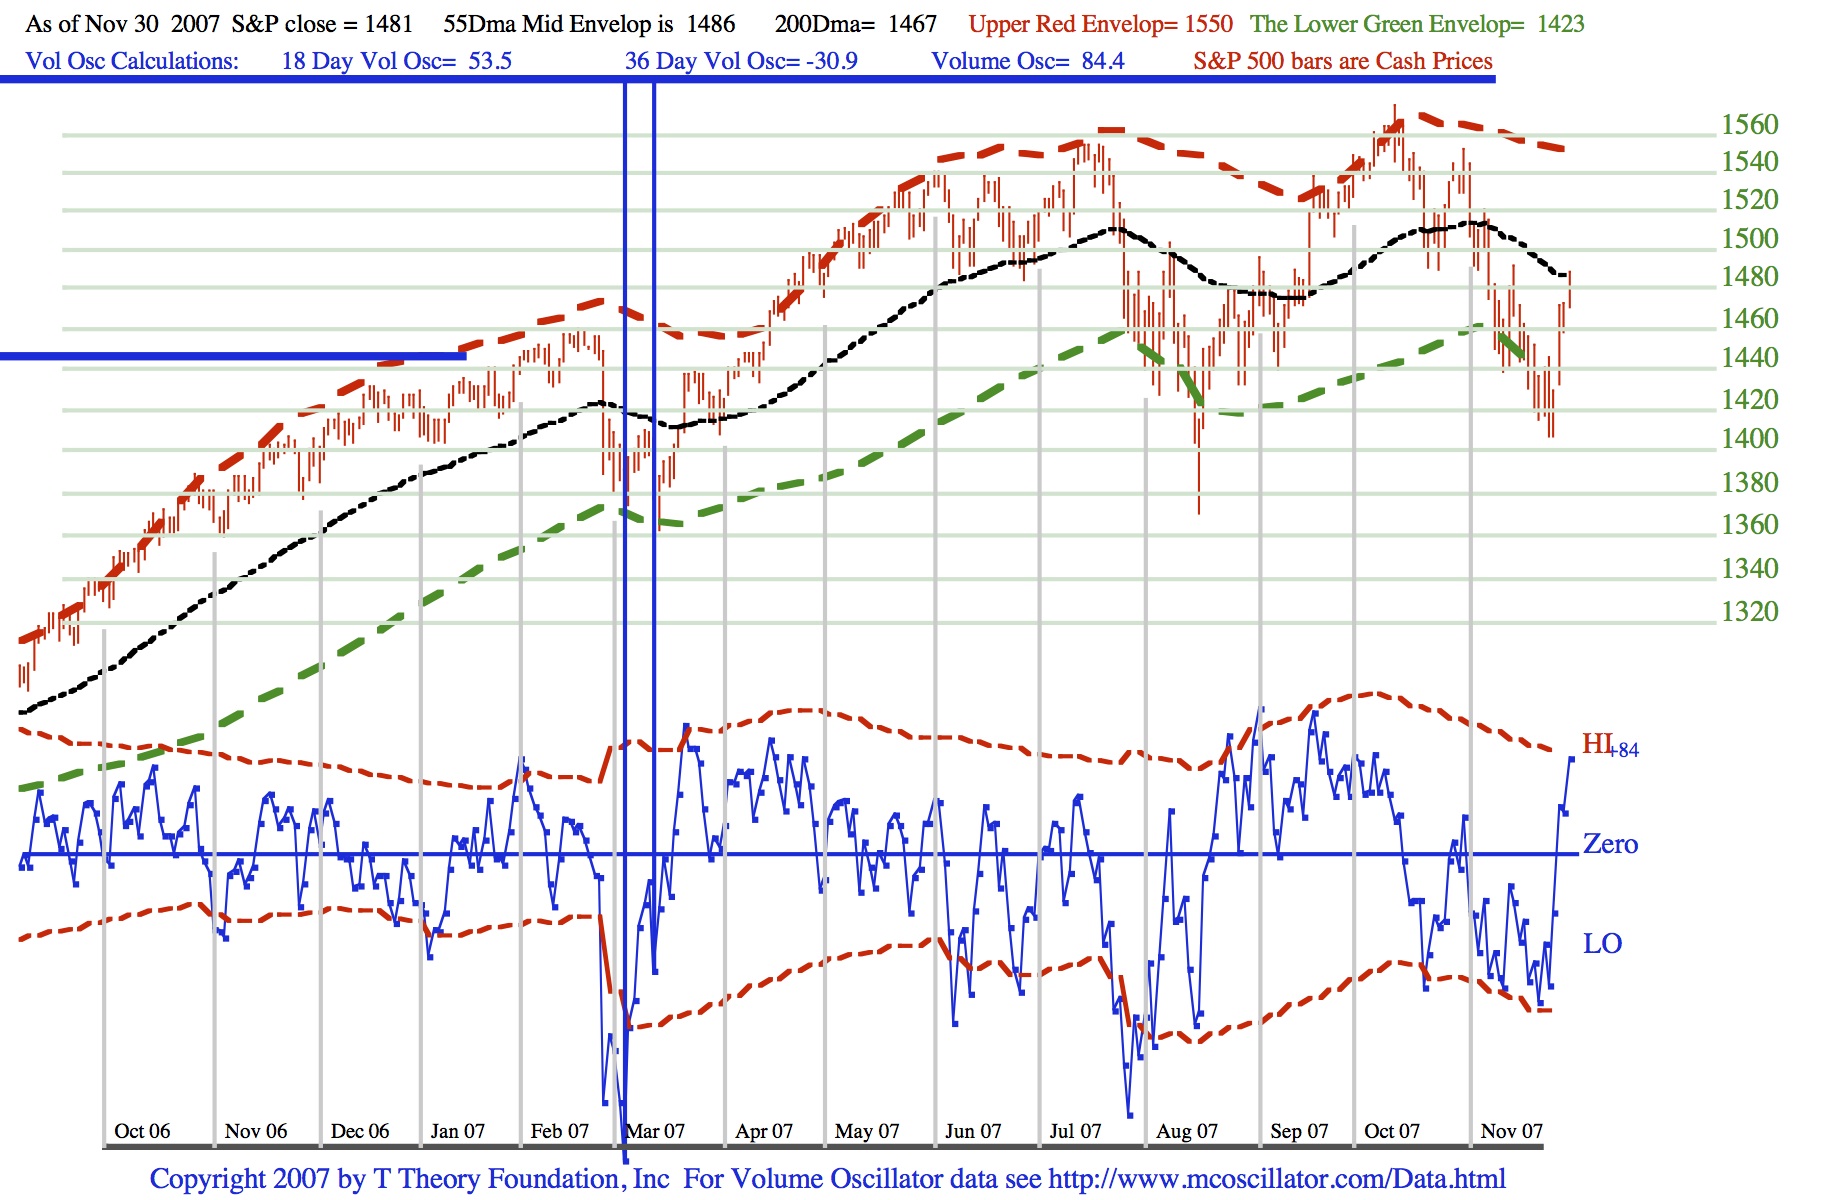
I do not expect the recent bounce to develop into a sustained move to the upper red channel (via any new Short Range T) because there is as yet no recognizable rising bottom in the blue volume oscillator nor any sign of a selling climax to have washed out potential sellers. I will comment of these factors later in December as I continue my weekly Monday morning updates.
In the meantime any sign of near term topping around the 55 day Ma implies a return to the recent lows with a final washout that could set the stage for a stronger recovery into the new year.
****************************************************************************************
All Rights Reserved By The T Theory® Foundation ©
Order the T Theory® Encyclopedia
For a complete understanding of the T Theory® and how to successfully use Terry’s unique methods, order the Encyclopedia from Paula at the above link. There is additional material in the encyclopedia not covered here. Paula will be more than happy to answer your questions too.
Many thanks to Paula Burke for her permission to re-post Terry’s old T Theory® explanations. The period re-blogged on these pages are some of Terry Laundry’s best work and was published here from public domain.
****************************************************************************************
I claim no credit for the material found under T Theory® on this blog. All of this material is the creation of Terry Laundry and was downloaded from Terry’s free blog site (TypePad). I have created a mirror of Terry’s original material and now there is a second site containing Terry’s T Theory®. One or both of these websites hopefully will survive through time as Terry’s material is too important to be lost to the ravages of time. This site is simply a memorial to his lifetime work.
The page content re-blogged here is exactly as Terry created on his original webpages (saved on my computer with ScrapBook)). Nothing has been left out from the period Dec 2003 to June 2011. From Terry’s site, I made a lot of formatting changes, creating a more easily readable webpage appearance. The PDF chart duplicates of the JPEGs have been omitted for ease and speed of recreating Terry’s pages. References to PDF charts should be ignored (but no chart was left out).
After June 2011, Terry created a paid subscription website. None of that material is found here.
There were many many, many hours spent on this project; downloading Terry’s individual charts & audio files, followed by the uploading of Terry’s charts and audio to my WordPress blog library, after which I had to insert the uploaded material into my new T Theory® webpages (hopefully in the correct places). This was a dull and arduous project and I hope you enjoy it. I don’t believe there remains any more of Terry’s material in free domain, so my T Theory® project is probably finished. If I’ve missed something, you can leave me a comment.
If you find an uploaded reference error (chart or audio in the wrong place), please note the month and year of the webpage, plus the exact name of the referenced error file. Include any other info that will help me locate the problem file and where it occurs on the webpage. Leave a comment for me with the info and I’ll fix it.
Terry’s material is very long and will take many weeks for you to finish. Don’t hurry, it’s not a marathon and you will absorb more if you go through it at a reasonable rate. This is especially true for those who don’t invest in the T Theory® reference encyclopedia. The encyclopedia is a written reference for T Theory® and includes everything of importance for Terry’s T Theory®. Without the reference encyclopedia you must depend on your memory and Terry’s method carries some rules that you could easily violate. The encyclopedia also includes new information never seen on his website.
You are welcome to save any or all of my blog material to your computer. You also have my permission to re-blog my information, but you must (1) credit me and my blog in an obvious manner and (2) don’t change my material.
FYI – I find the best way to save a webpage is using “ScrapBook” (it’s an add-on for the FireFox browser). ScrapBook saves a webpage to your computer EXACTLY as it appears on the day you saved it. You can’t tell the difference between the internet webpage and your ScrapBook saved webpage. The saved pages are not pictures. Instead the pages consist of HTML and page functionality remains identical on your computer. There is also a second method for using ScrapBook, where you can save all of the webpages down to a defined link depth. This optional method means all links will function on your computer to the link depth specified (meaning you can click on links on your saved webpages and tunnel down into pages within pages). Saving the normal way will only save the top webpage but the links that exist could continue to function by taking you to the website on the internet instead of on your computer. But sometimes the linked website doesn’t exist anymore. I’ve had this happen on some very good webpages with unique information (they just disappear into the internet void). That’s a bummer when you lost some really good info and thus rose my need for ScrapBook. You can also filter the pages saved using the optional ScrapBook method, which can exclude all pages not coming directly from the specified website (filtering is recommended using this method otherwise you wind up with a LOT of useless stuff).
.
Explore posts in the same categories: . . . T Theory®
Leave A Reply