May 2008 – T Theory® Update

During May I will be providing the usual Monday morning updates in the daily charts. Wednesday of this week I will post the current Daily Advance-Decline line chart with my notes right here.

During May we will be looking for any signs of a market turnaround that can be sustained through 2008 via a new A-D T. This confirmation requires we find a new Short Range T developing in the daily indicators, so the short term picture will still be important. Terry Laundry
T Theory Observations Update for May 26 2008.
Download the current PDF file for the updated daily chart.
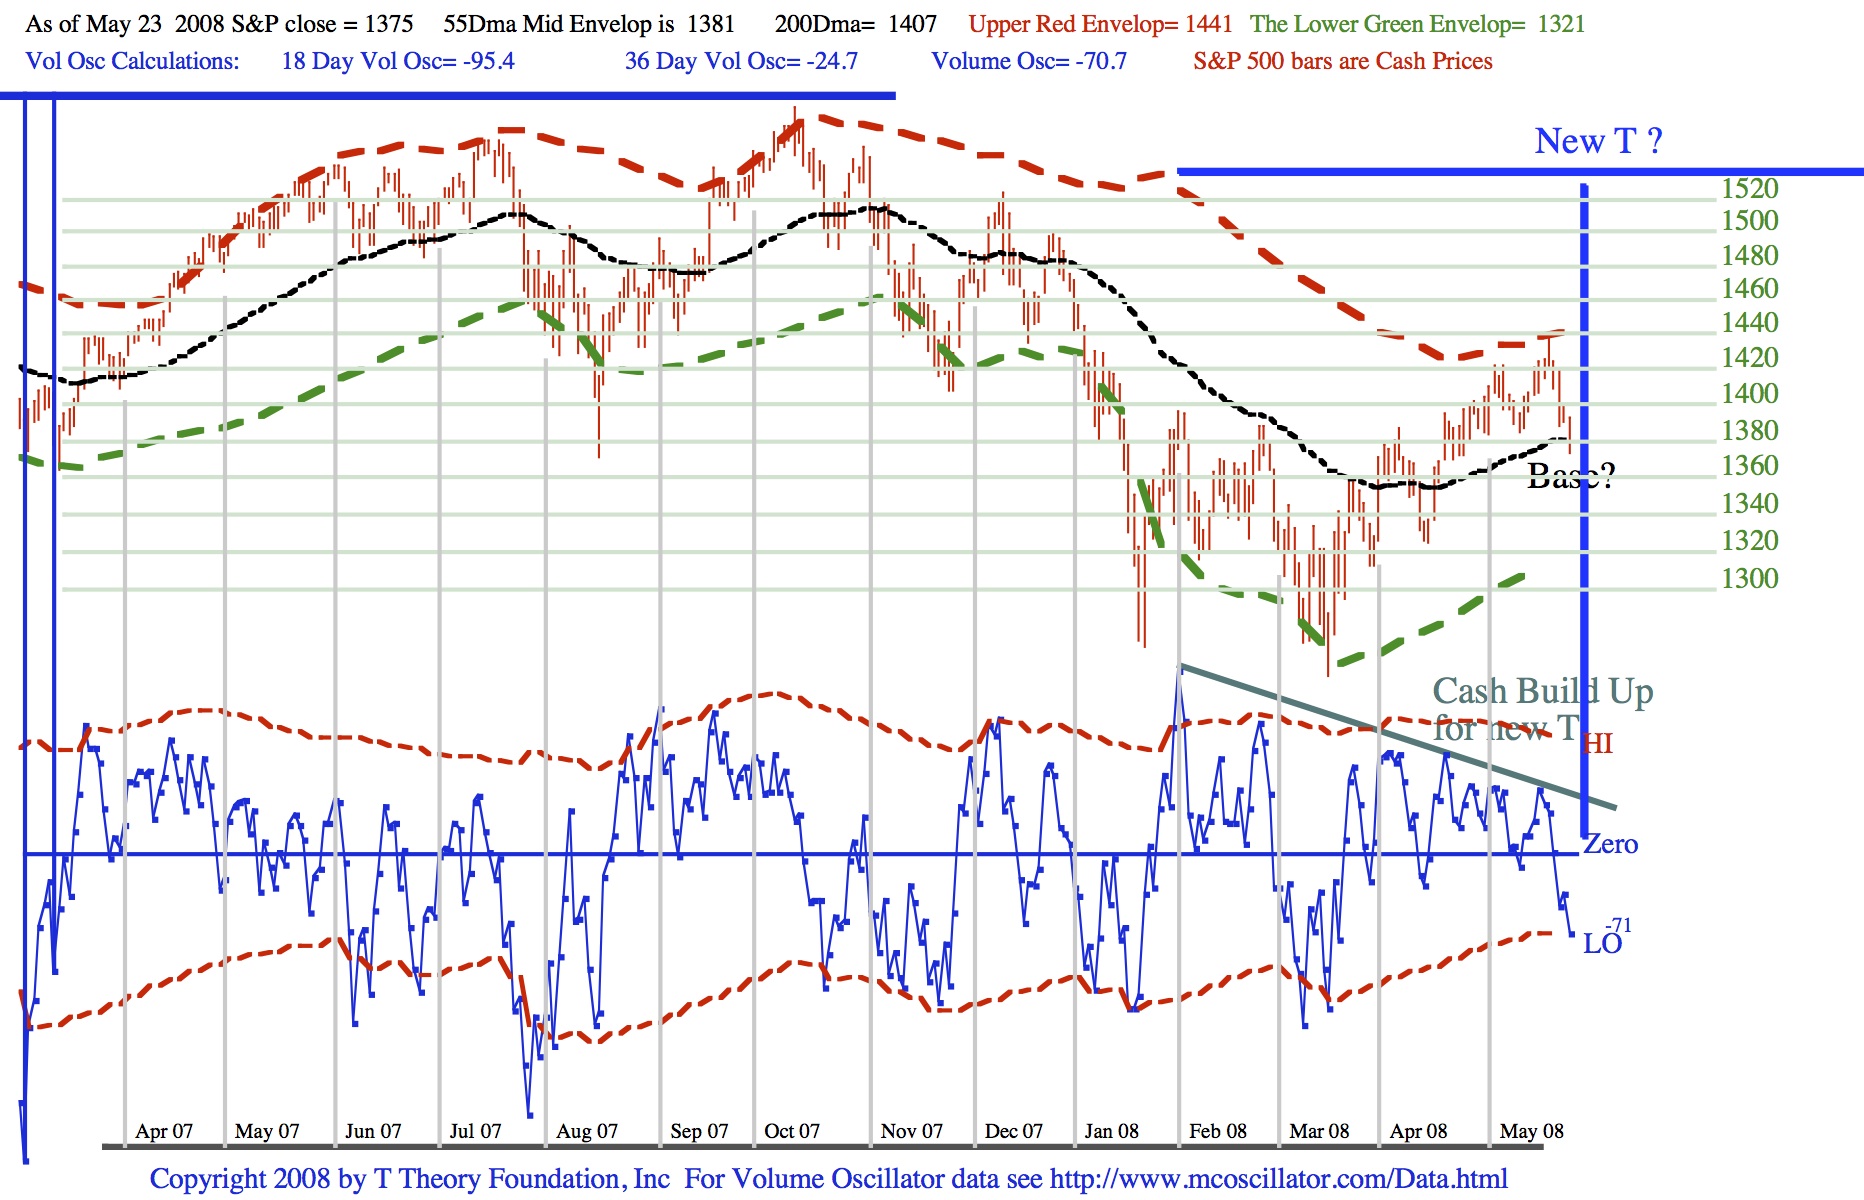
The S&P 500 has declined as expected into what should become the market low at the center post on the potential new T I have sketched in today’s chart. It is too soon to know exact details as further weakness is possible depending on Oil prices, etc.
However, typically a basing activity within an oversold condition takes place around the center post low of any new T, and this usually lasts about 5 trading days. It is easy to see once the basing activity begins, as the blue volume oscillator should make a “W” shaped bottoms pattern within the oversold condition. Once the market bounces up out of the oversold condition and the volume oscillator clearly cuts the green cash build up line the the new T is said to be formed in its final time dimension.
This T will be important for the next 4 months because we already know the cash build up time is at least 4 months and so the rally potential for the S&P is at least 4 months all depending on the turn-around date. What we don’t know is the date of the center post low, although it it can be discovered by careful observation of the data. More importantly we don’t know, and can never really know the quality of the 4 month matching market rally that the T’s time symmetrical nature promises us. In time we will get valuable clues but for now we need to turn to the potential for a new Advance-Decline T for additional clues.
Directly above I publish the chart of the NY A-D Line in early May showing a peak at the end of May 2007 and decline down to a mid-March 2008 low, a period of some 9.5 months. For any A-D T, the market rally in the right side of its particular T must last as long as the A-D had declined, so any new A-D T from the mid March 2008 low, the overall advance has to last a total of 9.5 months implying an eventual peak in early January 2009. I believe this is probable but not yet confirmed.
A good question that might well be asked is how one can be certain that a new A-D T will make the full course of its projected market rally. Their reliability historically can be seen in the chart posted for June’s upcoming discussions. Here we see the NY Index vs A-D Line with all the A-D Ts from 1996 to 1998. There are no significant timing errors in this time symmetry, nor are there any going back to 1929, so the basic question remains has, in fact, the new A-D T been generated and how can we verify it.
The first obvious step is to make sure the current correction doesn’t turn into an uncharacteristic messy affair that is not consistent with the projected uptrend into early ’09. This will take about a week or perhaps two of observation.
T Theory Observations Update for May 19 2008.
Download the current PDF file for the updated daily chart.
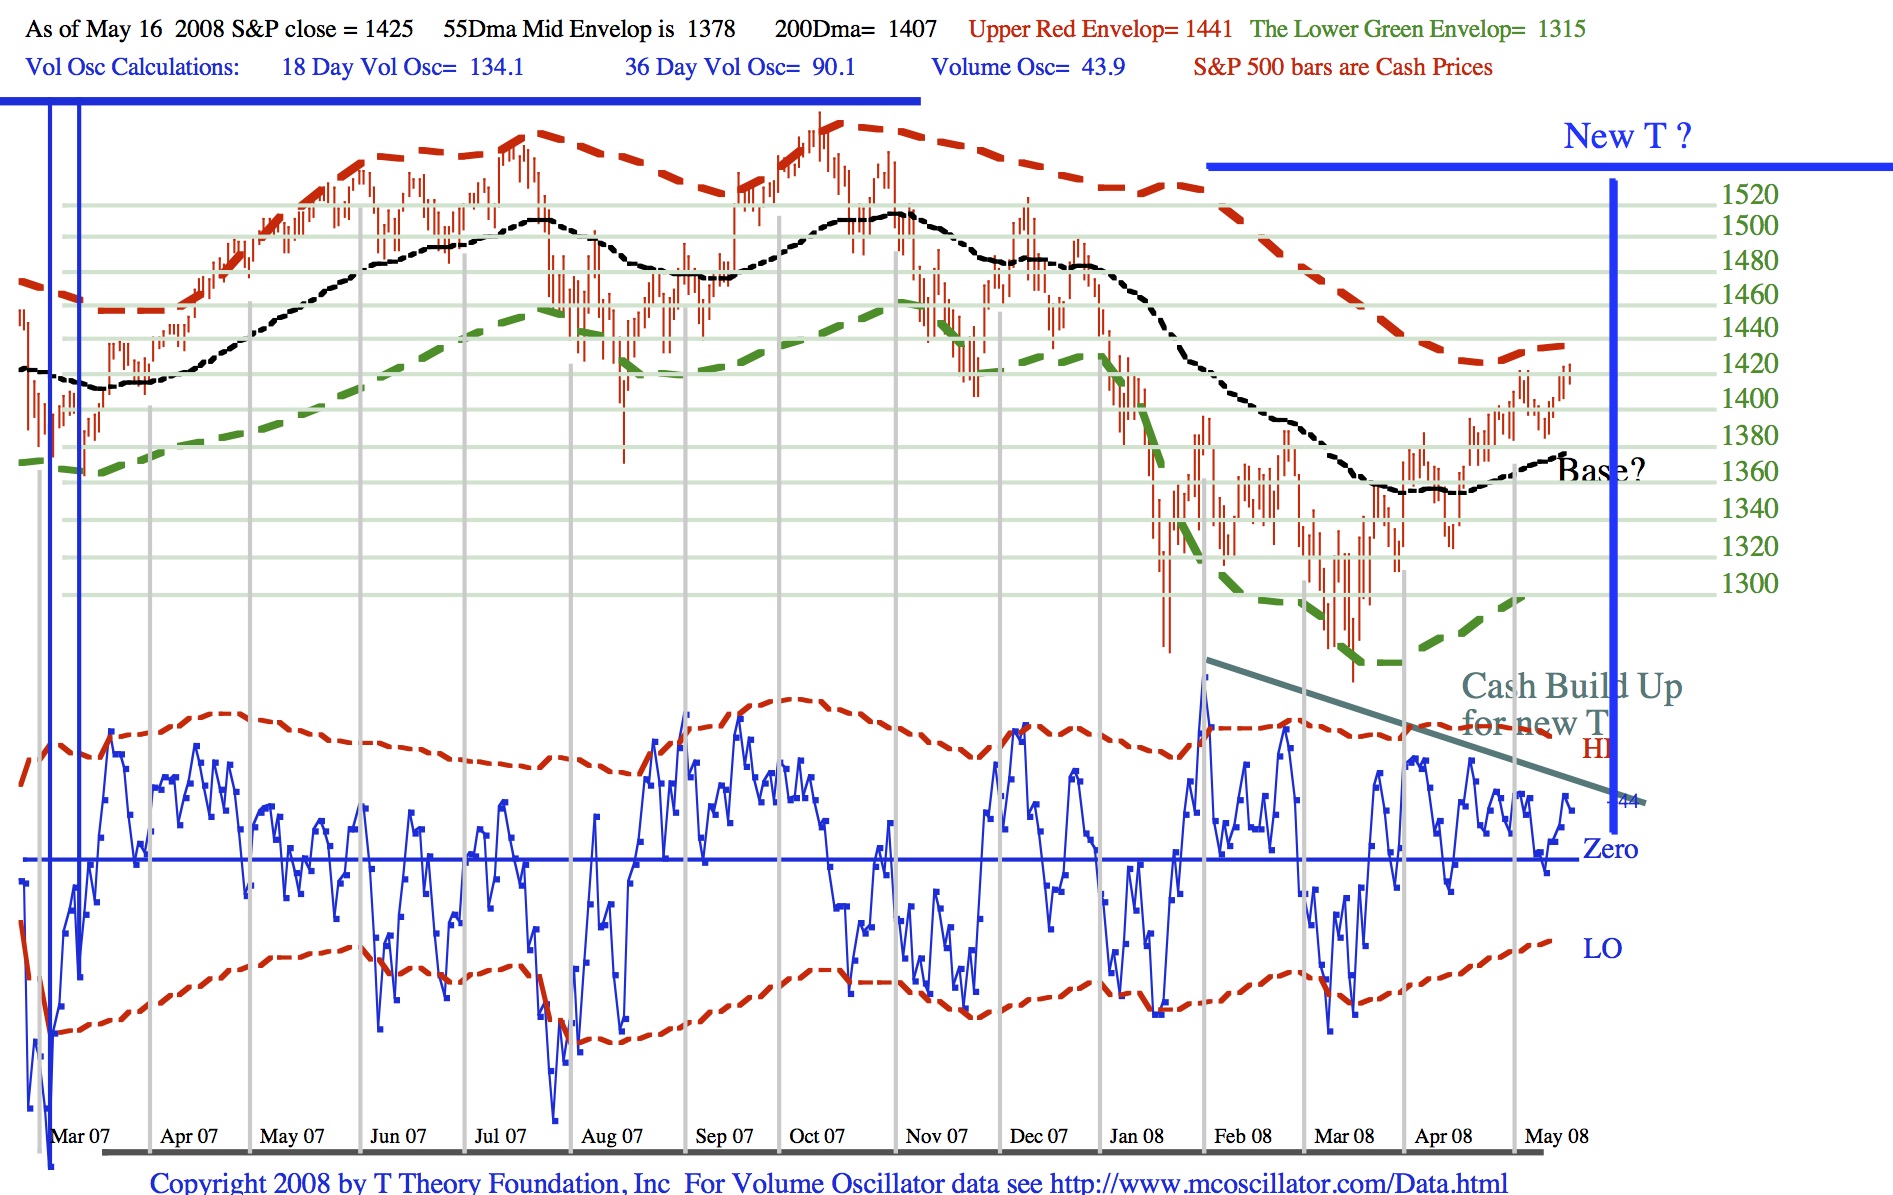
I have tentatively sketched in the new T that is expected “soon” and which will be driven by the almost 4 month Cash Build Up Phase which will define the left side of the Time Symmetrical T.
As per my last week comment, it is not likely for the new T to get started on a new rally in its right side until the S&P falls back to the 55 Day MA, currently 1378 and rising very slowly.
I will wait for the needed pullback, but once seen, a good buying opportunity should present itself.
T Theory Observations Update for May 12 2008.
Download the current PDF file for the updated daily chart.
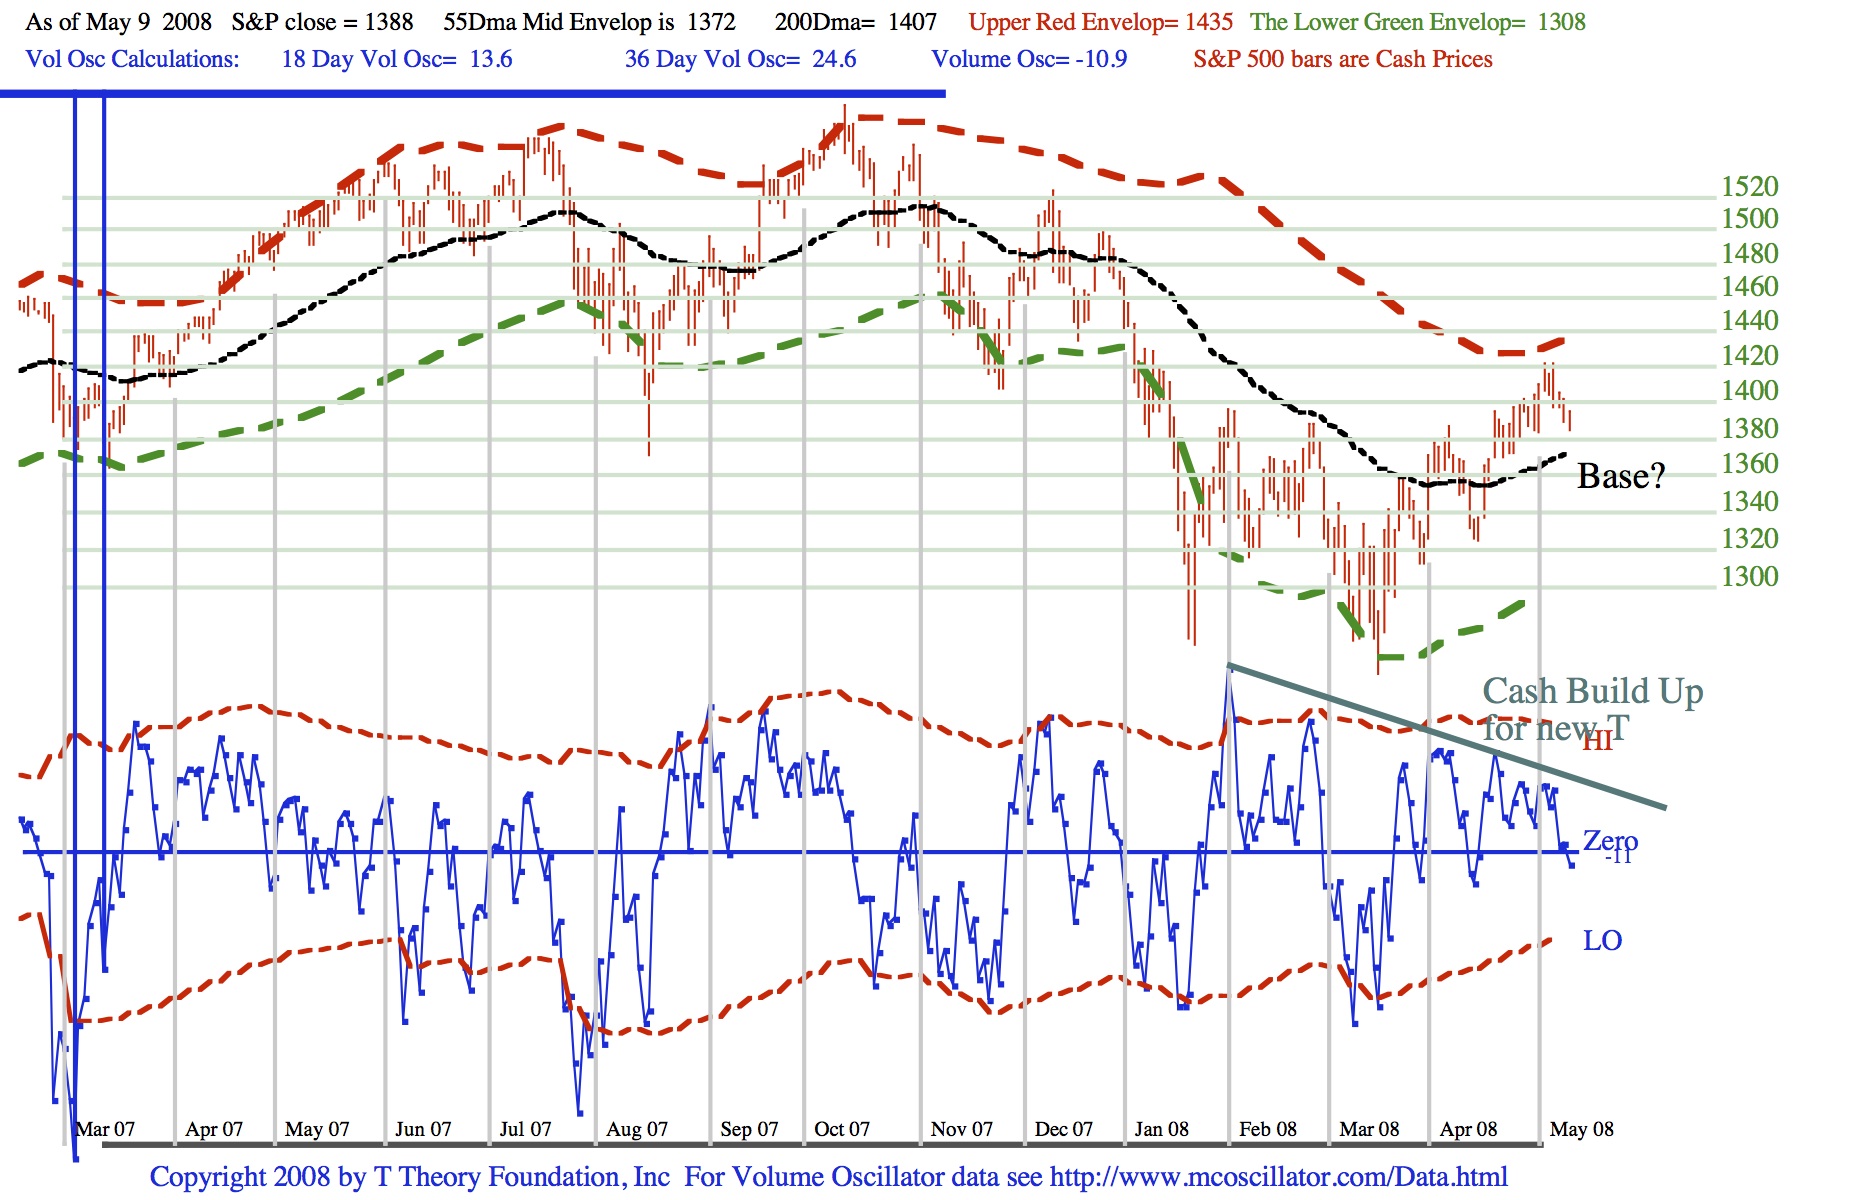
Note the S&P has peaked as expected by the now expired Ts discussed in prior observations and looks to be headed down to the 55 Day MA at mid-Channel, currently list in the chart data as 1372. This level is the minimum correction needed before a new Short Range T can develop. If the correction is halted at mid-Channel and a small base forms at this level then a brand new large T can be generated via the now much longer green cash build up line sketched in the blue oscillator plot.
This bullish outcome is not guaranteed, but if it develops, a new Advance-Decline T will be generated in the plot I posted last week above. It will as a minimum carry the S&P to the old highs. A reason for suspecting this will occur is simply that it is very rare for an initial rally to find the blue volume oscillator already primed for a full cash build up phase even as the old T has expired. Historically it means the market wants to continue the advance in a quick-to-form new T that only need the minimum intervening correction, which in bullish transition periods, is having the S&P only fall back to mid-Channel, never much lower.
The interpretation of this singular pattern is that much more buying power is available than was suggested by the initial T that arose from the key Accumulation Low. When using Short Range T analysis to decode T Theory forecasts this is an inherent problem. Each New T can see the next step, but it isn’t privy to the potential for the a sequence of steps that might comprise a longer term trend. However historical patterns of how Ts evolve in succession can point to the possibilities, and that is what I am concentrating on at this point.
There is a fine point that it might be wise to concentrate on for next weeks action. First, in a bullish transition from an old expired T to a new T, the S&P has always first dropped back to the the 55 Day MA first, therefore providing a buy point criteria that is easy to spot. A slightly complicating factor is that within this bullish transition the blue volume oscillator doesn’t like to spend much time below the zero line.
A glance at the daily chart shows the S&P has not yet reached the 55 Day MA, therefore any new bounce should not be the beginning of a new T. On the other hand the Oscillator has dropped a bit below the zero line, so some sort of bounce might be expected. Taken together this pattern implies the new T is not quite ready to start until the next upside pop fails, and the S&P falls back to the 55 Day MA.
T Theory Observations Update for May 5 2008
All the daily Ts noted in my last weeks update have expired their life time, so they are no longer relevant to the long term picture. Instead I will turn my attention to the current daily chart and focus on the possibility for a new Short Range T that could, under certain circumstances get the market moving up, after corrections, with sufficient momentum to confirm a potential new Advance-Decline T.
Nothing important is likely near term because the expiring Ts will limit any further upside momentum and reasonable corrections will set in. Once these corrections bring the S&P back to its mid channel 55 day MA, now 1367 as noted in the chart data, then the picture gets more interesting. Download the current PDF file for the updated daily chart.
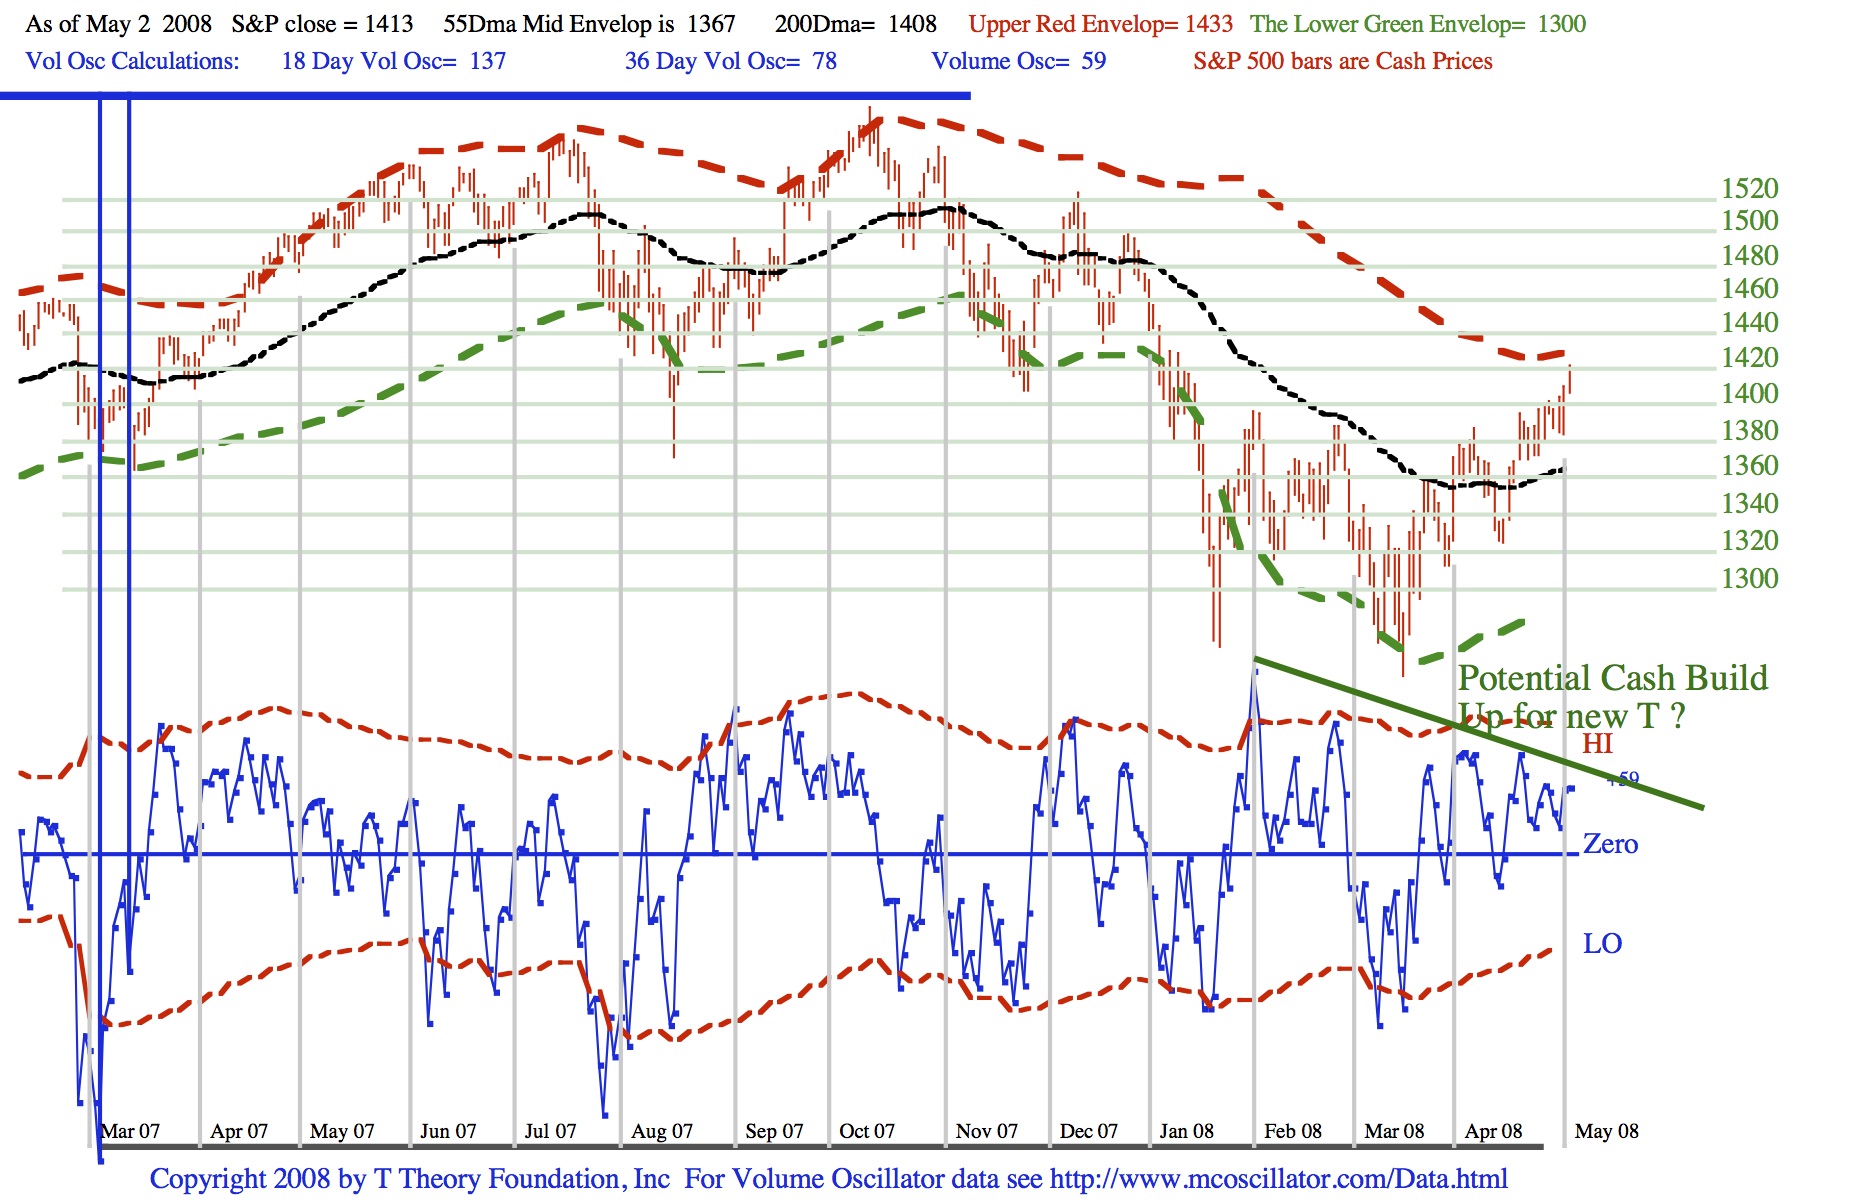
The main point is to have the needed corrections back to mid channel but not all the way down to the green dash oversold envelope. During this process the Cash Build Up period, denoted by the dark green descending oscillator peaks trend line, can develop into the left side of a new T that can advance the S&P via a more significant Advance-Decline T.
If the corrections hold around mid channel then the new T could get underway by the end of the month since the cash build up line is already relatively full sized, but certainly by June. If the S&P breaks well below mid channel (the black line) then no bullish A-D T is likely and the bearish trend will likely resume.
Generally speaking history shows the S&P action around mid channel will clearly indicate the outcome, but for now we need to wait for the correction pattern to settle the issue.
****************************************************************************************
All Rights Reserved By The T Theory® Foundation ©
Order the T Theory® Encyclopedia
For a complete understanding of the T Theory® and how to successfully use Terry’s unique methods, order the Encyclopedia from Paula at the above link. There is additional material in the encyclopedia not covered here. Paula will be more than happy to answer your questions too.
Many thanks to Paula Burke for her permission to re-post Terry’s old T Theory® explanations. The period re-blogged on these pages are some of Terry Laundry’s best work and was published here from public domain.
****************************************************************************************
I claim no credit for the material found under T Theory® on this blog. All of this material is the creation of Terry Laundry and was downloaded from Terry’s free blog site (TypePad). I have created a mirror of Terry’s original material and now there is a second site containing Terry’s T Theory®. One or both of these websites hopefully will survive through time as Terry’s material is too important to be lost to the ravages of time. This site is simply a memorial to his lifetime work.
The page content re-blogged here is exactly as Terry created on his original webpages (saved on my computer with ScrapBook)). Nothing has been left out from the period Dec 2003 to June 2011. From Terry’s site, I made a lot of formatting changes, creating a more easily readable webpage appearance. The PDF chart duplicates of the JPEGs have been omitted for ease and speed of recreating Terry’s pages. References to PDF charts should be ignored (but no chart was left out).
After June 2011, Terry created a paid subscription website. None of that material is found here.
There were many many, many hours spent on this project; downloading Terry’s individual charts & audio files, followed by the uploading of Terry’s charts and audio to my WordPress blog library, after which I had to insert the uploaded material into my new T Theory® webpages (hopefully in the correct places). This was a dull and arduous project and I hope you enjoy it. I don’t believe there remains any more of Terry’s material in free domain, so my T Theory® project is probably finished. If I’ve missed something, you can leave me a comment.
If you find an uploaded reference error (chart or audio in the wrong place), please note the month and year of the webpage, plus the exact name of the referenced error file. Include any other info that will help me locate the problem file and where it occurs on the webpage. Leave a comment for me with the info and I’ll fix it.
Terry’s material is very long and will take many weeks for you to finish. Don’t hurry, it’s not a marathon and you will absorb more if you go through it at a reasonable rate. This is especially true for those who don’t invest in the T Theory® reference encyclopedia. The encyclopedia is a written reference for T Theory® and includes everything of importance for Terry’s T Theory®. Without the reference encyclopedia you must depend on your memory and Terry’s method carries some rules that you could easily violate. The encyclopedia also includes new information never seen on his website.
You are welcome to save any or all of my blog material to your computer. You also have my permission to re-blog my information, but you must (1) credit me and my blog in an obvious manner and (2) don’t change my material.
FYI – I find the best way to save a webpage is using “ScrapBook” (it’s an add-on for the FireFox browser). ScrapBook saves a webpage to your computer EXACTLY as it appears on the day you saved it. You can’t tell the difference between the internet webpage and your ScrapBook saved webpage. The saved pages are not pictures. Instead the pages consist of HTML and page functionality remains identical on your computer. There is also a second method for using ScrapBook, where you can save all of the webpages down to a defined link depth. This optional method means all links will function on your computer to the link depth specified (meaning you can click on links on your saved webpages and tunnel down into pages within pages). Saving the normal way will only save the top webpage but the links that exist could continue to function by taking you to the website on the internet instead of on your computer. But sometimes the linked website doesn’t exist anymore. I’ve had this happen on some very good webpages with unique information (they just disappear into the internet void). That’s a bummer when you lost some really good info and thus rose my need for ScrapBook. You can also filter the pages saved using the optional ScrapBook method, which can exclude all pages not coming directly from the specified website (filtering is recommended using this method otherwise you wind up with a LOT of useless stuff).
.
Explore posts in the same categories: . . . T Theory®
Leave A Reply