June 2008 – T Theory® Update

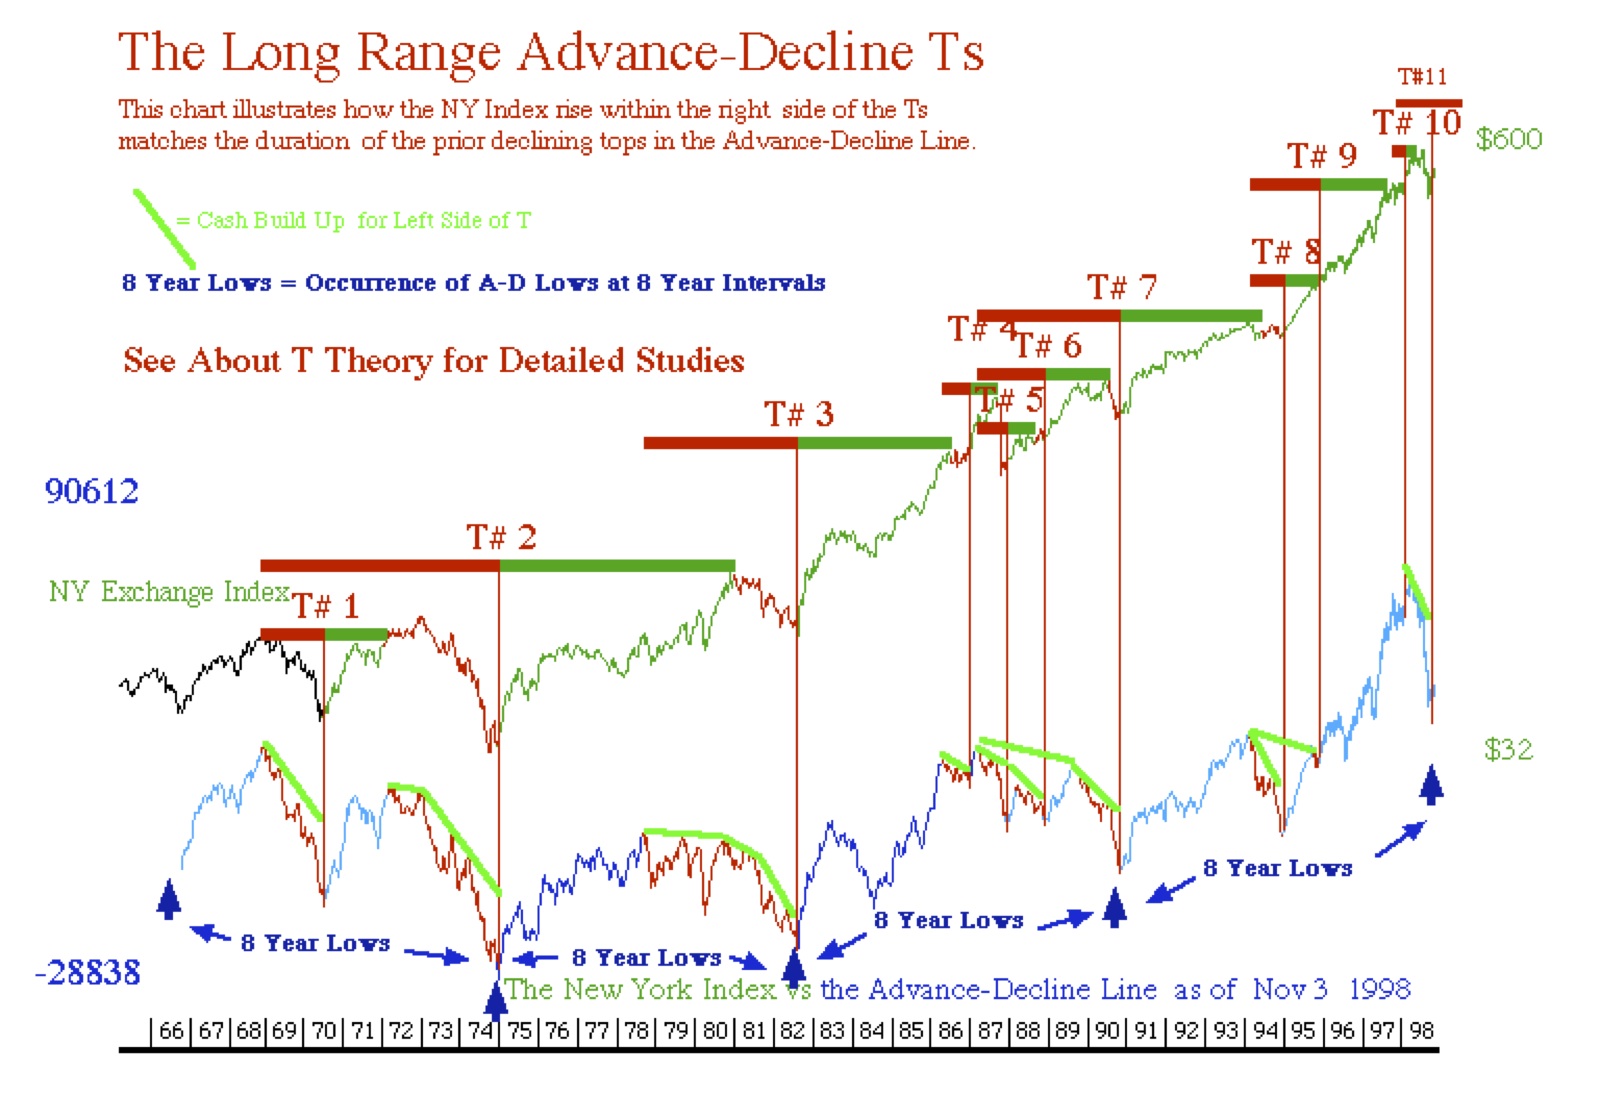
During June I will be providing the usual Monday morning updates in the daily charts. To set the stage for our next task I am now posting my Long Range Advance-Decline T chart. Download the PDF file for this important historic chart and I will incorporate its lessons in the June updates to follow starting on June 2.
T Theory Observations Update for June 30 2008
Download the current PDF file for the updated daily chart.
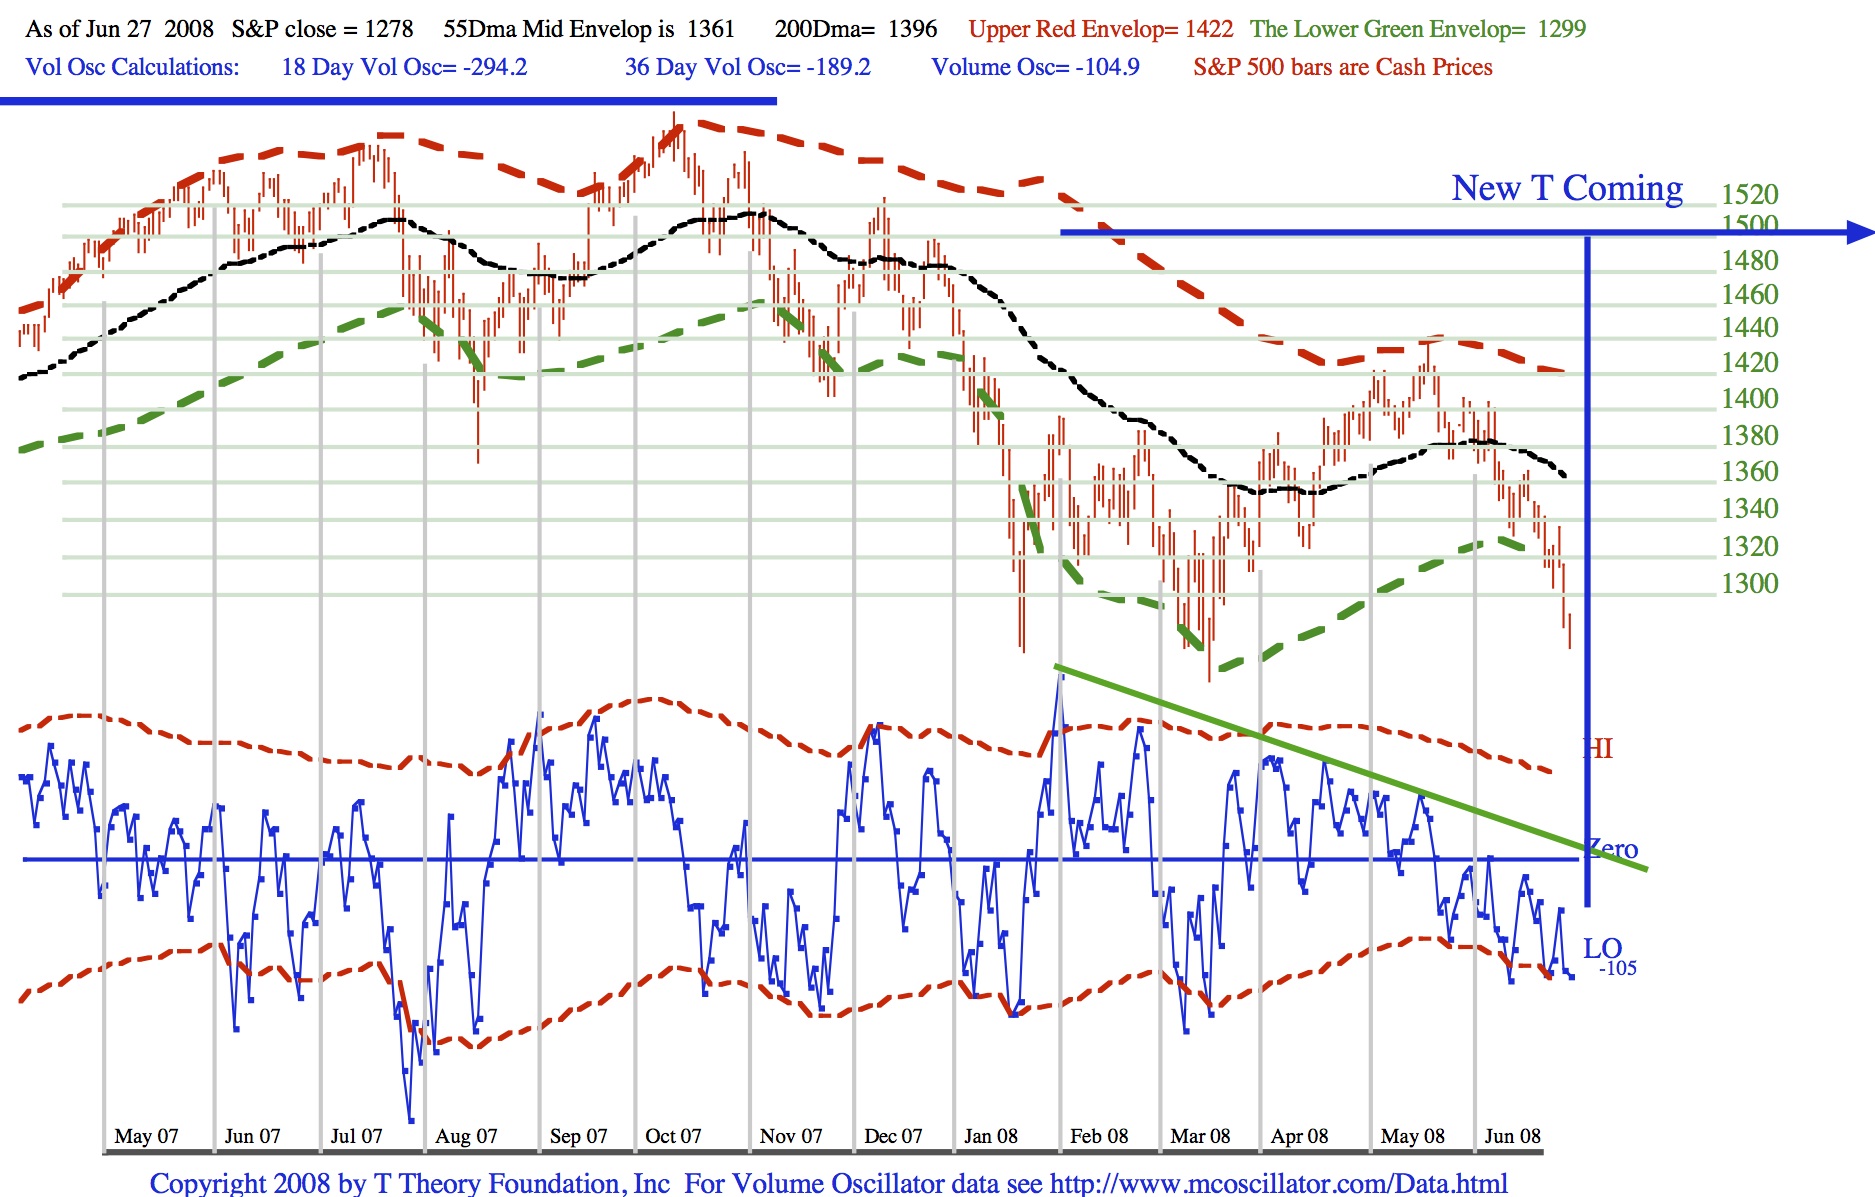
The current chart shows what my daily indicators look like just before the formation of a new T. This new T will have a Cash Build Up ( i.e. the green declining oscillator tops) of about 5 months making it one of the longer time span examples.
Once the oscillator breaks up through the green line, the T’s symmetry will be fixed and the matching 5 months of upside price potential for the S&P will start to become apparent. Then we can start the new T’s analysis for quality of the rally.
There may be another day or two of selling, but it looks to me the upturn could be imminent.
T Theory Observations Update for June 23 2008
Download the current PDF file for the updated daily chart.
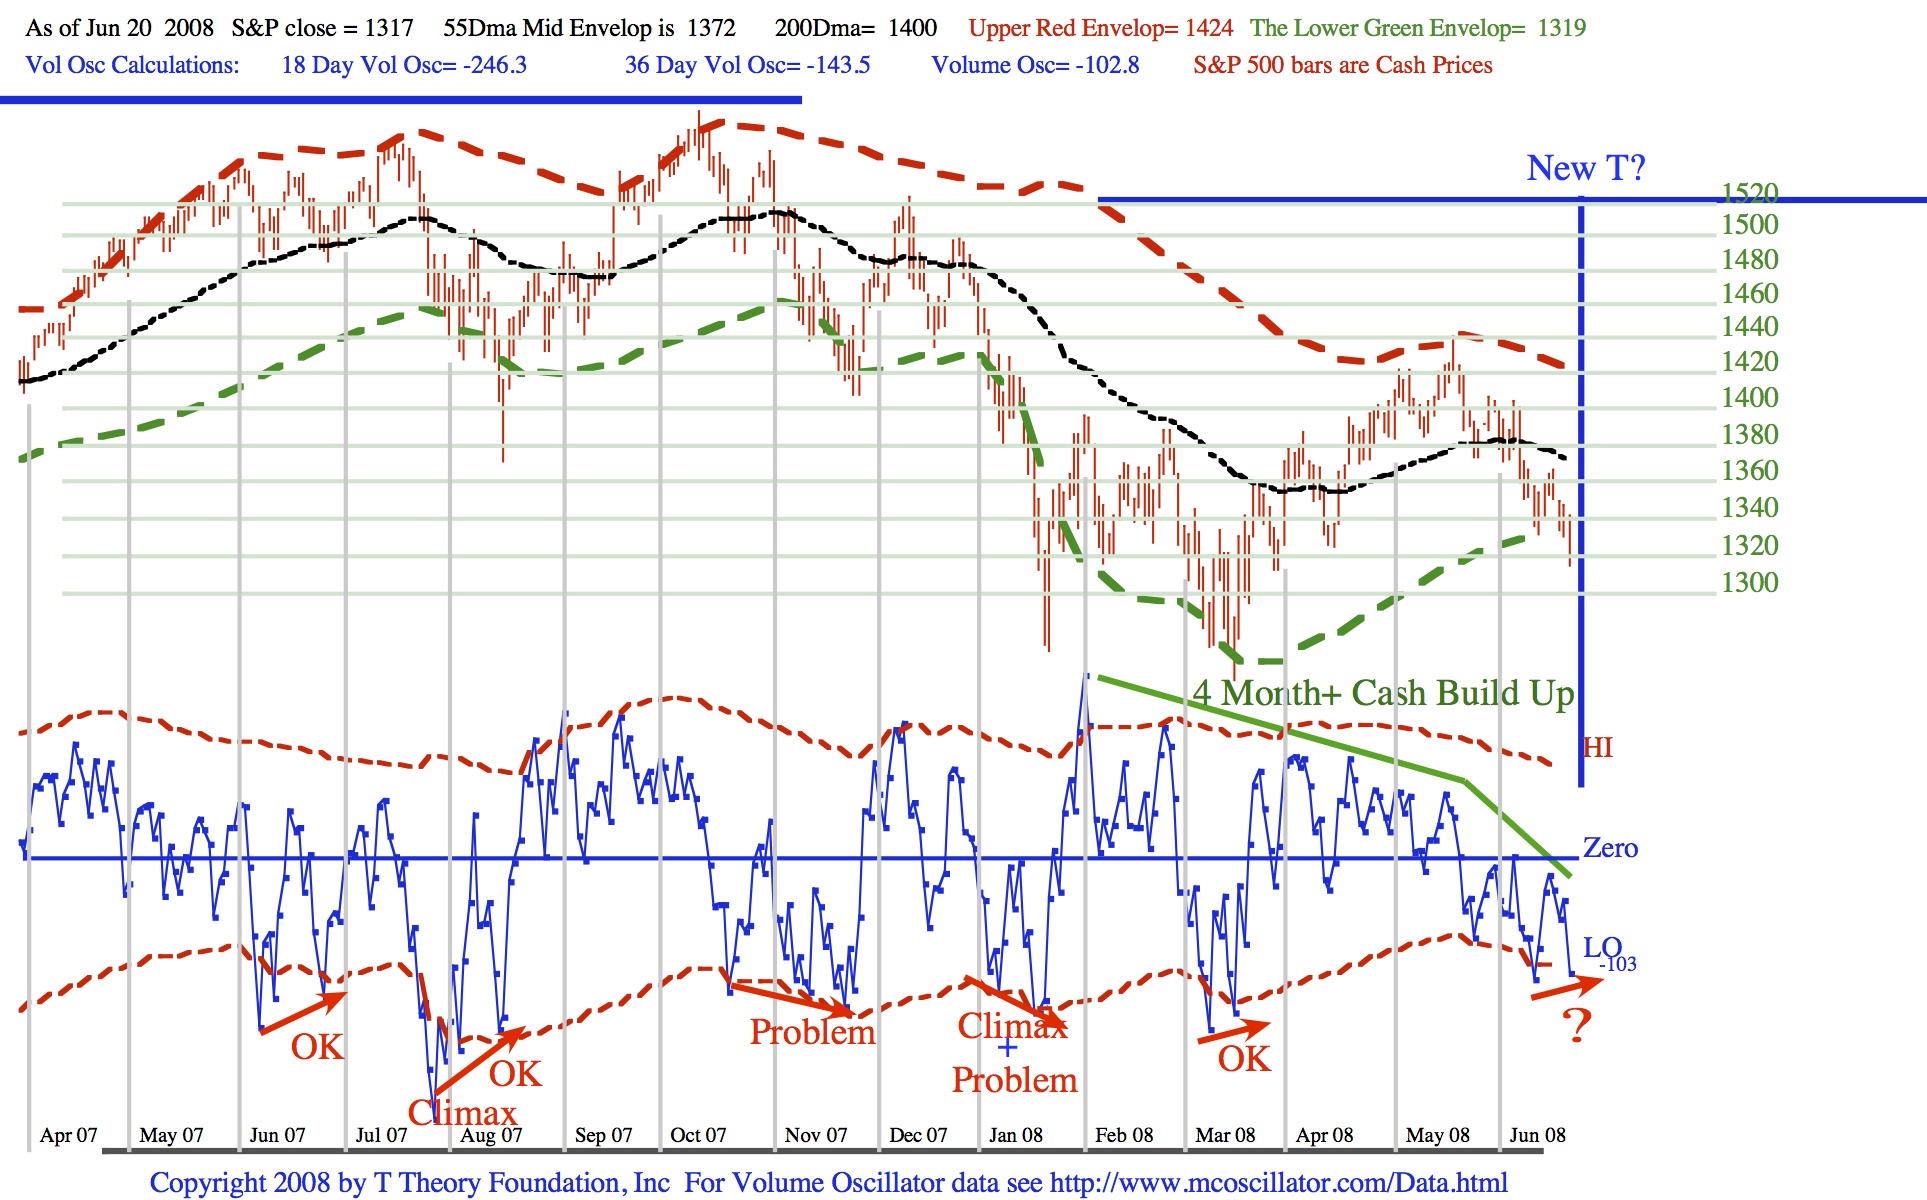
Having broken the 55 day MA about 2 weeks ago, the S&P is at the lower oversold zone of the envelops (the green dashed line) where we should start looking for a new T to begin its rally phase.
Early next week we should see this process develop either as a softer bottom pattern as identified in my chart by the red rising arrow in the lower blue volume oscillator or the alternative selling climax which is characterized by a very steep, deep downside plunge over a few days in the upper red S&P 500 bar chart.
Note I have label the oversold area of the volume oscillator for the 6 key lows in this period. In June ’07, a rising bottom marked OK suggested a rally from the 55 day MA at mid channel to the dashed red overbought S&P might occur. Because the percent rise for half the channel envelopes is typically a bit over 3%, such opportunities are restricted to a modest level.
The mid August ’07 Low has much higher potential partly because it moves from the green Dashed line and extends to the top red line typically a move of a bit over 6%. But its total potential actually approached 9% because the mid August Selling Climax pressed the S&P almost 3% below the normal dashed green envelope giving the whole move an extra boost. So selling Climaxes can boost trading gains by about 3% over normal channel expectations.
To help analyze these bottoms in terms of potential in real time one only needs to make four “over simplifications”. All rallies rallies from an oversold condition tend to be either 3%,6% or 9%, and a rising bottoms oscillator pattern is a big plus from any oversold condition. The explanation require studies of channels and accumulation vs selling climax bottoms. This requires some study, so I will amplify these concepts as we move forward.
The difficulty in understanding how any particular oversold condition might evolve is that the outcome of these 4 separate possibilities produces a variety of random outcomes, some of which are very high risk, some of moderate risk and good potential and a few of low risk with very high potential.
The key is to start by looking for rising bottoms in the volume oscillator in any oversold condition as a starting point because it is eventually necessary, and usually takes about 5-7 days to confirm a low, which gives plenty of time to watch the bottom pattern unfold. The steeper Selling Climax is less forgiving, as it acts with lightning speed.
So for the coming week the analysis is simply to note a small rising bottoms oscillator pattern identified in the chart with the “?”, which if continued could be a promising turn, but would give us plenty of time to evaluate this slow developing pattern. Because the Cash Build Up Phase for a New T is almost 5 months long, a 6%+ gain could be worthwhile for this outcome.
The alternative is a Selling Climax, if the Cash Build Up buying power is controlled by skittish investors who would not want buy unless the S&P falls back further to the March lows. If this occurs the trading potential is still good. A selling Climax that brings the S&P some 6% below the 55 Day MA is also worthwhile because a recovery from a selling climax typically carries up to the neutral 55 Day MA.
Time is running out for this post so I will continue this line of thought next week.
In the meantime the timing is simple. If a soft bottom is to occur, the oscillator rising bottoms pattern we now see as of Friday’s close must hold for some 5 to 7 trading days to be successful. This pattern is easily recognized because Friday’s steep selloff would need to be halted for the whole week ahead.
The alternative is a selling climax back towards the March Low. This could also be a good buying opportunity. But the key is that as long as the volume oscillator can make rising bottoms the Selling Climax is not the normal outcome. If the rising oscillator bottoms fails, then the Selling Climax is the normal outcome.
T Theory Observations Update for June 16 2008
Download the current PDF file for the updated daily chart.

Last week the S&P failed to hold its 55 day MA and the result was a decline to the lower dashed green envelope of my adaptive channels. The next significant event should be the development of a “New T” as sketched in the chart sometime over the next few days.
Usually the beginning to a new T is preceded by a “W” pattern in the oscillator which marks the end of the long Cash Build Up period which in turn defines the left time span of the T. This turning pattern should begin to unfold this week but at this writing all that can be said is that a continuation of Monday’s recovery which carries the blue volume oscillator above the zero line would start the process.
As usual, the safer buying opportunity usually comes when the oscillator makes a partial retracement then moves higher completing the normal “W” pattern. The minimum upside in terms of the S&P 500 is the 55 Day MA given in the chart; the longer term upside via the new T’s time projection of a 4 month S&P advance which is always up to the red dashed line, wherever it goes in the months ahead.
T Theory Observations Update for June 9 2008
Download the current PDF file for the updated daily chart.
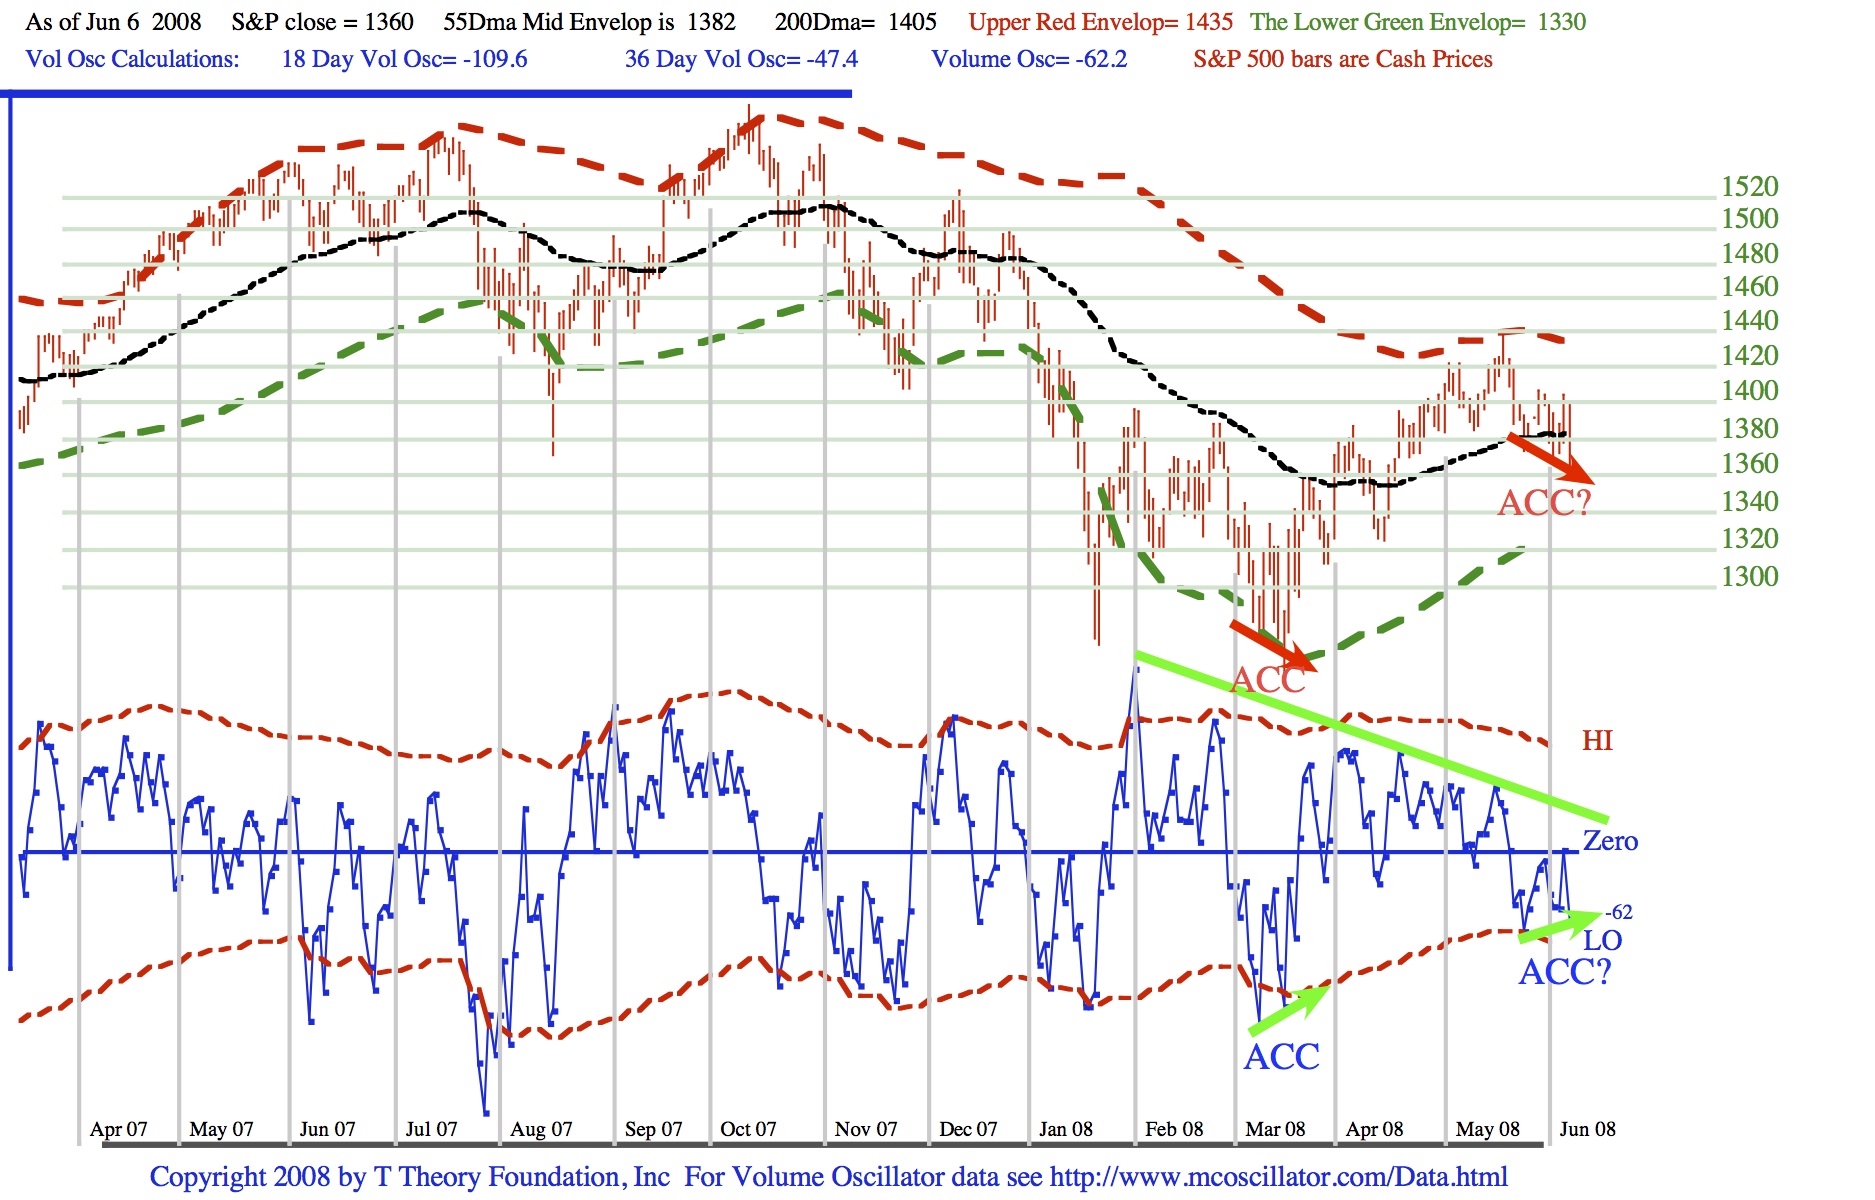
As of Friday’s close, the sharp 400 Dow point selloff was breaking the market below its key support at the 55 Day MA. However as of that close, the blue volume was still holding a rising bottoms. As noted in the chart, this divergent behavior, that is, stock prices weak as suggested by a down red arrow, the volume momentum stronger as suggested here by the upward green arrow, is the underlying basis for my discovery of the Accumulation Low pattern back in the 1980’s as the best identifier of key turning points.
This principle requires a selling climax that breaks into new lows just briefly in order to trigger all sell stops thereby cleaning out all potential sells that could later on sabotage a strong recovery. Note the last successful accumulation occurred at the mid March low. At that point the market was in somewhat of a desperate situation and in fact the more desperate the situation the better chance for an accumulation low to develop, if the trend is about to turn up.
The current situation has all the necessary ingredients for a new accumulation low however the market can not be down much on Monday’s close or the rising bottoms volume oscillator will disappear and the S&P will fall to the lower envelope, an additional 3% loss from Fridays’ Close.
On the other hand a successful turn up will confirm a major low, start a new Short Range T as well as confirm the Advance-Decline Ts projection of a late 2008 eventual major top. The outcome will be easily recognized if you understand what is required to complete the pattern. I am optimistic going into Monday.
T Theory Observations Update for June 2 2008.
Download the current PDF file for the updated daily chart.
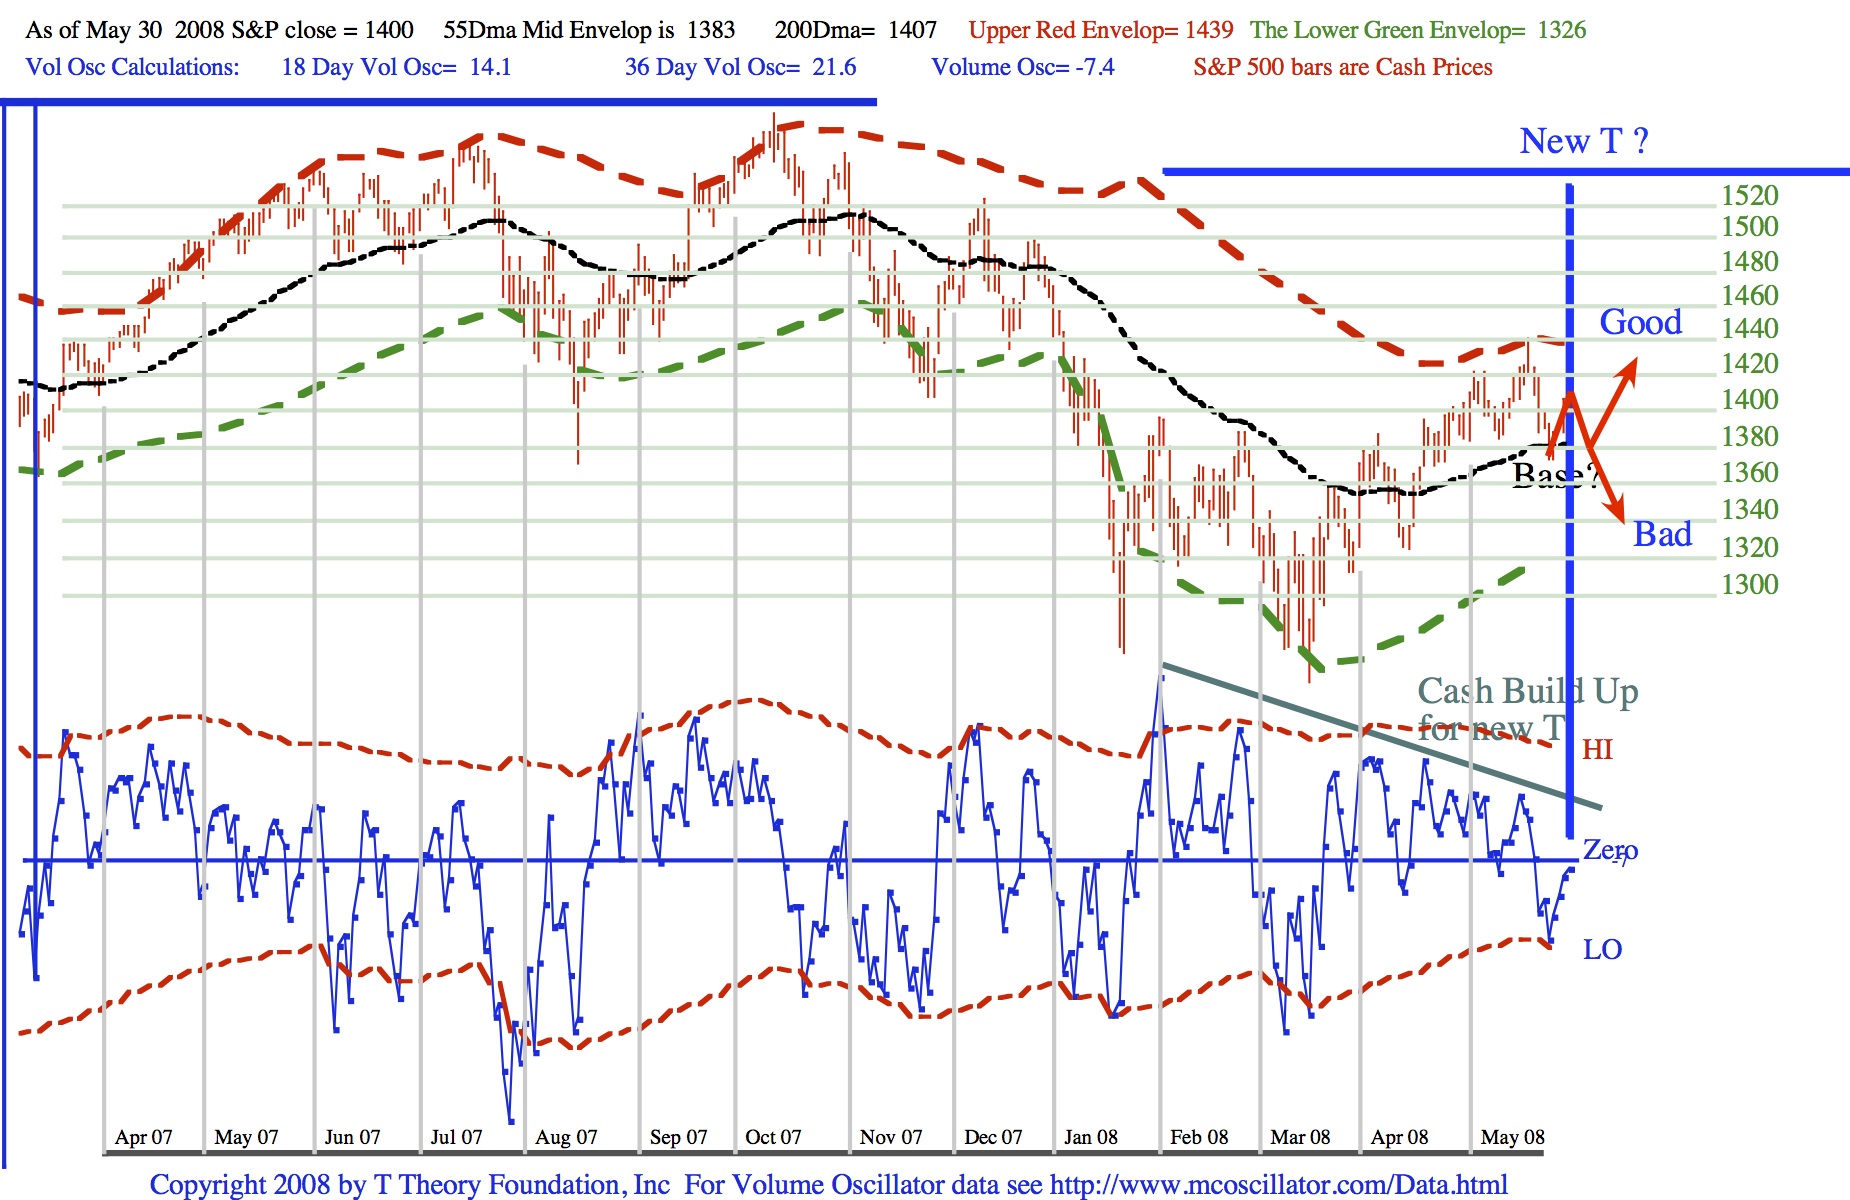
The S&P has bounced off the 55 Day MA in mid channel as expected but we have not yet started the new T’s rally. The blue volume oscillator is rising too slowly. Thus it would be expected that one more dip back to the 55 Day MA at mid channel would be necessary to set the stage for for the new Ts advance. At this point it is important that the next correction complete a “W” shaped bottom on the 55 Day MA then turn up in what I have labeled as the “Good” outcome, not the “Bad” example of a decline below the recent bottom.
The basic behavior of all Short Range Ts is that they begin their advance from the end of the Cash Build Up phase from a low in terms of the S&P that is either sitting on the black mid channel 55 Day MA or about 3.5% lower at the green dashed envelope in a more deeply oversold condition. If a new long term Advance-Decline T is planning a continuing advance into year end, as seems to be the case, the “W” bottom pattern must hold at mid channel. If the bullish case prevails, a two day dip is all that is needed to trigger the new T’s rally.
****************************************************************************************
All Rights Reserved By The T Theory® Foundation ©
Order the T Theory® Encyclopedia
For a complete understanding of the T Theory® and how to successfully use Terry’s unique methods, order the Encyclopedia from Paula at the above link. There is additional material in the encyclopedia not covered here. Paula will be more than happy to answer your questions too.
Many thanks to Paula Burke for her permission to re-post Terry’s old T Theory® explanations. The period re-blogged on these pages are some of Terry Laundry’s best work and was published here from public domain.
****************************************************************************************
I claim no credit for the material found under T Theory® on this blog. All of this material is the creation of Terry Laundry and was downloaded from Terry’s free blog site (TypePad). I have created a mirror of Terry’s original material and now there is a second site containing Terry’s T Theory®. One or both of these websites hopefully will survive through time as Terry’s material is too important to be lost to the ravages of time. This site is simply a memorial to his lifetime work.
The page content re-blogged here is exactly as Terry created on his original webpages (saved on my computer with ScrapBook)). Nothing has been left out from the period Dec 2003 to June 2011. From Terry’s site, I made a lot of formatting changes, creating a more easily readable webpage appearance. The PDF chart duplicates of the JPEGs have been omitted for ease and speed of recreating Terry’s pages. References to PDF charts should be ignored (but no chart was left out).
After June 2011, Terry created a paid subscription website. None of that material is found here.
There were many many, many hours spent on this project; downloading Terry’s individual charts & audio files, followed by the uploading of Terry’s charts and audio to my WordPress blog library, after which I had to insert the uploaded material into my new T Theory® webpages (hopefully in the correct places). This was a dull and arduous project and I hope you enjoy it. I don’t believe there remains any more of Terry’s material in free domain, so my T Theory® project is probably finished. If I’ve missed something, you can leave me a comment.
If you find an uploaded reference error (chart or audio in the wrong place), please note the month and year of the webpage, plus the exact name of the referenced error file. Include any other info that will help me locate the problem file and where it occurs on the webpage. Leave a comment for me with the info and I’ll fix it.
Terry’s material is very long and will take many weeks for you to finish. Don’t hurry, it’s not a marathon and you will absorb more if you go through it at a reasonable rate. This is especially true for those who don’t invest in the T Theory® reference encyclopedia. The encyclopedia is a written reference for T Theory® and includes everything of importance for Terry’s T Theory®. Without the reference encyclopedia you must depend on your memory and Terry’s method carries some rules that you could easily violate. The encyclopedia also includes new information never seen on his website.
You are welcome to save any or all of my blog material to your computer. You also have my permission to re-blog my information, but you must (1) credit me and my blog in an obvious manner and (2) don’t change my material.
FYI – I find the best way to save a webpage is using “ScrapBook” (it’s an add-on for the FireFox browser). ScrapBook saves a webpage to your computer EXACTLY as it appears on the day you saved it. You can’t tell the difference between the internet webpage and your ScrapBook saved webpage. The saved pages are not pictures. Instead the pages consist of HTML and page functionality remains identical on your computer. There is also a second method for using ScrapBook, where you can save all of the webpages down to a defined link depth. This optional method means all links will function on your computer to the link depth specified (meaning you can click on links on your saved webpages and tunnel down into pages within pages). Saving the normal way will only save the top webpage but the links that exist could continue to function by taking you to the website on the internet instead of on your computer. But sometimes the linked website doesn’t exist anymore. I’ve had this happen on some very good webpages with unique information (they just disappear into the internet void). That’s a bummer when you lost some really good info and thus rose my need for ScrapBook. You can also filter the pages saved using the optional ScrapBook method, which can exclude all pages not coming directly from the specified website (filtering is recommended using this method otherwise you wind up with a LOT of useless stuff).
.
Explore posts in the same categories: . . . T Theory®
Leave A Reply