July 2008 – T Theory® Update

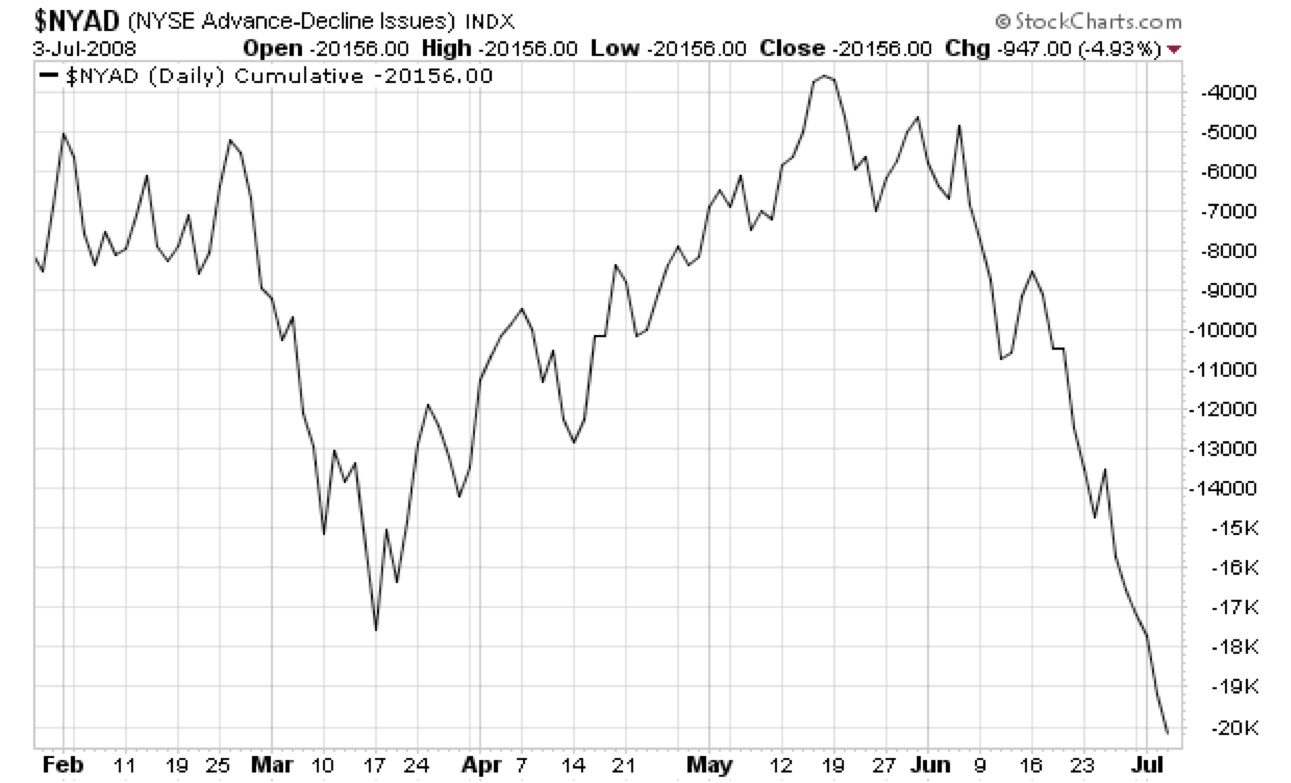
During July I will be providing the usual Monday morning updates in the daily charts. As the Advance -Decline line chart below shows the bear market has resumed as evidenced by the new lows in the NY A-D line plot last week. Download the PDF file for the A-D Line chart.
In addition to the daily charts I will be presenting some of my 40 year cycle work which points to an eventual late 2010 low.
Theory Observations for July 28 2008
Download the current PDF file for the updated daily chart.
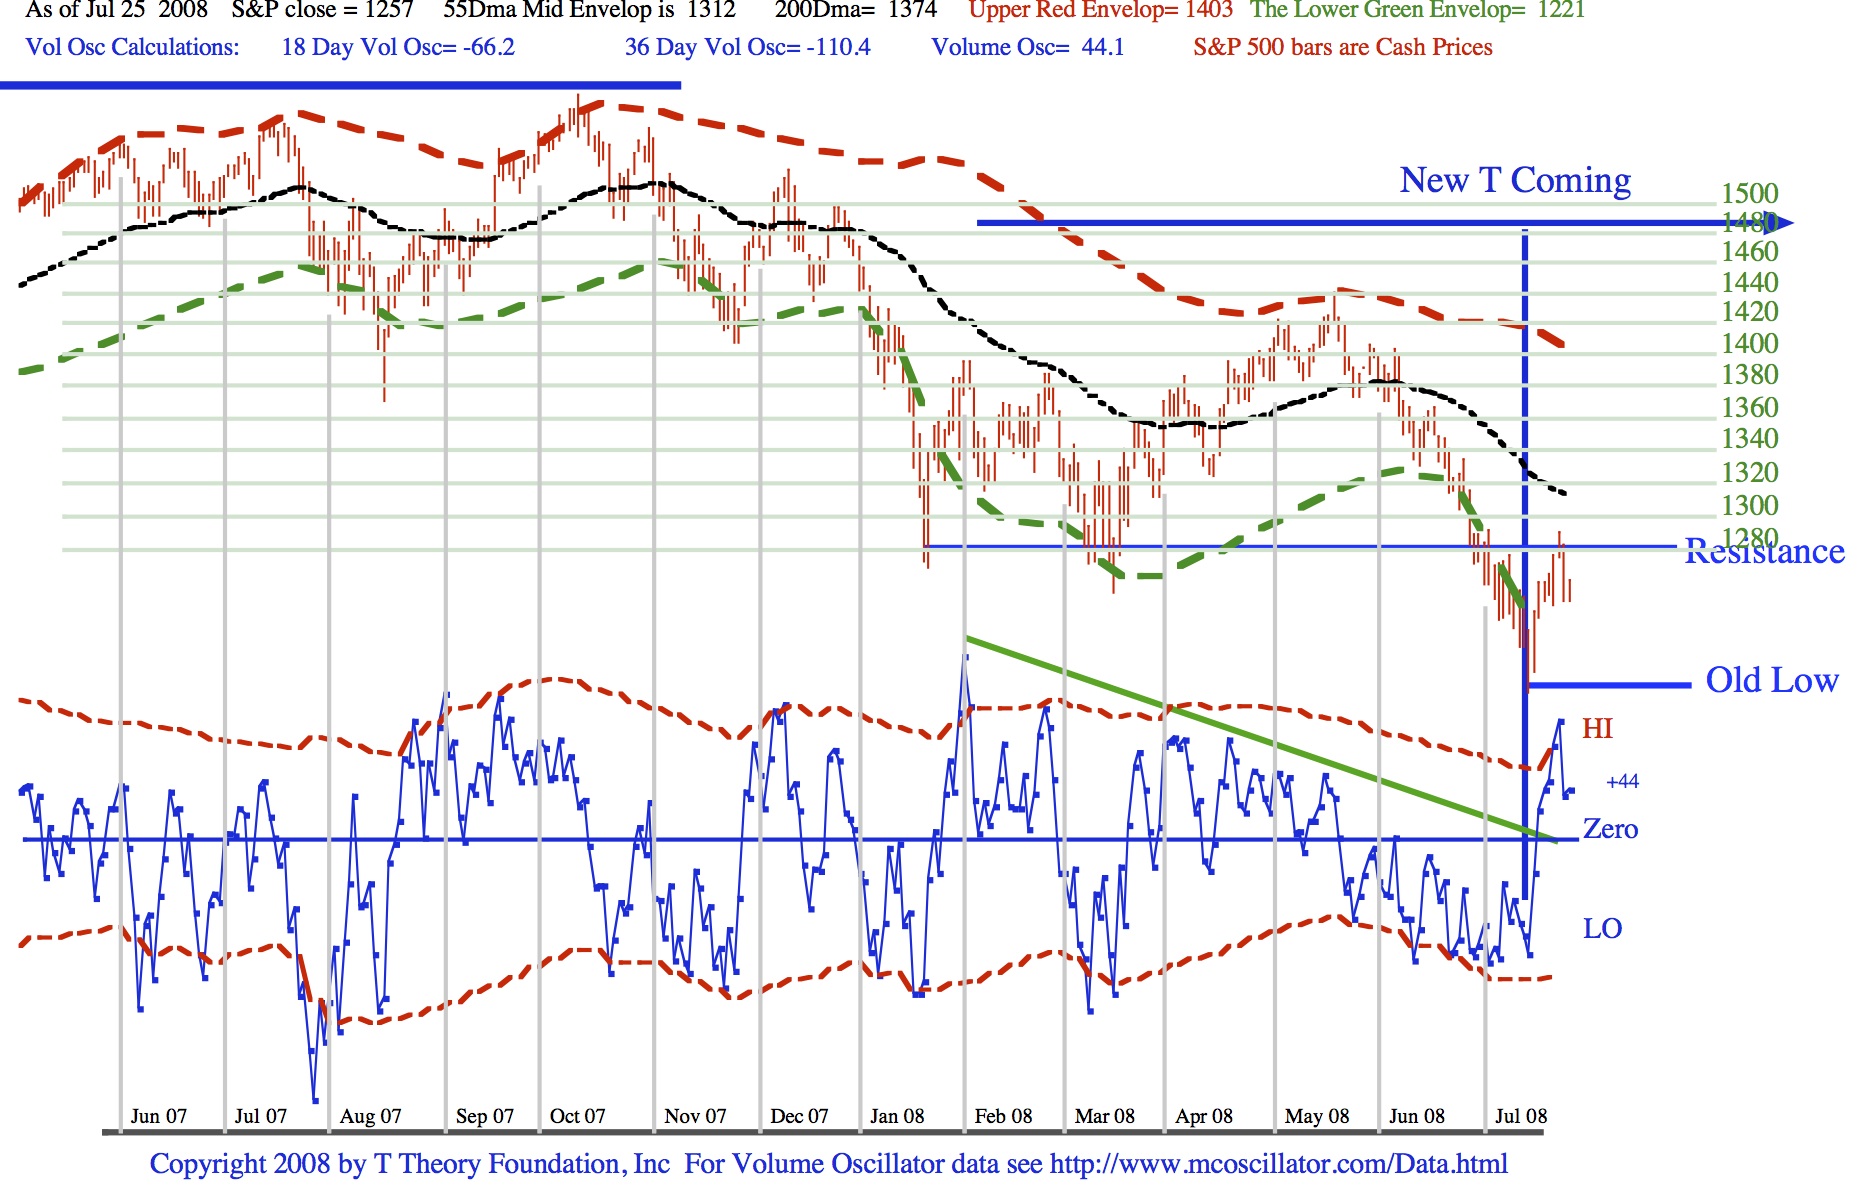
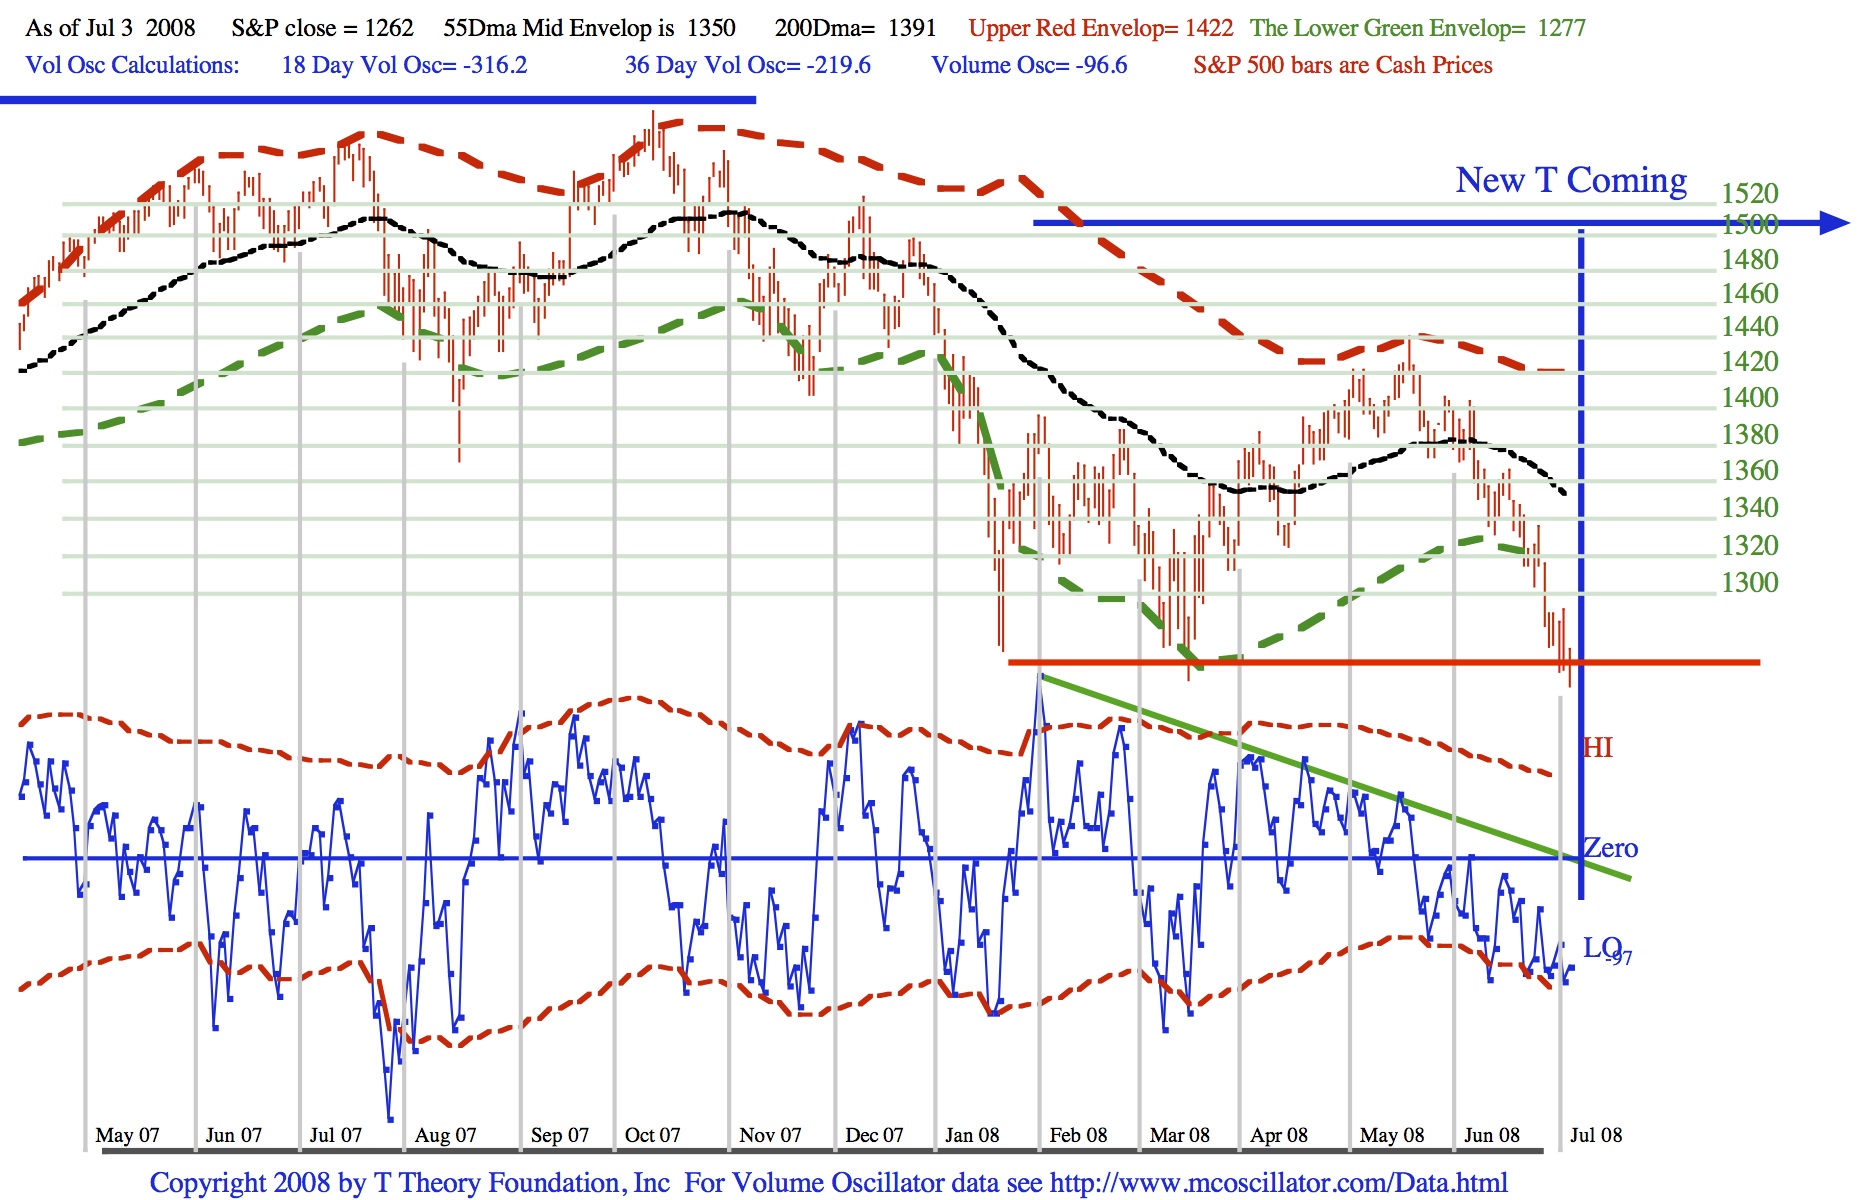
In last Fridays July 25 chart we see the sharp S&P 500 rally developing and peaking at the upper resistance level. This is the norm for any T coming out of a deep oversold condition. If the bear market wants to continue via the Bear T scenario, the ongoing down trend could just resume. However the bear T wouldn’t be confirmed for sure until the S&P broke below the old Lows.
Thus at this point the new T’s status is in limbo. However the 55 Day MA, which is declining steeply at mid channel, is often reached or attempted to be reached a second time before any down trend can be sustained within the right side of a new T.
This is most likely to occur after further correction but it is the next step needed to understand the new T’s longer term intentions.
Theory Observations for July 21 2008
Download the current PDF file for the updated daily chart.
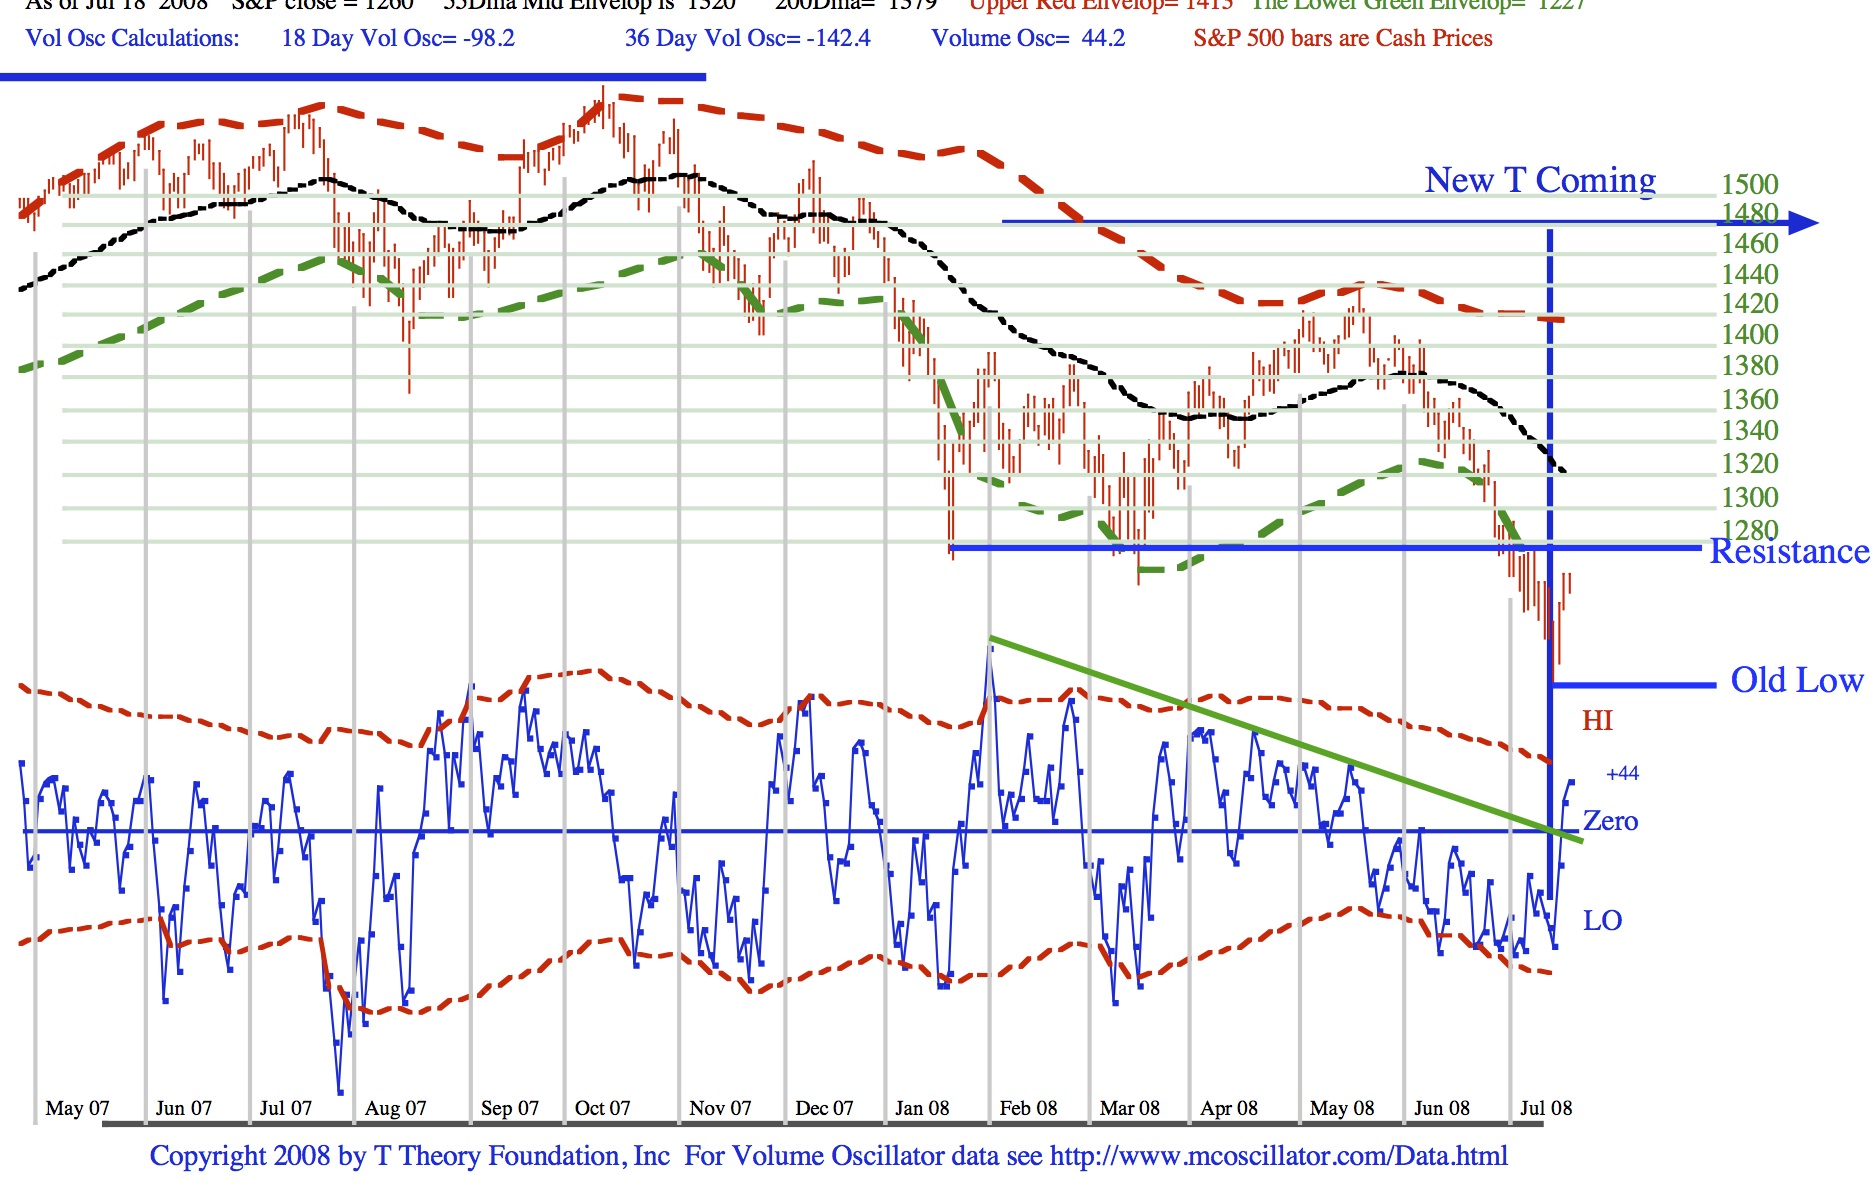
In July 18 chart we see the arrival of the new T with the sharp S&P 500 rally developing as the long declining green Cash Build Up line was cut to the upside. This is only the first step in T Theory, but an important one, because once the time span of the New T is fixed only certain market scenarios are seen historically in the new Ts right side.
Since this T has a left side spanning almost 6 months, and the right side must match this time period, this Ts will influence the S&P trend until early in 2009. Basically two different scenarios, the bullish vs bearish can develop for the S&P, within the right side of any new T.
The bullish outcome is the most common historically, and always develops within a long term bull market. It is characterized by a general rising trend for the overall market in the right side of the T, but corrections are common as the trend unfolds. For this case the buying power built up over the period of declining tops on the blue oscillator simple returns to the market and fuels a time matching market recovery.
For this new T to be of the bullish type, most of the important investor concerns that led to the selling starting at the Oscillator peak in early February and all the way down to the center post low a few days ago, will have to be put aside so they might recommit their sidelined funds back into the market with reasonable longer term upside prospects.
This is always possible, but unlikely in my mind, because the center post low for the new T is lower than the center post low for the last T( mid March) and this is almost always the signature for an ongoing bear market. However just to make sure we are not seeing an exception the first obstacle would be the overhead resistance noted in the chart at 1280 or so on the S&P 500. Another key level is the lower mid March low which is the center post low of the last T (not plotted). If the S&P can’t break up beyond of these resistance areas then, the new T isn’t Bullish. If it never happens, then we are locked into long term bear market trend.
The other step worth watching, is the exact nature of this new rally phase. It can be based just on short covering for up to about 5 to 7 trading days and therefore will have to be watched for clues after the initial oversold bounce is exhausted. After a few more days topping action would be another sign this new T is not bullish and may very well be of the bearish type.
Bearish Ts are rare, being found only in vicious bear market trends. To be confirmed this case requires the S&P to break below the Old Lows, that is the low at the center of this new T. The historical odds of this occurring are high come August, but how the market acts later this week as the short term rally peaks out will be the next bit of data needed for now.
Theory Observations for July 14 2008
Download the current PDF file for the updated daily chart.
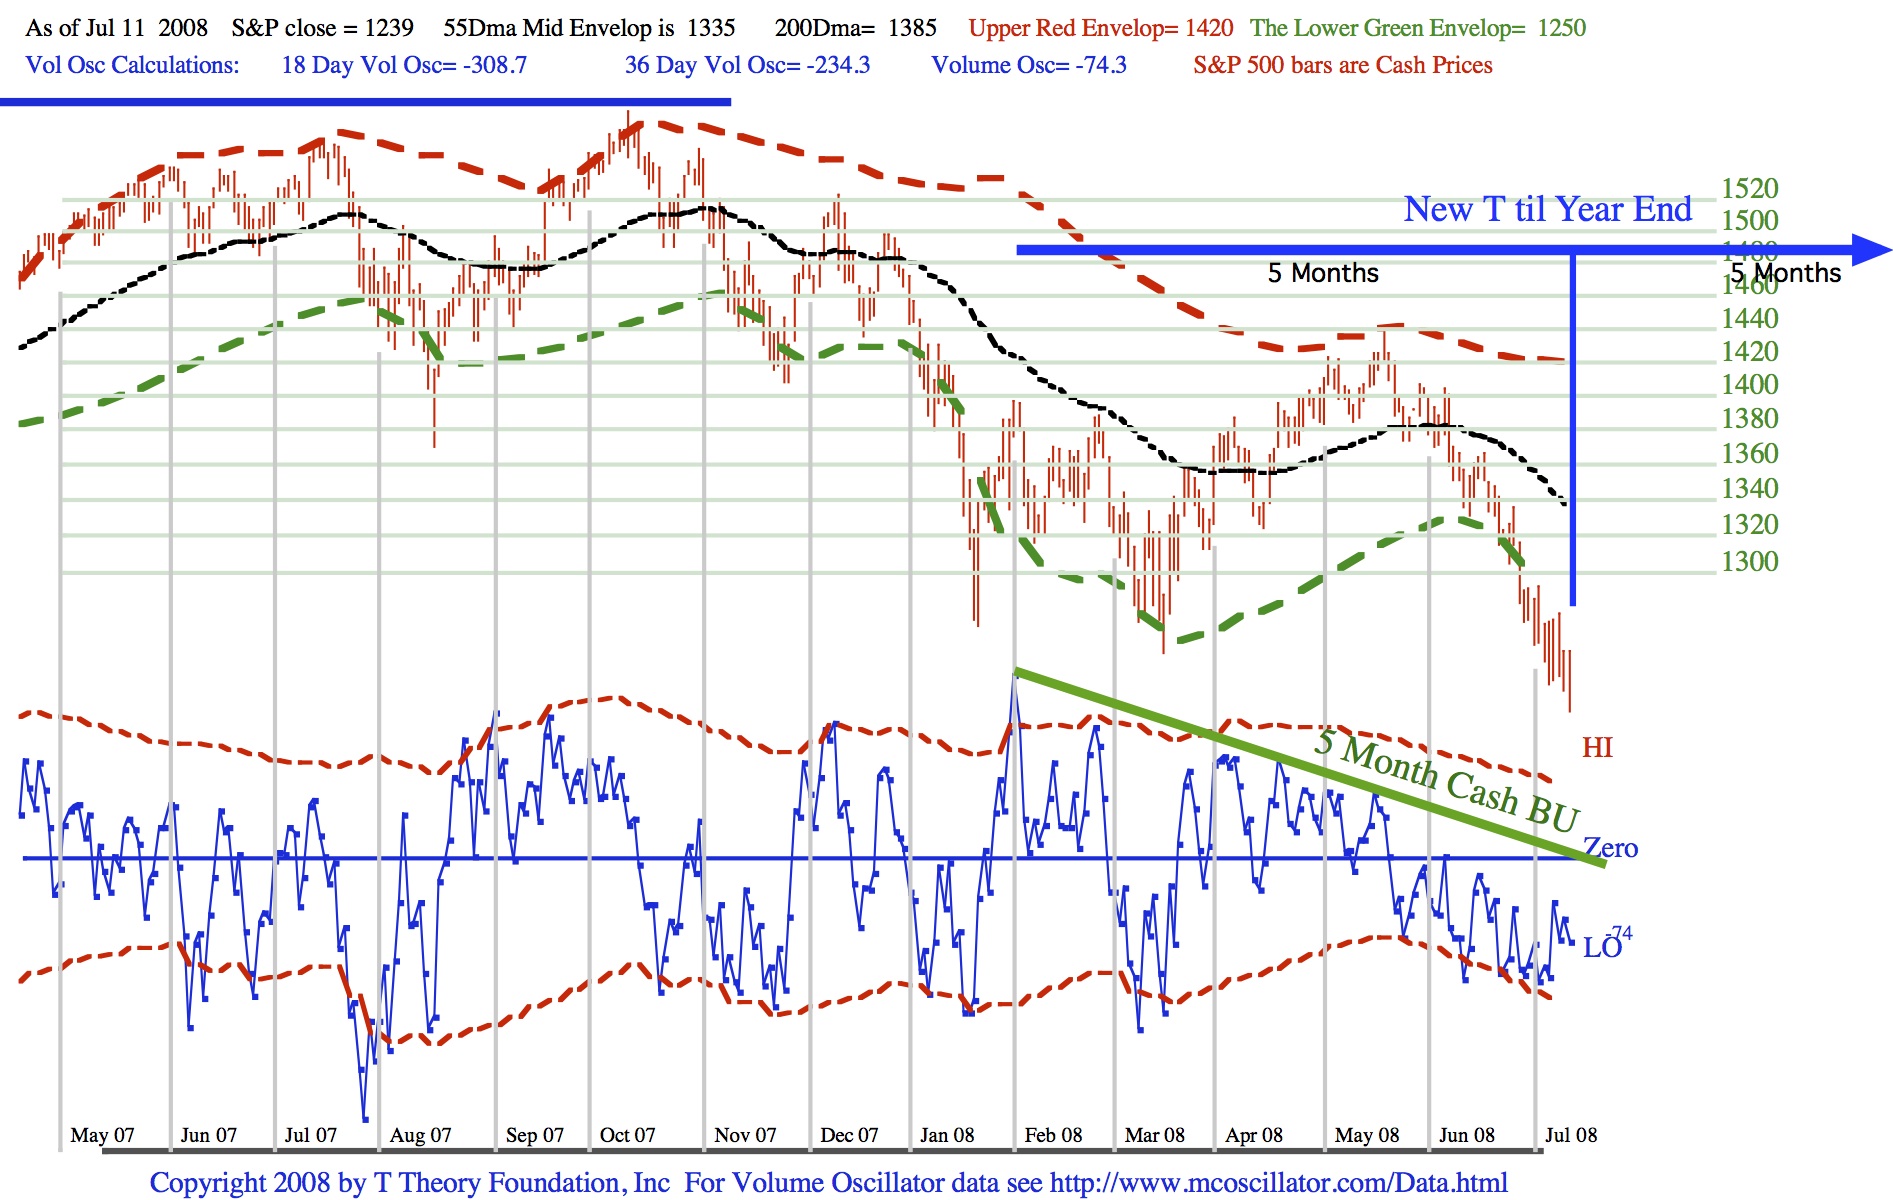
The pattern in the blue volume oscillator is preparing for the rally that will develop a confirmation of the New T this week. Following a sharp short (5-7 day) rally with the S&P rising up to the 55 day MA, the black line at mid channel, the newly formed T will likely collapse allowing the decline to continue.
This is potentially a very dangerous condition for the market because once a Short Range T’s time span has been defined there are only two S&P scenarios that can develop in the T’s right side. The normal Bullish T scenario takes the long cash build up time of some 5 months and uses that cash to fuel a rally through the matching 5 months that for this new T would provide a recovery into year end.
The alternate scenario, the Bearish T, takes the 5 month cash build up from the selling wave that we have been in, but under extremely negative conditions, this funds will not be willing to re-enter the market throughout the right side of the new T. This leaves the market very vulnerable through the whole right side of the T, which for this T means until year end.
I can not say this T will definitely be Bearish, but the odds favor that investors are in no mood to go on any extended buying spree for the next 5 months.
So this new T’s initial rally is best viewed as a selling opportunity.
T Theory Observations for July 7 2008
Download the current PDF file for the updated daily chart.
The pattern in the blue volume oscillator is quite unusual in that it sits in an over-sold condition. I have never seen such activity but it is bearish.
Additionally, there is a negative to the current pattern even before we can confirm a new T. Note the S&P is near its prior low as denoted by the red horizontal line. The oscillator pattern is too shallow right now to represent the center post low for a new T.
Usually the oscillator rallies back up to the green cash build up line, then turns down in a sharp selling climax making the characteristic V pattern that marks the turning point for any new T. It is therefore likely that selling pressure will abate somewhat as a potential double bottom in the S&P is seen. But it probably will just be enough of a hesitation to allow the oscillator to rise up to the green descending tops line then plunge down to a very oversold condition. This new oversold condition then is more likely to represent the center post low for the new T.
The big negative we will then likely face is an S&P that is under the red line confirming resumption of the bear market.
****************************************************************************************
All Rights Reserved By The T Theory® Foundation ©
Order the T Theory® Encyclopedia
For a complete understanding of the T Theory® and how to successfully use Terry’s unique methods, order the Encyclopedia from Paula at the above link. There is additional material in the encyclopedia not covered here. Paula will be more than happy to answer your questions too.
Many thanks to Paula Burke for her permission to re-post Terry’s old T Theory® explanations. The period re-blogged on these pages are some of Terry Laundry’s best work and was published here from public domain.
****************************************************************************************
I claim no credit for the material found under T Theory® on this blog. All of this material is the creation of Terry Laundry and was downloaded from Terry’s free blog site (TypePad). I have created a mirror of Terry’s original material and now there is a second site containing Terry’s T Theory®. One or both of these websites hopefully will survive through time as Terry’s material is too important to be lost to the ravages of time. This site is simply a memorial to his lifetime work.
The page content re-blogged here is exactly as Terry created on his original webpages (saved on my computer with ScrapBook)). Nothing has been left out from the period Dec 2003 to June 2011. From Terry’s site, I made a lot of formatting changes, creating a more easily readable webpage appearance. The PDF chart duplicates of the JPEGs have been omitted for ease and speed of recreating Terry’s pages. References to PDF charts should be ignored (but no chart was left out).
After June 2011, Terry created a paid subscription website. None of that material is found here.
There were many many, many hours spent on this project; downloading Terry’s individual charts & audio files, followed by the uploading of Terry’s charts and audio to my WordPress blog library, after which I had to insert the uploaded material into my new T Theory® webpages (hopefully in the correct places). This was a dull and arduous project and I hope you enjoy it. I don’t believe there remains any more of Terry’s material in free domain, so my T Theory® project is probably finished. If I’ve missed something, you can leave me a comment.
If you find an uploaded reference error (chart or audio in the wrong place), please note the month and year of the webpage, plus the exact name of the referenced error file. Include any other info that will help me locate the problem file and where it occurs on the webpage. Leave a comment for me with the info and I’ll fix it.
Terry’s material is very long and will take many weeks for you to finish. Don’t hurry, it’s not a marathon and you will absorb more if you go through it at a reasonable rate. This is especially true for those who don’t invest in the T Theory® reference encyclopedia. The encyclopedia is a written reference for T Theory® and includes everything of importance for Terry’s T Theory®. Without the reference encyclopedia you must depend on your memory and Terry’s method carries some rules that you could easily violate. The encyclopedia also includes new information never seen on his website.
You are welcome to save any or all of my blog material to your computer. You also have my permission to re-blog my information, but you must (1) credit me and my blog in an obvious manner and (2) don’t change my material.
FYI – I find the best way to save a webpage is using “ScrapBook” (it’s an add-on for the FireFox browser). ScrapBook saves a webpage to your computer EXACTLY as it appears on the day you saved it. You can’t tell the difference between the internet webpage and your ScrapBook saved webpage. The saved pages are not pictures. Instead the pages consist of HTML and page functionality remains identical on your computer. There is also a second method for using ScrapBook, where you can save all of the webpages down to a defined link depth. This optional method means all links will function on your computer to the link depth specified (meaning you can click on links on your saved webpages and tunnel down into pages within pages). Saving the normal way will only save the top webpage but the links that exist could continue to function by taking you to the website on the internet instead of on your computer. But sometimes the linked website doesn’t exist anymore. I’ve had this happen on some very good webpages with unique information (they just disappear into the internet void). That’s a bummer when you lost some really good info and thus rose my need for ScrapBook. You can also filter the pages saved using the optional ScrapBook method, which can exclude all pages not coming directly from the specified website (filtering is recommended using this method otherwise you wind up with a LOT of useless stuff).
.
Explore posts in the same categories: . . . T Theory®
Leave A Reply