April 2008 – T Theory® Update

During April I will be providing the usual Monday morning updates in the daily charts. Terry Laundry
T Theory Observations Update for April 28 2008.
The market is limping upward to the current Short Range T’s projected peak at month end as noted in the updated PDF chart below. You should download the file now.
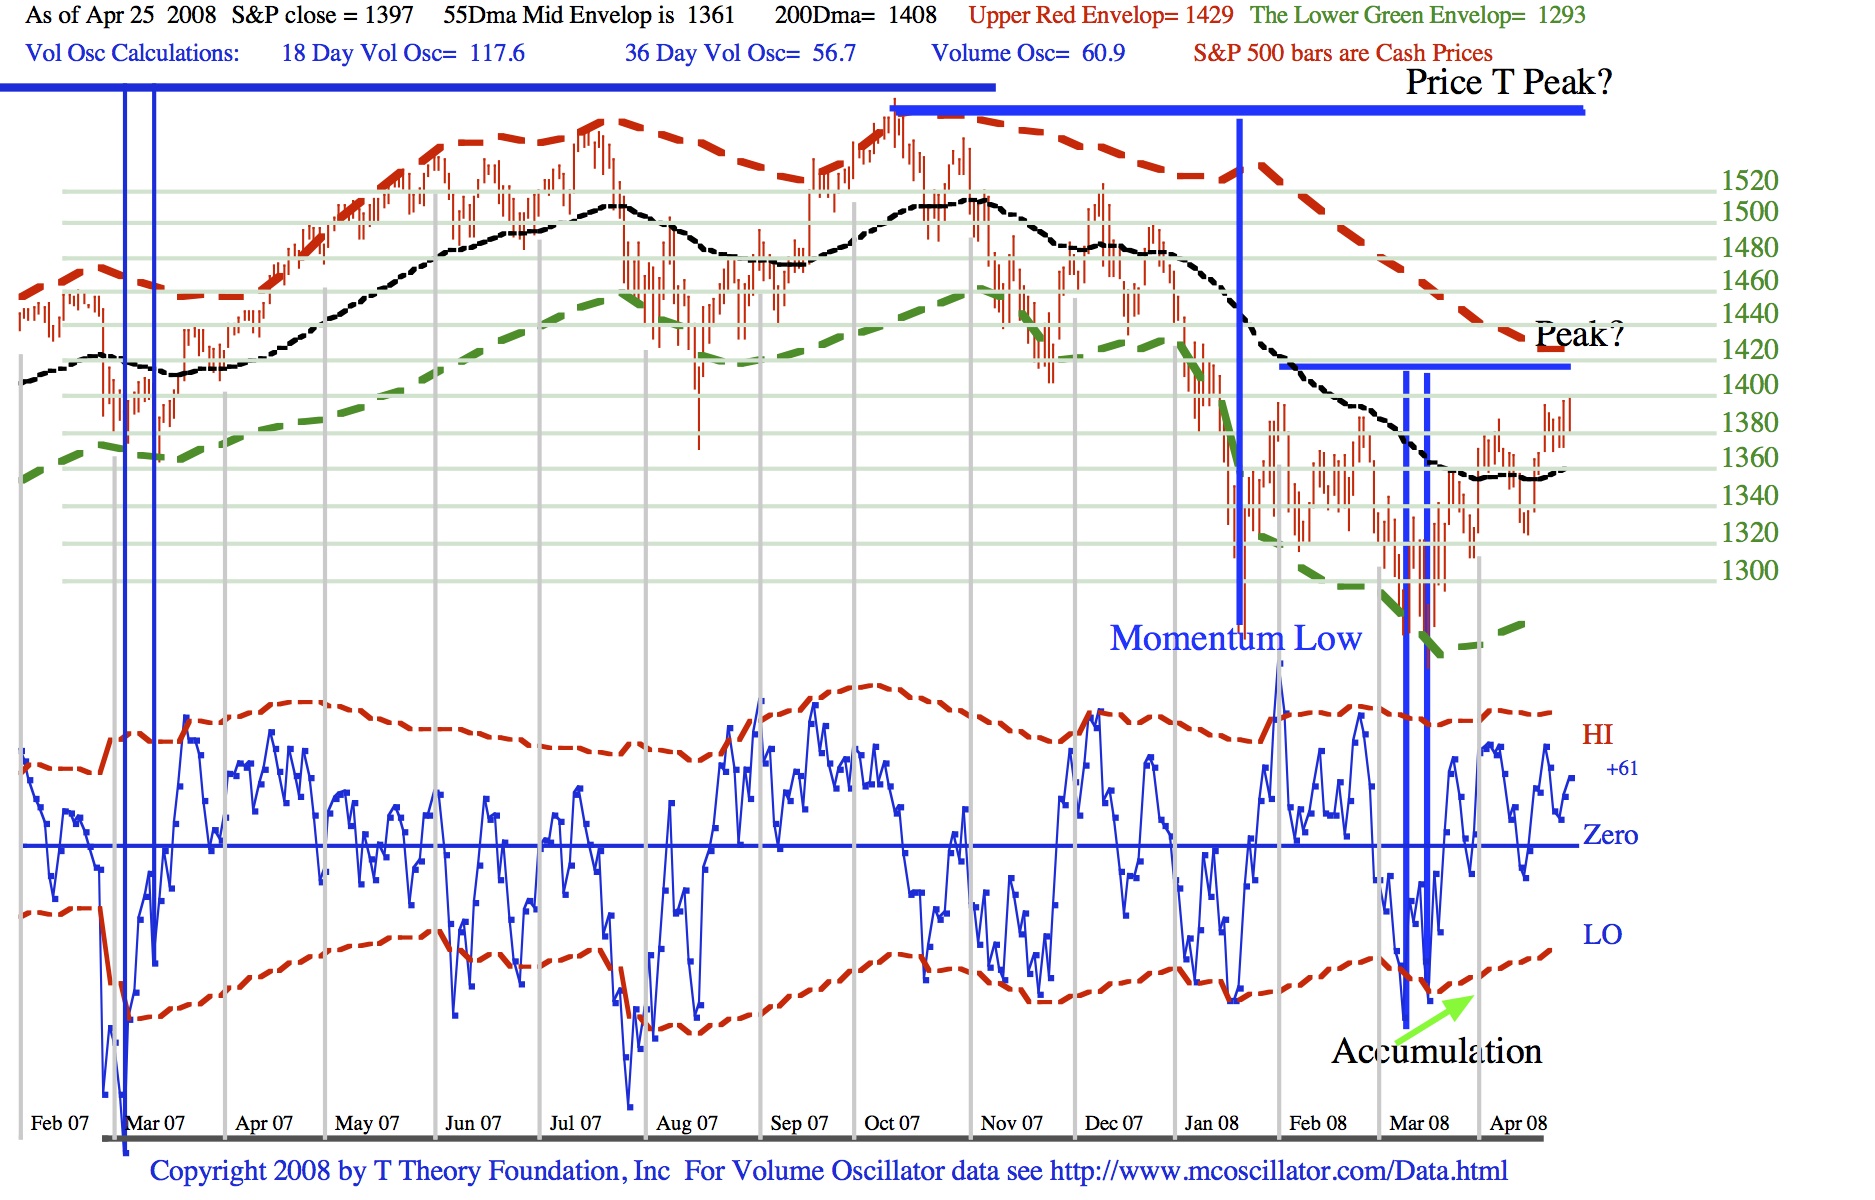
Looking over the daily chart we also see another interpretation of the T time symmetry that I discovered in 1973; the simpler Price T. These Time symmetry’s are simple to construct because they only make use of the S&P 500 daily “price” bars, but they may not be completely reliable under certain instances.
Nevertheless this S&P price T says that the rally from the mid January momentum low should only be able to last for as many days as the decline from the mid October true intraday price high, down to the S&P to the Momentum low. Remarkably the Simple T’s projection of its peak date is roughly identical to the volume Oscillator T ‘s projection of a late April peak as you can readily see in the chart.
For this period therefore we can be more confident that a peak is on tap next week and it is more likely to be an important one. Longer spanning Ts are generally more appropriate when the longer term outlook needs to be understood. This price T will be needed as we move along in May.
Looking ahead to next week, it seems possible that the Federal Reserve may disappoint, either by no cut or one last small cut. If so, it might seem that this price T was not the basic cause for a topping. But if we can show some persistence to the late April peak, then the larger Simple T will become the more powerful tool in T Theory to look ahead to the next important oversold condition.
T Theory Observations Update for April 21 2008.
Good earnings and a positive market reaction to them has perked the current Short Range T’s advance as noted in the updated PDF chart below. In May I will delve into the criteria for sustainability via a potential new longer term Advance-Decline T, but for now we are getting close to the current T’s project top date which will be near the end of April.
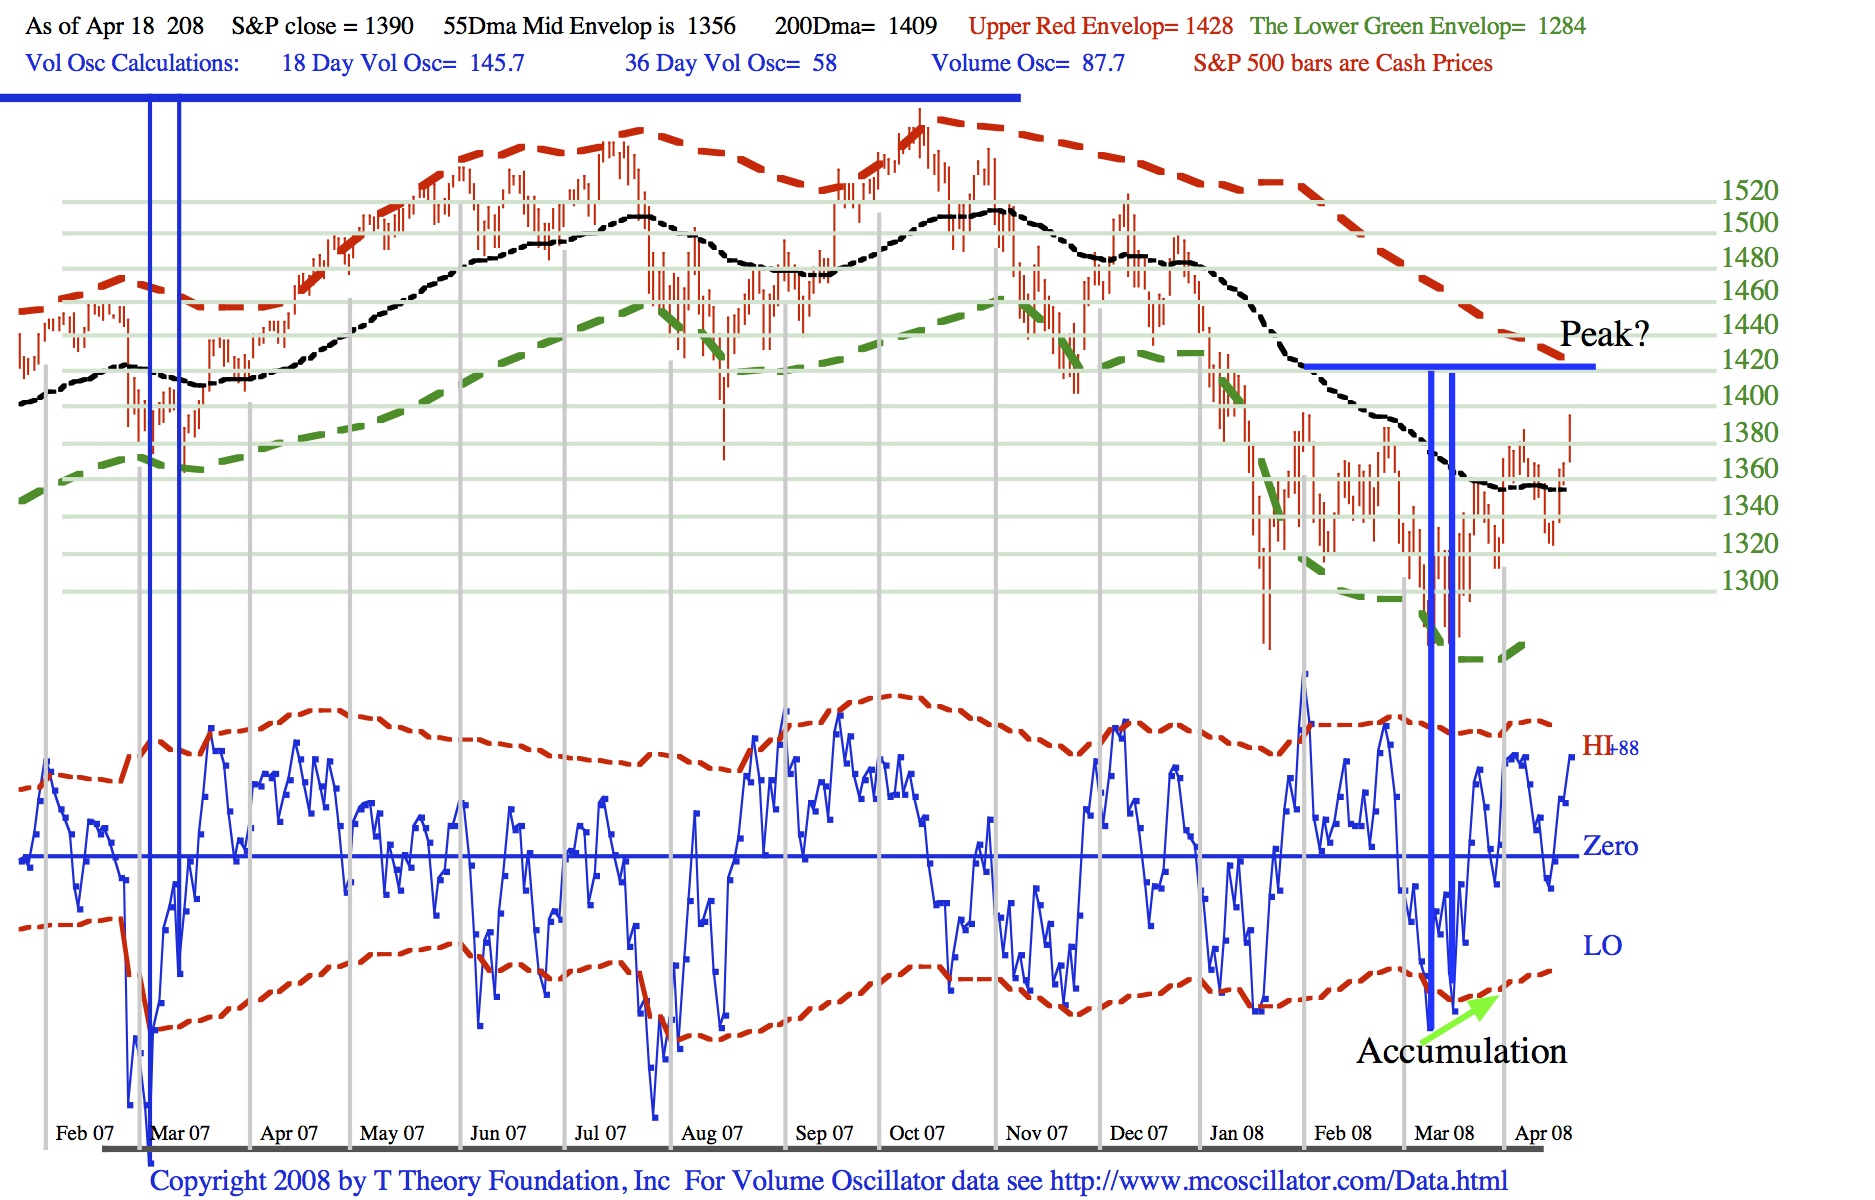
Looking over the daily chart we see, thus far, that the Accumulation low pattern has produced a persistent S&P advance during the right side of the current T. With further time remaining, the S&P 500 should be pushed into the upper red dashed envelope S&P 1428 as noted in the data at the top of the chart. Very soon we will be able to see if the behavior beyond the current T’s expiration during May will allow a new Bullish type of Short Range T to get started within the context of a more important upturn that could become a new, longer range, Advance-Decline T. Any chart of the daily NYSE A-D Line will show a decline from mid 2007 to the last low of about 11 months so that is the maximum duration of any new bullish trend, if confirmed.
Obviously the A-D line needs to become stronger than it has been, but this, in its self, is not sufficient to reverse a downtrend with any conviction. The only criteria that would be very interesting would be a completely bullish pattern that is singular in nature, much like the Accumulation low. A true bullish trend requirers a new Short Range T to develop while the S&P 500 pulls back to the 55 Day MA, S&P 1356 currently, but does not penetrate the 55 day MA to the downside, as the next T completes its left side cash build up phase. In this case the new T can then launch an new uptrend while both stock prices and the A-D Line are firm.
Any outcome that is significantly weaker will result in a half hearted attempt that will ultimately fail. So for now we will only watch the current small T close out its time symmetrical projection then gauge its final performance.
T Theory Observations Update for April 14 2008.
On Friday General Electric shocked Wall Street with its unexpected negative causing the S&P to break below the key 55 day MA support level as shown in the updated chart. Download its PDF file from the link below.
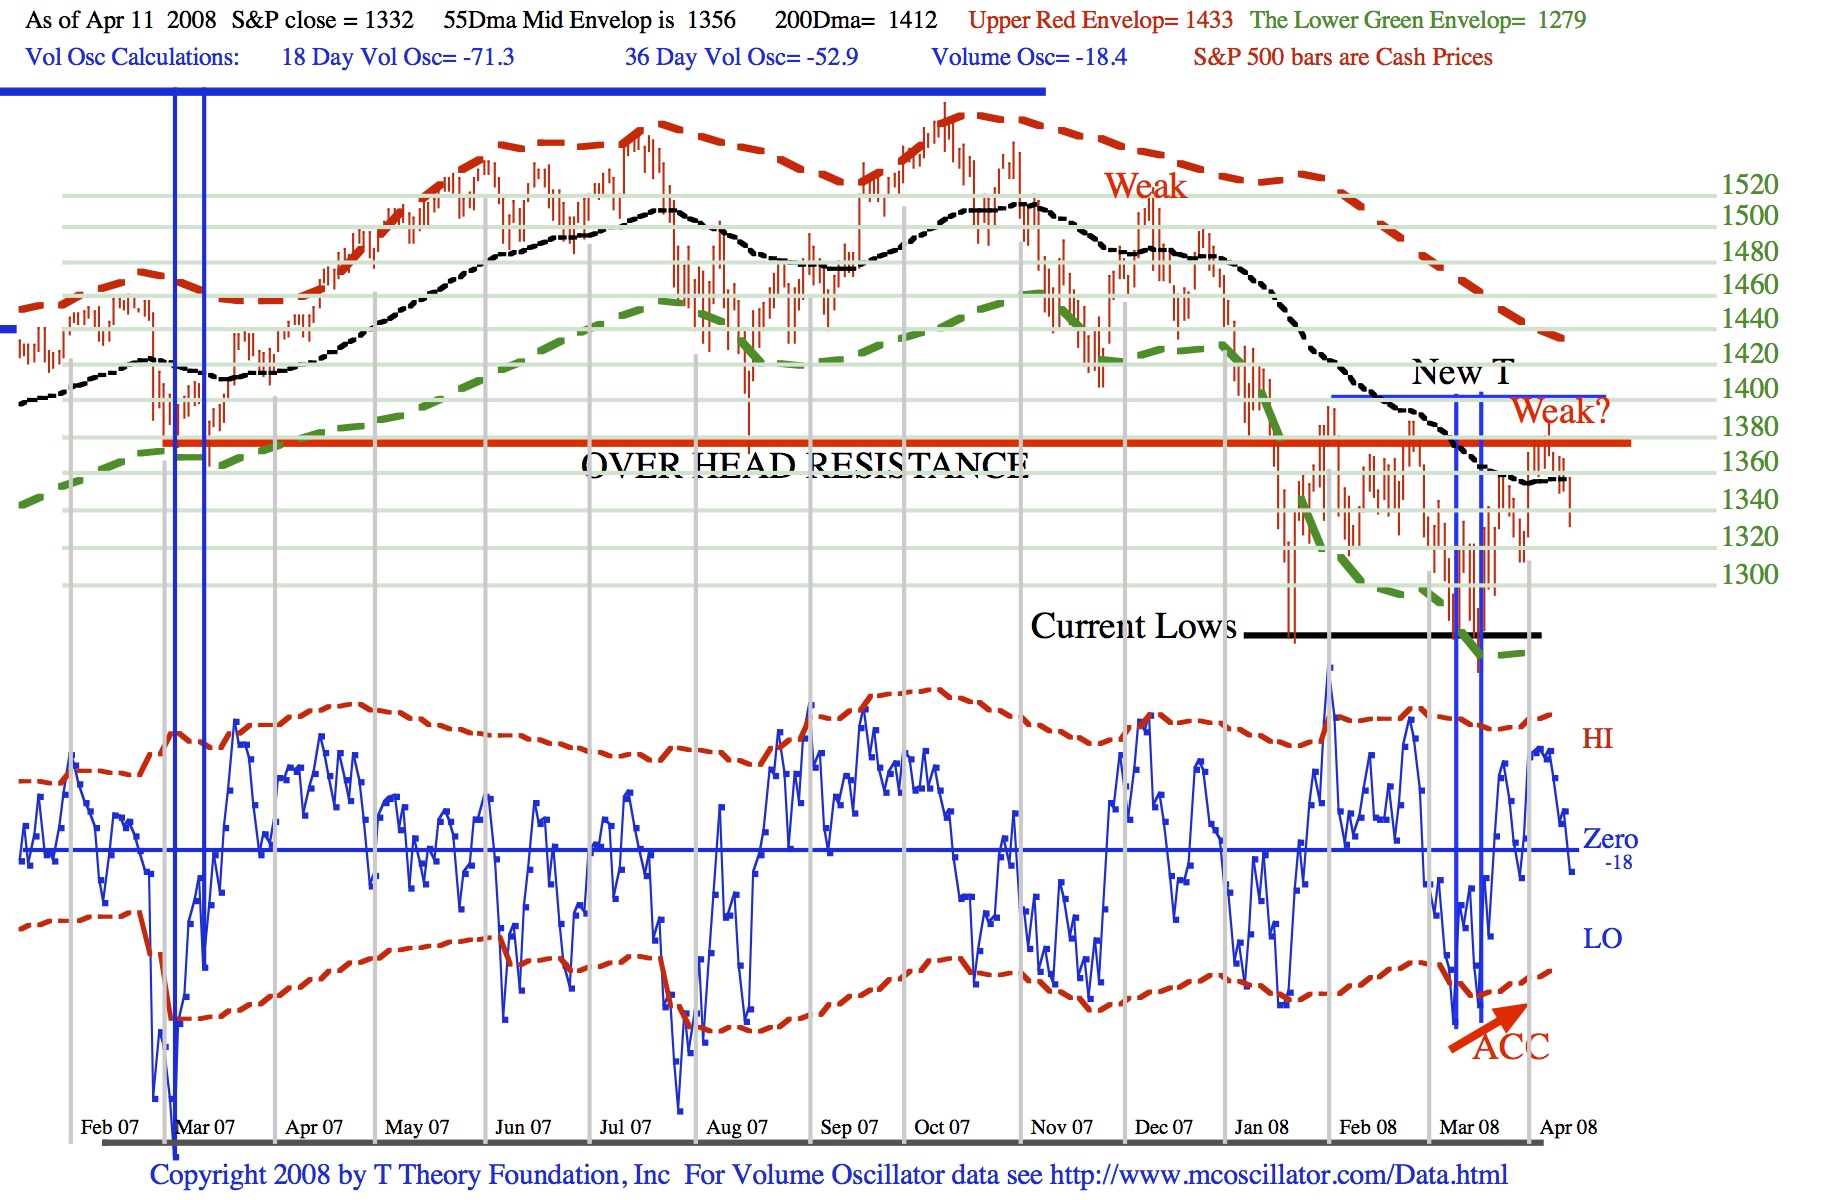
This is a sign of weakness as I have noted in the chart by the text “weak” and suggests we may be seeing a topping formation much as we saw in December. If so, one more short term rally is all that this T may be able to provide, followed by resumption of the long term bear market to a lower low in a new June/July oversold condition.
Exactly how this develops will be dictated by the flood of new earnings reports coming out over the next two weeks and the market’s reaction to them.
T Theory Observations Update for April 7 2008.
Last week the S&P popped up above the 55 day MA as shown in the updated chart which maybe be download from the link below. This confirms a new very small T as shown in the PDF file which will support the market through the April earnings announcements.
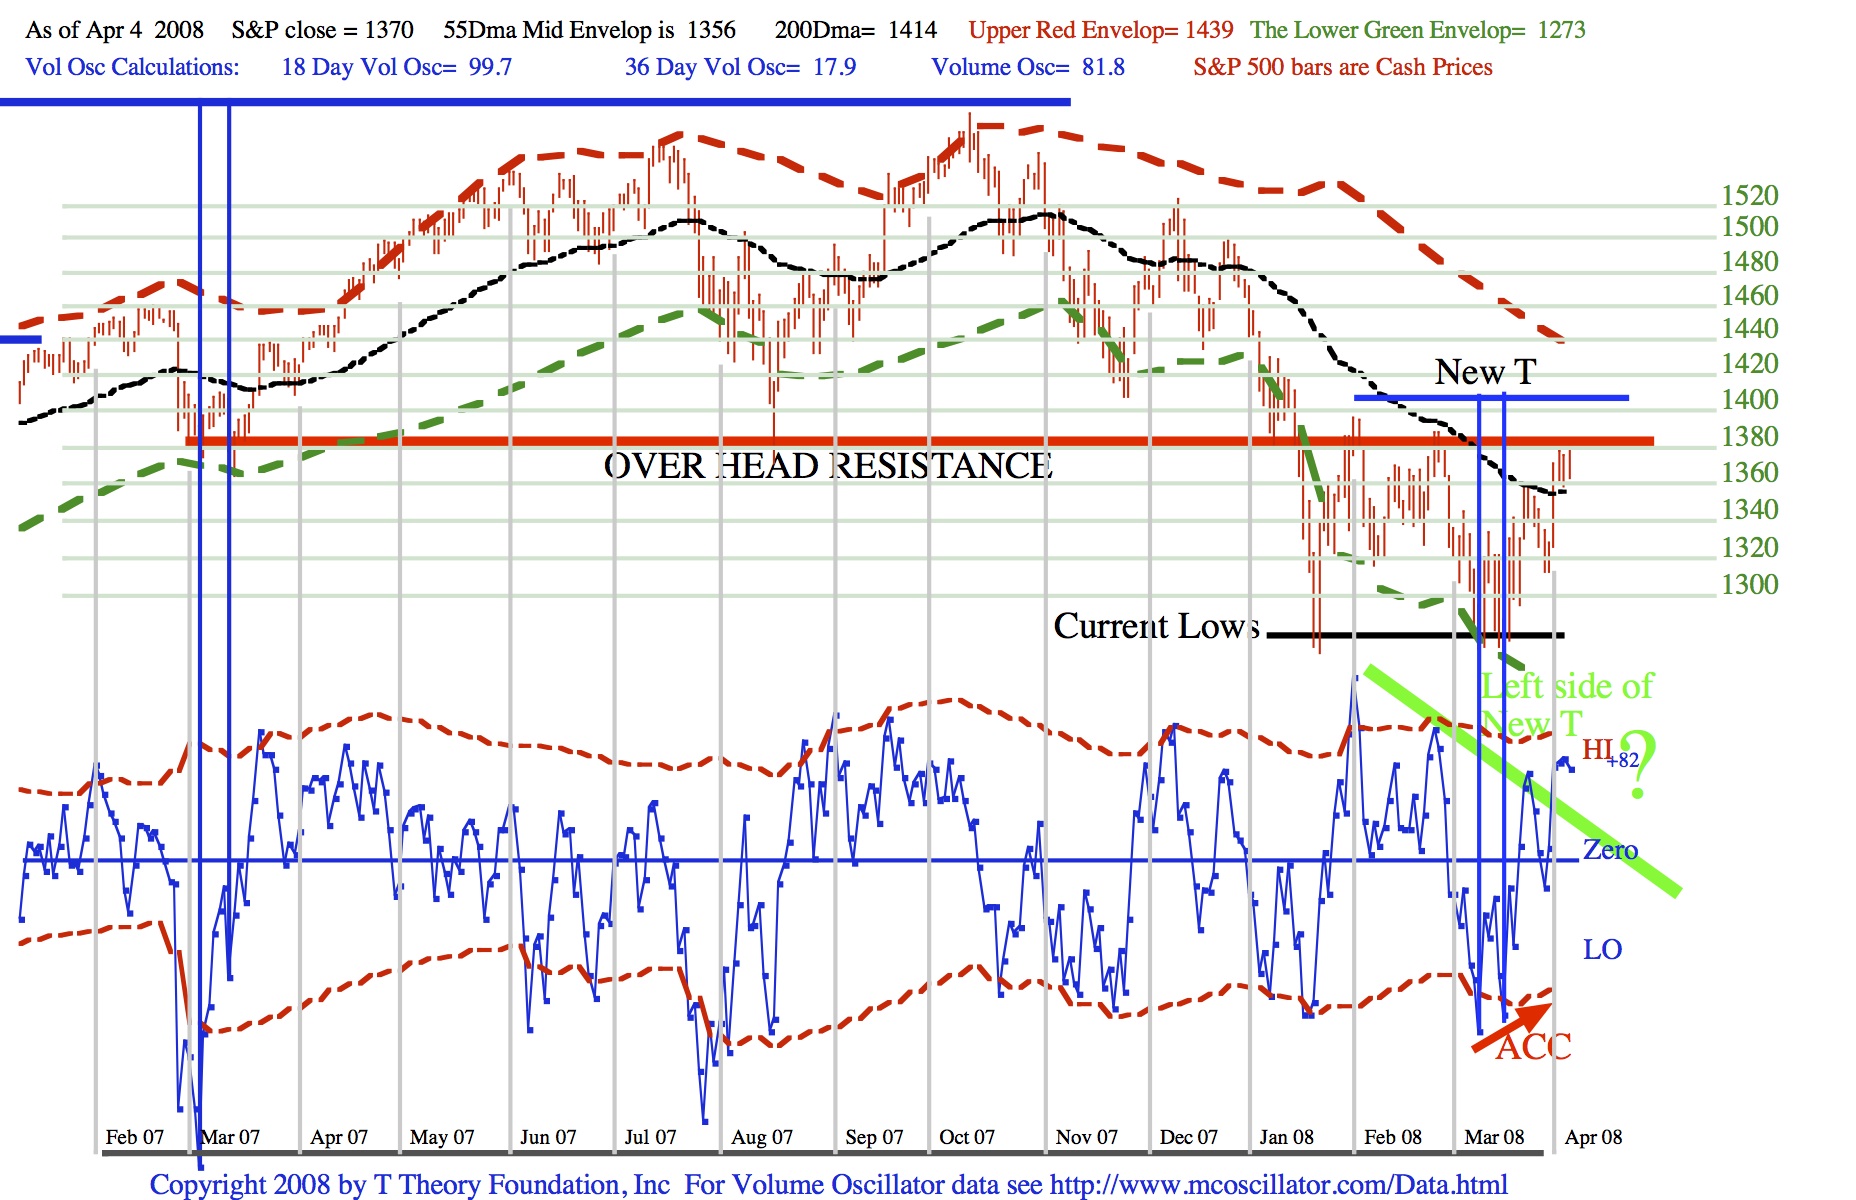
The T is constructed by the usual conservative procedure of splitting the double bottom in the blue volume oscillator to locate the T’s center post location. In this case the twin lows form an accumulation pattern which I define as a rising bottom in the oscillator with a simultaneous lower closing low for the S&P on the second bottom. This ACC pattern is stronger than a simple rising set of bottoms which probably accounts for last week’s sudden break above the 55 day resistance.
To complete the time symmetry for the record; we simply say that this is an example of a so-called bullish type of T, that is one which is characterized by maximum strength coming out of the center post lows followed by diminishing upside momentum as the trend slides towards the T’s right end date. The time projection of this T’s right end date is calculated by the basic time equation which requires the the number days from the second oscillator low to the projected date of the S&P peak will eventually become equal the number of days from oscillator peak at the left end of the T down to the first center post low in the Oscillator. I will detail this calculation in the next update as an illustration. History shows these time projects for tops are OK as a general guide but the channel bounds in the S&P plot will become more informative in the weeks ahead.
As I noted last week, any new strength would likely produce an overbought condition quite quickly and this can be seen as true by referencing the volume oscillator’s condition. However once the S&P has broken above the 55 day MA is becomes support on any corrections within the right side of the T. So being overbought doesn’t mean the S&P will fall below the mid channel 55 Day black line, rather it may sit on it for short periods, then advance further for the T’s duration.
The T’s estimated time peak for the S&P is better interpreted by expecting the uptrend to reach (or come close to) the upper red dashed bound of my envelopes, currently listed as S&P 1439 in the chart data. Knowing what should happen in both price and time provides the better way to monitor the projected T’s trend.
****************************************************************************************
All Rights Reserved By The T Theory® Foundation ©
Order the T Theory® Encyclopedia
For a complete understanding of the T Theory® and how to successfully use Terry’s unique methods, order the Encyclopedia from Paula at the above link. There is additional material in the encyclopedia not covered here. Paula will be more than happy to answer your questions too.
Many thanks to Paula Burke for her permission to re-post Terry’s old T Theory® explanations. The period re-blogged on these pages are some of Terry Laundry’s best work and was published here from public domain.
****************************************************************************************
I claim no credit for the material found under T Theory® on this blog. All of this material is the creation of Terry Laundry and was downloaded from Terry’s free blog site (TypePad). I have created a mirror of Terry’s original material and now there is a second site containing Terry’s T Theory®. One or both of these websites hopefully will survive through time as Terry’s material is too important to be lost to the ravages of time. This site is simply a memorial to his lifetime work.
The page content re-blogged here is exactly as Terry created on his original webpages (saved on my computer with ScrapBook)). Nothing has been left out from the period Dec 2003 to June 2011. From Terry’s site, I made a lot of formatting changes, creating a more easily readable webpage appearance. The PDF chart duplicates of the JPEGs have been omitted for ease and speed of recreating Terry’s pages. References to PDF charts should be ignored (but no chart was left out).
After June 2011, Terry created a paid subscription website. None of that material is found here.
There were many many, many hours spent on this project; downloading Terry’s individual charts & audio files, followed by the uploading of Terry’s charts and audio to my WordPress blog library, after which I had to insert the uploaded material into my new T Theory® webpages (hopefully in the correct places). This was a dull and arduous project and I hope you enjoy it. I don’t believe there remains any more of Terry’s material in free domain, so my T Theory® project is probably finished. If I’ve missed something, you can leave me a comment.
If you find an uploaded reference error (chart or audio in the wrong place), please note the month and year of the webpage, plus the exact name of the referenced error file. Include any other info that will help me locate the problem file and where it occurs on the webpage. Leave a comment for me with the info and I’ll fix it.
Terry’s material is very long and will take many weeks for you to finish. Don’t hurry, it’s not a marathon and you will absorb more if you go through it at a reasonable rate. This is especially true for those who don’t invest in the T Theory® reference encyclopedia. The encyclopedia is a written reference for T Theory® and includes everything of importance for Terry’s T Theory®. Without the reference encyclopedia you must depend on your memory and Terry’s method carries some rules that you could easily violate. The encyclopedia also includes new information never seen on his website.
You are welcome to save any or all of my blog material to your computer. You also have my permission to re-blog my information, but you must (1) credit me and my blog in an obvious manner and (2) don’t change my material.
FYI – I find the best way to save a webpage is using “ScrapBook” (it’s an add-on for the FireFox browser). ScrapBook saves a webpage to your computer EXACTLY as it appears on the day you saved it. You can’t tell the difference between the internet webpage and your ScrapBook saved webpage. The saved pages are not pictures. Instead the pages consist of HTML and page functionality remains identical on your computer. There is also a second method for using ScrapBook, where you can save all of the webpages down to a defined link depth. This optional method means all links will function on your computer to the link depth specified (meaning you can click on links on your saved webpages and tunnel down into pages within pages). Saving the normal way will only save the top webpage but the links that exist could continue to function by taking you to the website on the internet instead of on your computer. But sometimes the linked website doesn’t exist anymore. I’ve had this happen on some very good webpages with unique information (they just disappear into the internet void). That’s a bummer when you lost some really good info and thus rose my need for ScrapBook. You can also filter the pages saved using the optional ScrapBook method, which can exclude all pages not coming directly from the specified website (filtering is recommended using this method otherwise you wind up with a LOT of useless stuff).
.
Explore posts in the same categories: . . . T Theory®
Leave A Reply