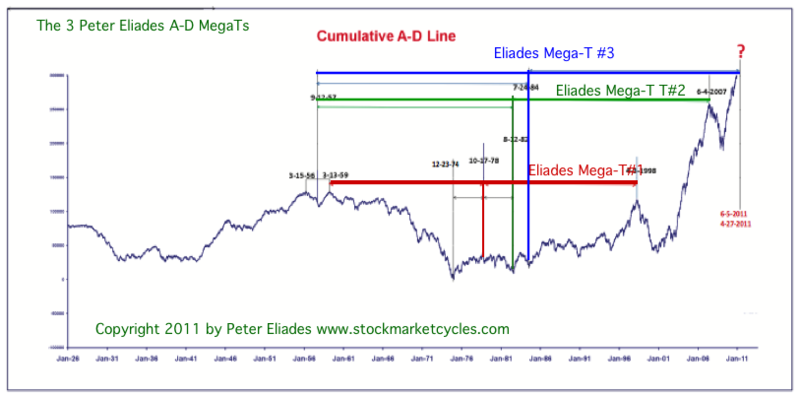
March 2011 – T Theory® Update

Download TTOAudio20110320A to Listen to Terry’s mp3 Audio commentary
while looking at the PDF Daily Chart
Download DailyChart20110318pdf

———————————————–
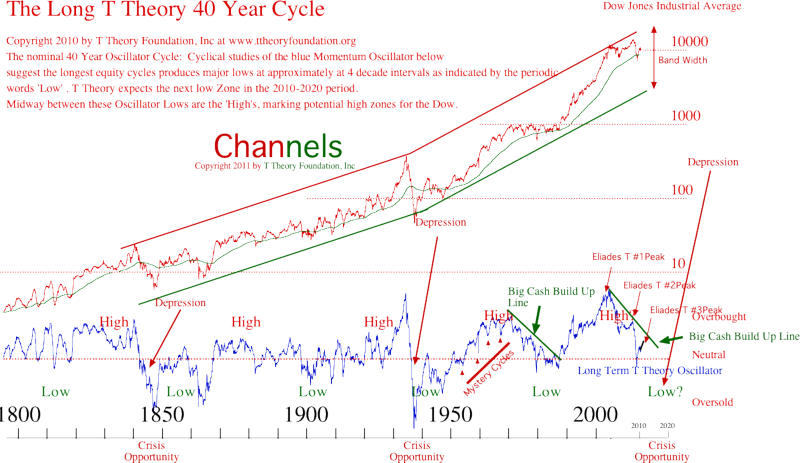
Listen to Terry’s commentary for the long term Channels below via the Audio commentary
Download TTOAudio20110320B
while watching the chart
Download LongWaveCyclesUpdate20110318pdf
—————————————————————————————————————————
———————————————————————–
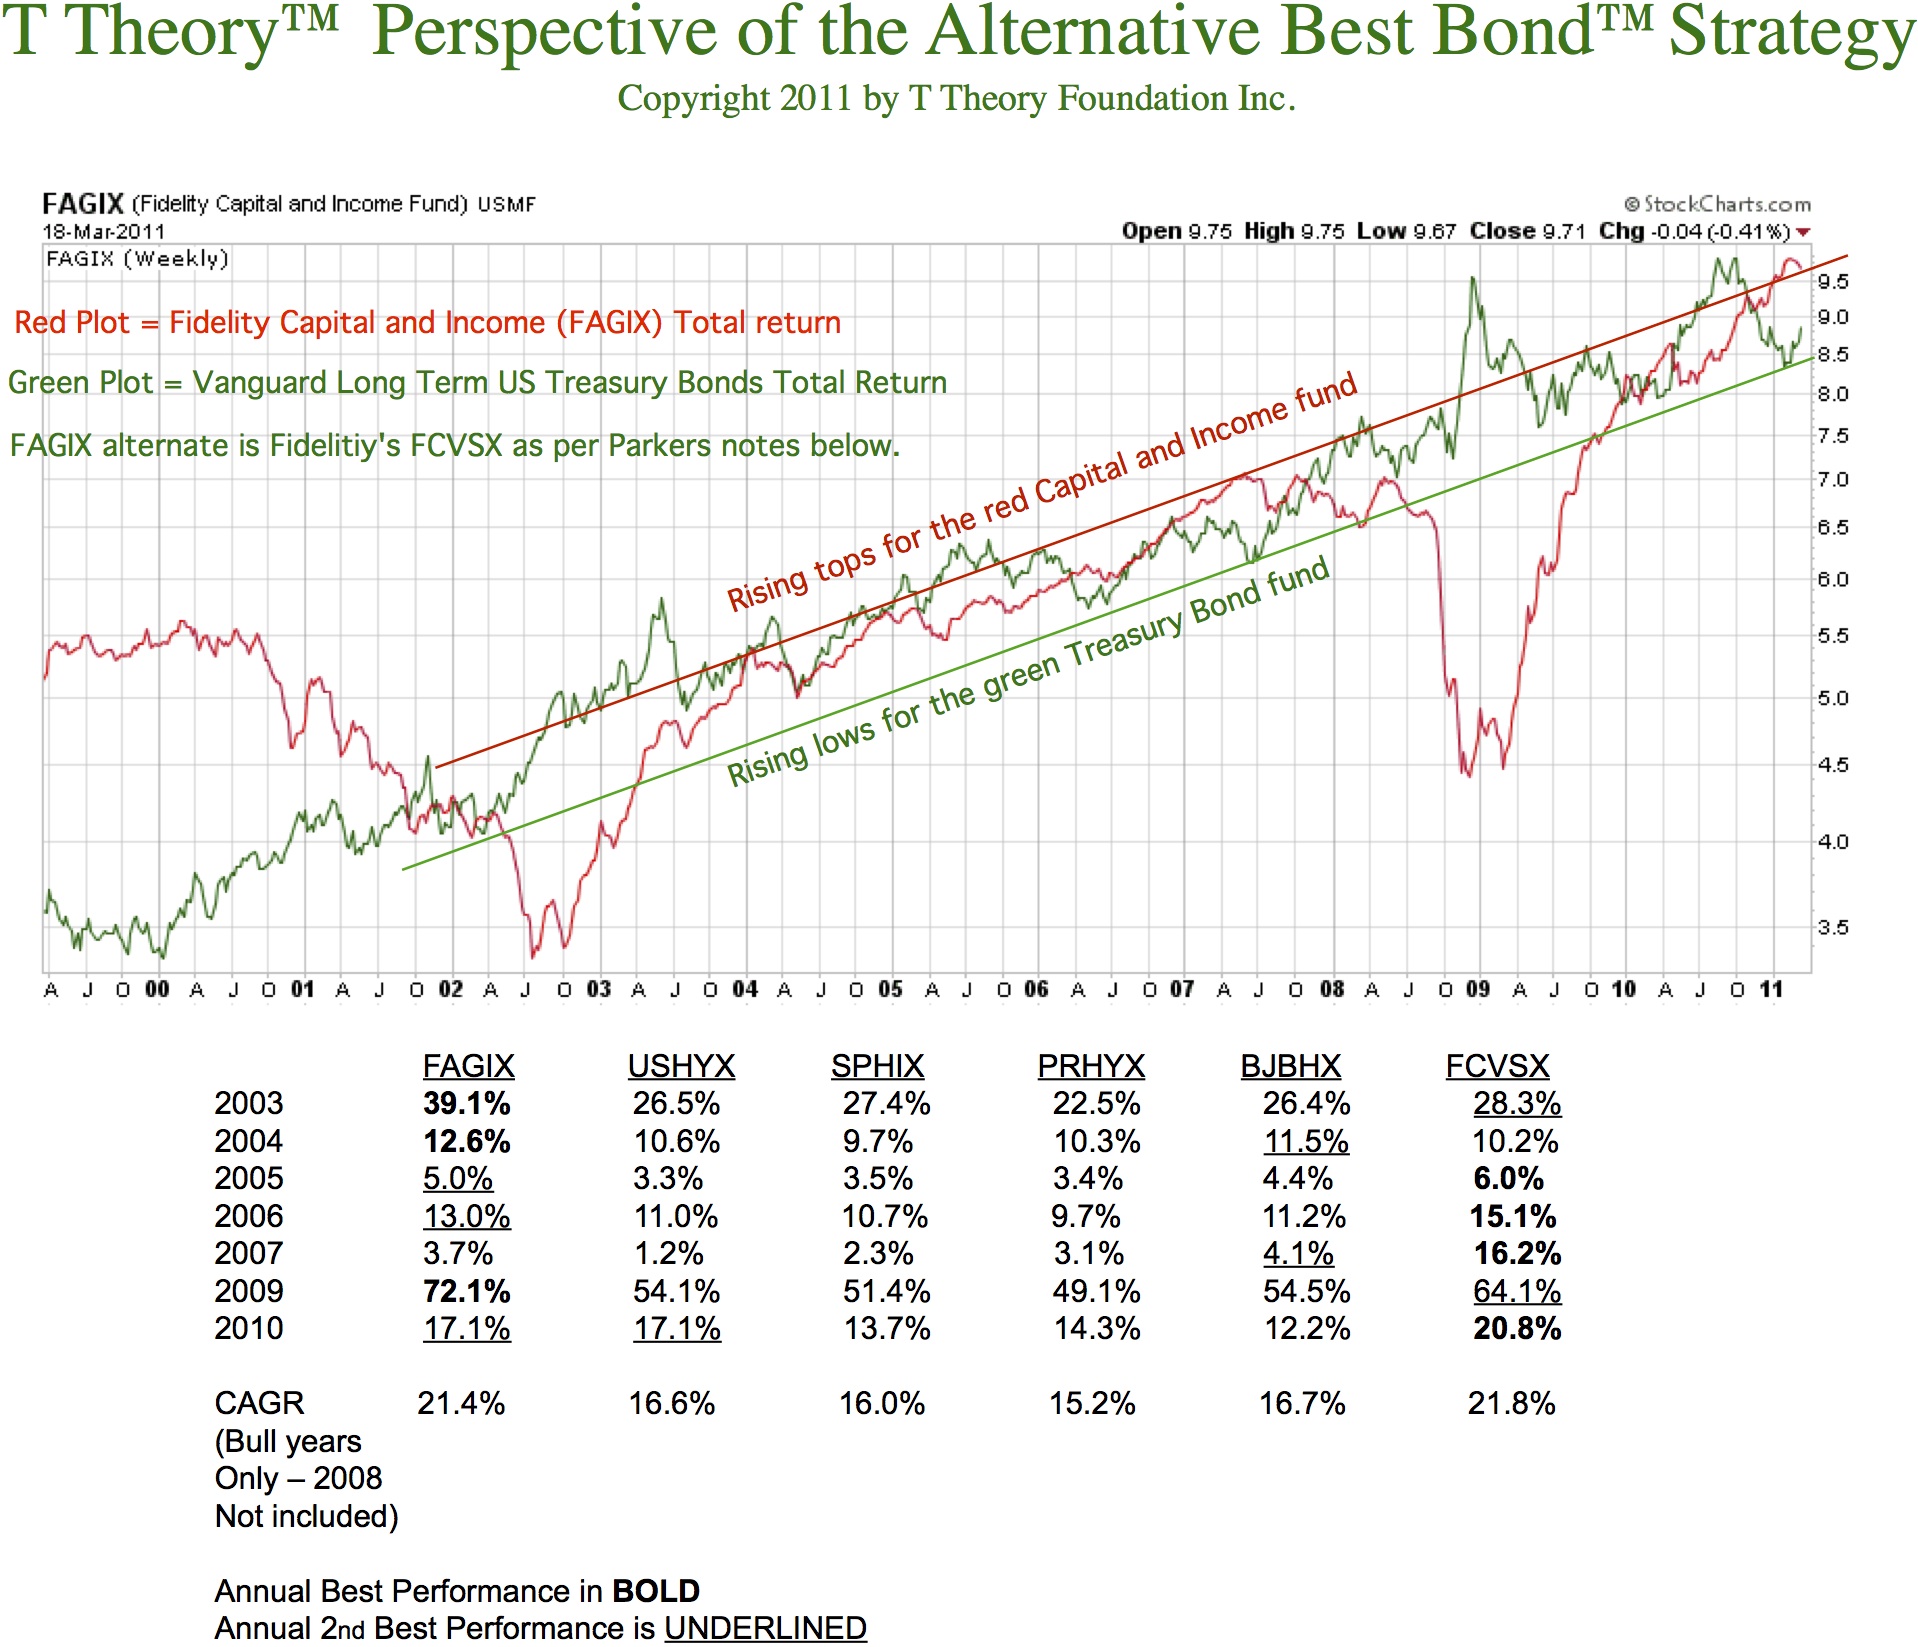
A new T Theory™ Perspective of the Best Bond™ strategy
Listen to the Audio Commentary
Download TTOAudio20110320C
while viewing either the PDF file
Download FAGIXvsVUSYX11years20110318 pdf
————————————————————————————————–
Projecting the May-June Top, Part 2
By Parker Binion
March 20, 2011
Last week , we kicked off the series by examining the 14-week cycle tops which projected a top on or about May 24, 2011. This week, we’ll investigate a natural cycle which, as I discovered, is reproducing itself in the stock market. See my recent post for March 6th below for Part 1
Please consider the following two charts:
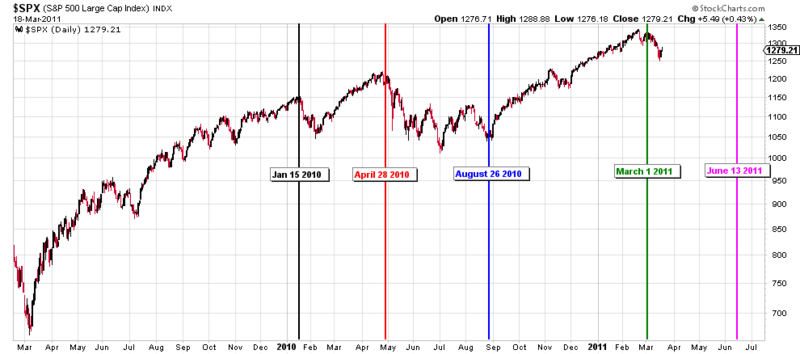
To summarize the color-coded lines:
Color Chart 1 Date Chart 2 Date
Black October 11, 2007 January 15, 2010
Red January 22, 2008 April 28, 2010
Blue May 19, 2008 August 26, 2010
Green November 20, 2008 March 1, 2011
Pink March 9, 2009 June 13, 2011
The first thing each set of lines has in common is this: they are exactly 571 trading days apart.
The second thing each set of lines has in common is they represent important turning points:
Color Chart 1 Chart 2
Black Top Top
Red Bottom Top
Blue Top Bottom
Green Bottom Top
Pink Bottom ??
As you can see, except for the black pair of lines, the other turning points have been opposite each other. 571 days later, bottoms become tops and tops become bottoms. If this 571 day cycle holds true, then the pink line on June 13, 2011 will be at or near an important top.
The last thing these set of lines has in common is that they all represent the Golden Ratio (1.618 to 1) when compared to the length of the 2007-09 downtrend. It took 353 trading days to fall from the October 11, 2007 peak to the March 9, 2009 trough. 571 divided by 353 is 1.618. The Golden Ratio which appears in nature seems to be reproducing itself in the stock market.
Next week, we’ll examine top projections based on Money Flow Ts™. Until then, use caution in your investments and manage your risk wisely.
Listen to Terry’s mp3 Audio commentary
Download TTOAudio2010313
while looking at the PDF Daily Chart
Download DailyChart20110311pdf
Projecting the May-June Top, Part 1
By Parker Binion
March 13, 2011
This article will be the first in a series examining the evidence for a projected top in the May-June 2011 time frame.
On February 6, 2011 (see the archives below), I wrote about the 14-week cycle tops. I warned “to be prepared for a change in investor sentiment coming in the next week or two.” As we know, the S&P topped on February 18, 2011 at 1344, and has been consolidating/correcting ever since.
This week, let’s revisit the chart of 14-week cycle tops:

As you can see, this cycle suggests the next top will come on or about May 24, 2011.
In future weeks, we’ll examine projections based on Money Flow Ts™, Volume Oscillator Ts, and the ringing of a 114-week cycle. Until then, use caution in your investments and manage your risk wisely.
Parker B. Binion
Director of Strategic Planning
T Theory Foundation, Inc.
Peter Eliades Advance Decline chart below
Download TTOAudio20110306A
while looking at the PDF Daily Chart
Download DailyChart20110304pdf
Peter Eliades Advance Decline chart below with Terry’s Commentary
Download TTOAudio20110306B
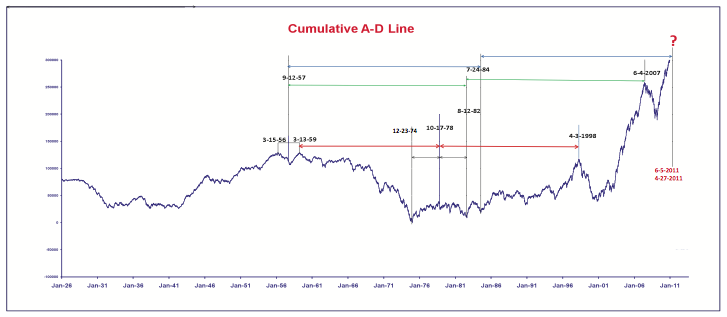
Longer Range Advance-Decline T Analysis by Peter Eliades
Peter Eliades March Newsletter
Download SMCMarch.indd
Audio for Feb 27 Notes
Download NotesAudio20110227
Christopher’s Email to Terry
Is there a possibility that a longer time frame T could be drawn from March 2009, using May 2010 as a center post? This would end around July this year.
I must thank you for all your work as your T Theory has become the backbone for all my trading.
Regards, Christopher
Email your T Theory related questions (only) to this address:
Terrence Laundry <ttheory.foundation@me.com>
—————————–
Parker says,
Terry asked for a time symmetry starting from the March 2009 low with a mid point at the summer 2010 low to project the next cycle low.
If you use the July 2, 2010 low as the mid point, the next cycle low projects to be: October 25, 2011
If you use the August 30, 2010 low as the mid point, the next cycle low projects to be: February 20, 2012
Parker B. Binion
Director of Strategic Planning
—————————————
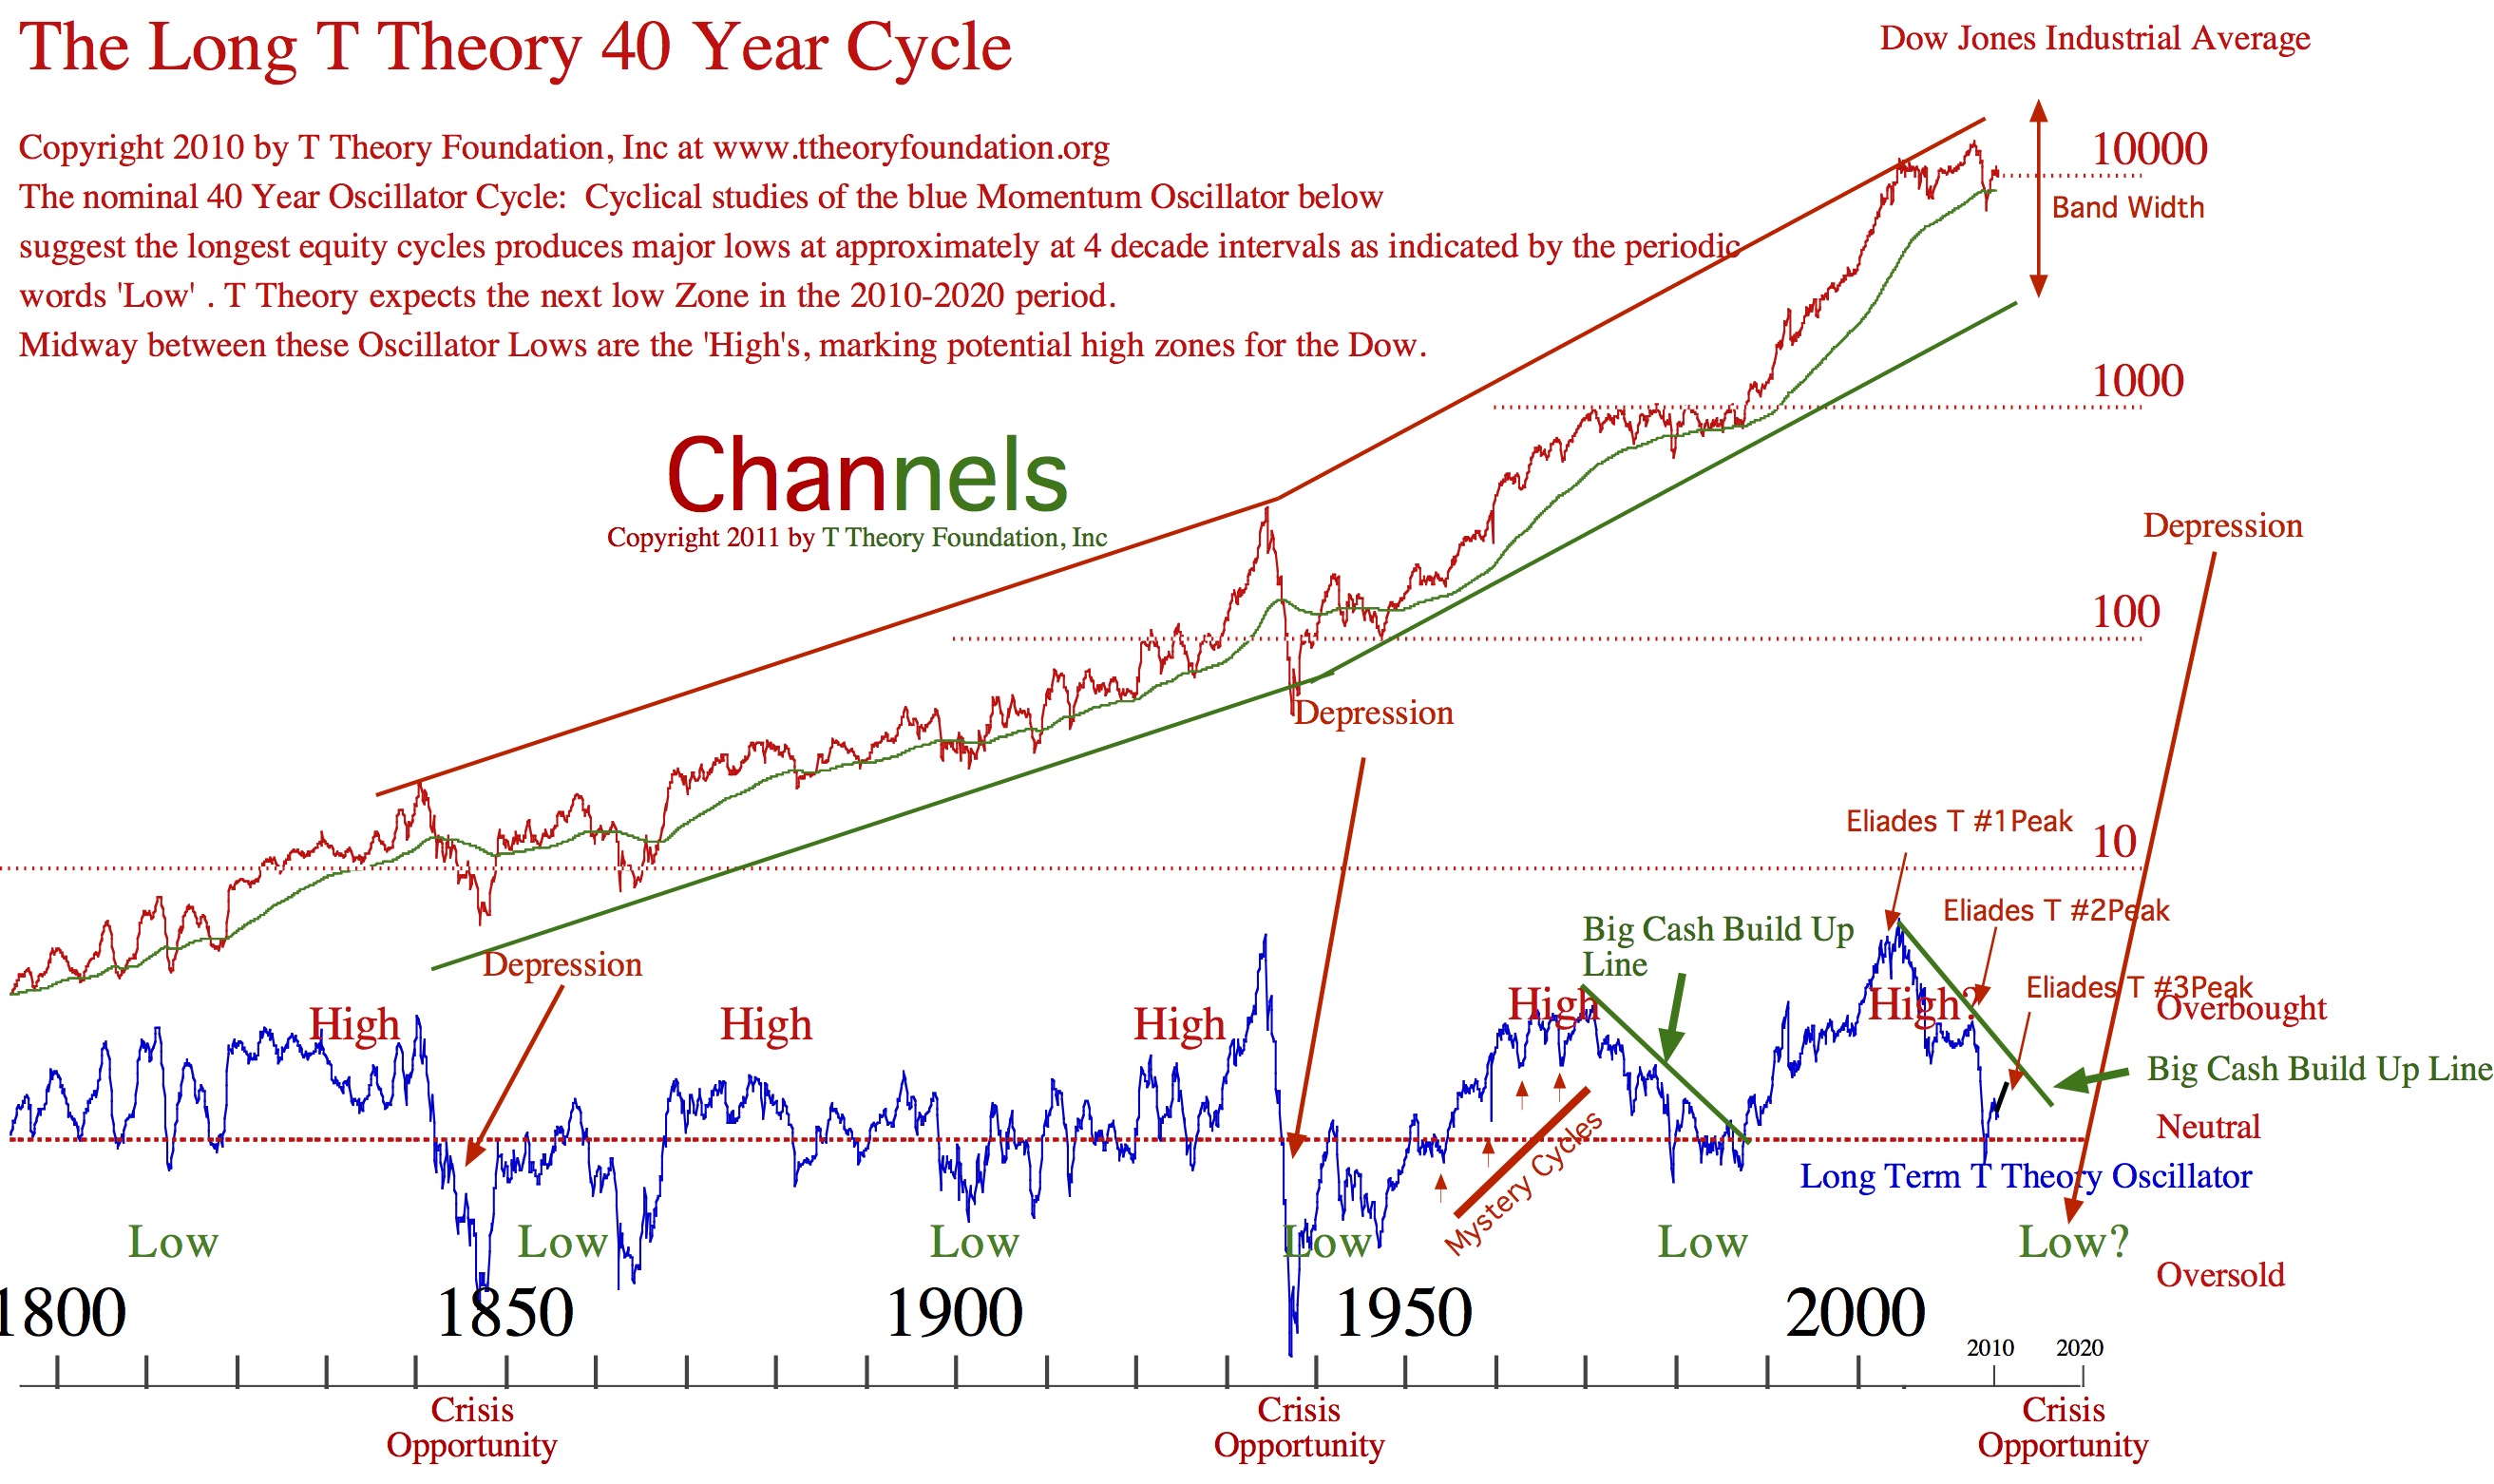
Peter E. thinks there is a big Advance Decline T with left end at 1958, and two possible T center post lows in early 1980’s (1982 low and 1984 low). The first possible T has projected the 2007 peak correctly and the later 1984 low now projects at peak anywhere from late April 2011 to mid June 2011.
——————————-
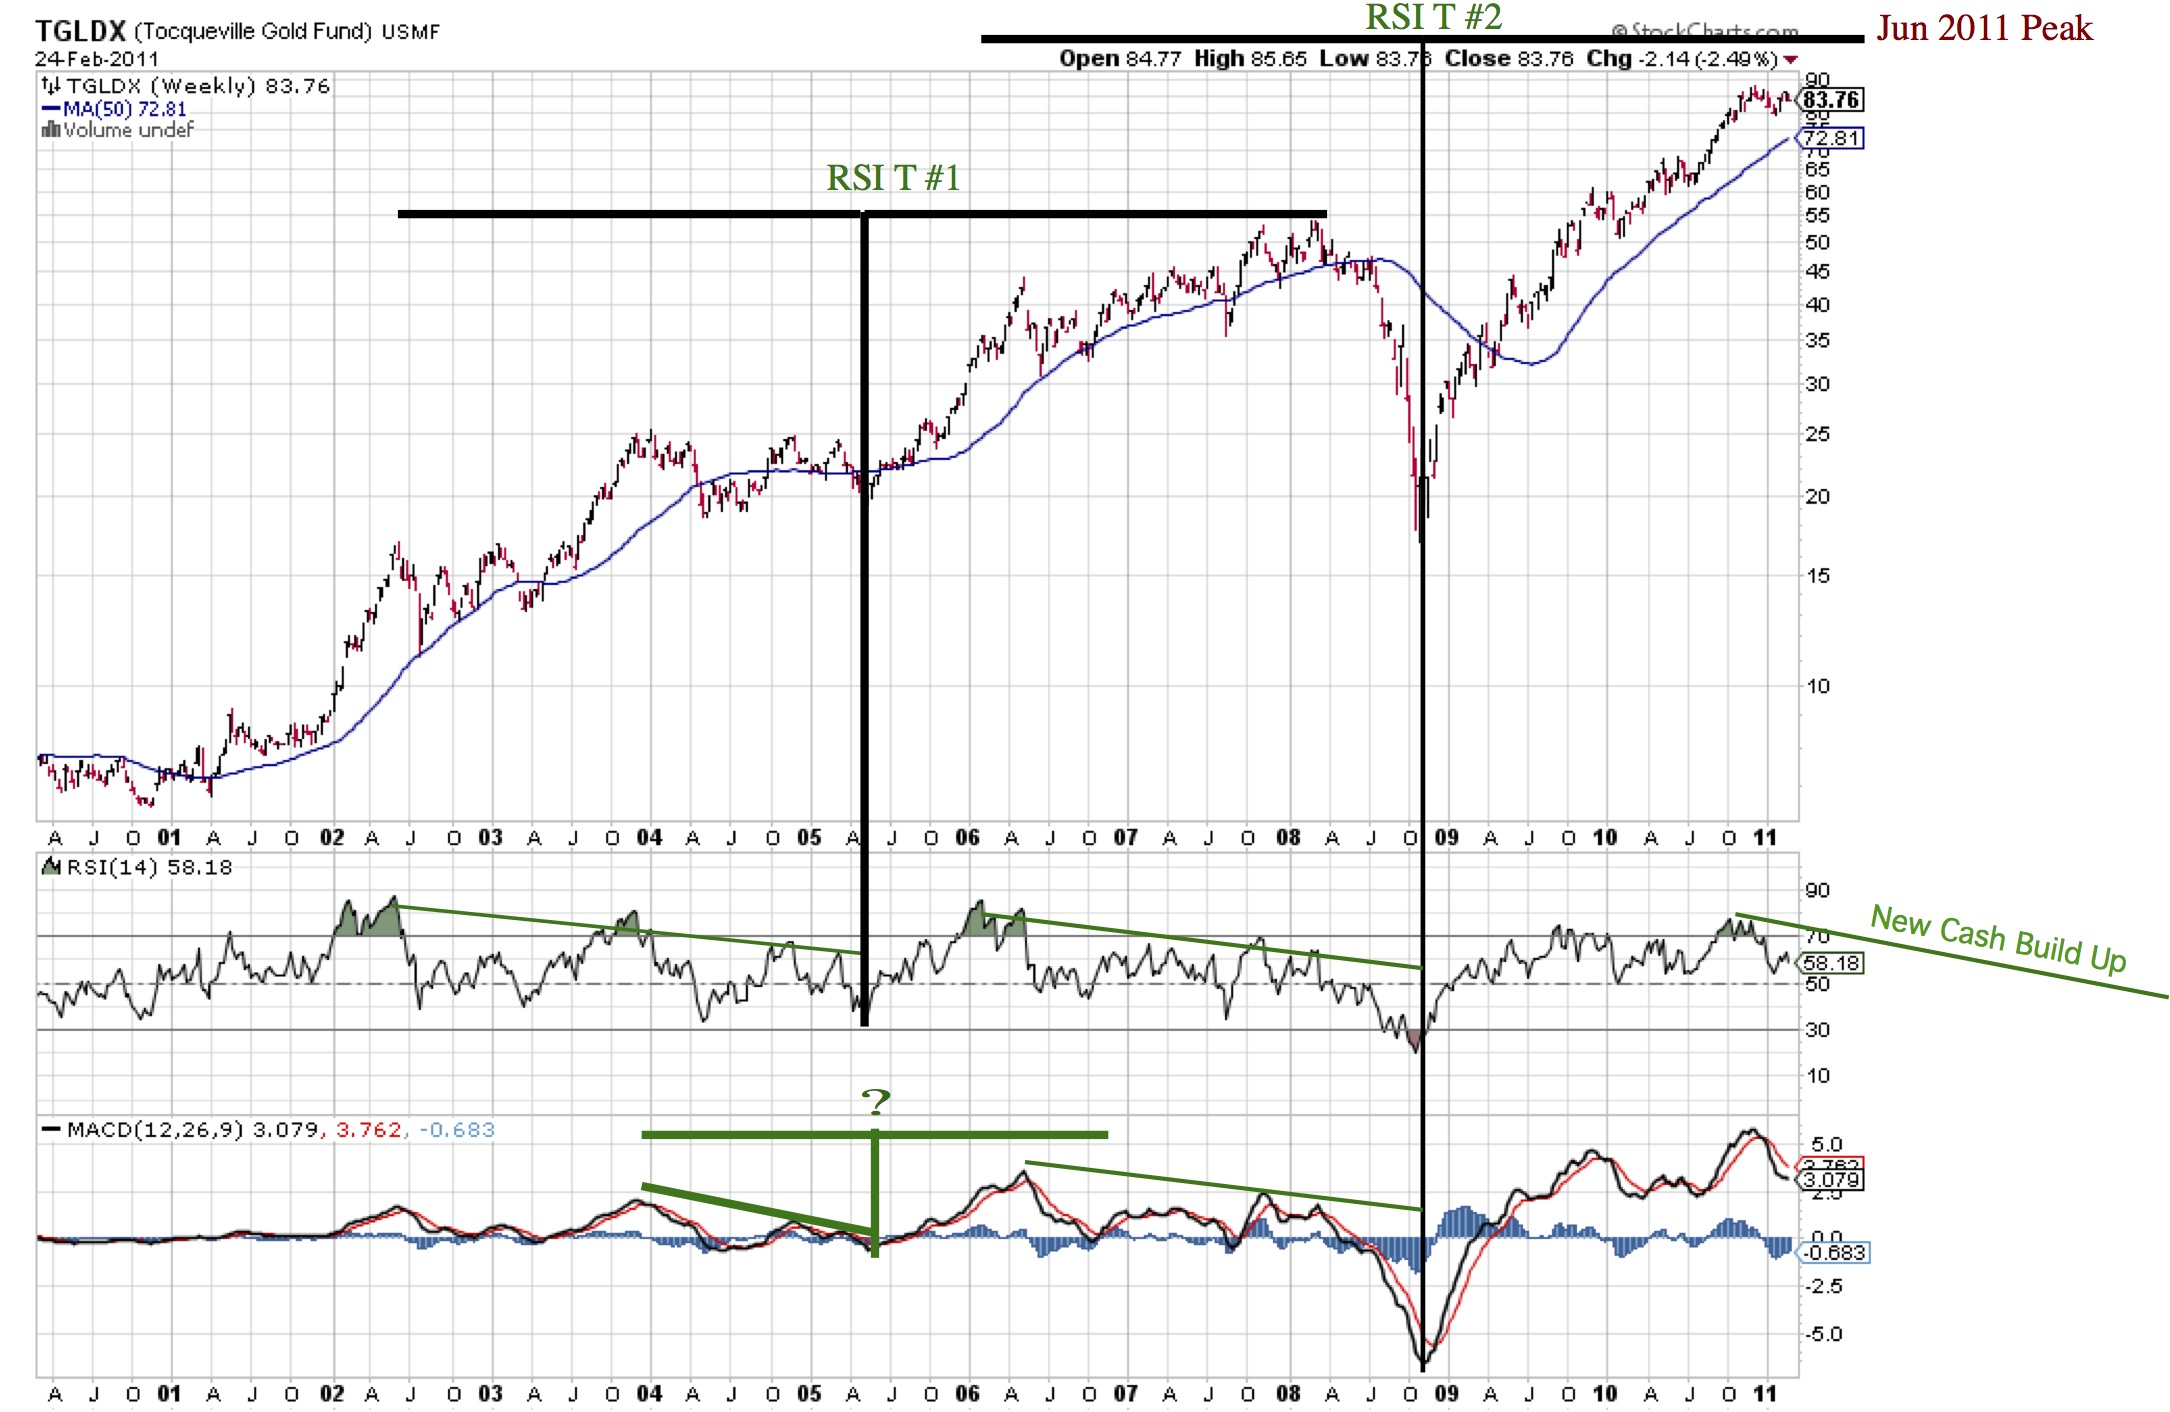
Terry thinks Peter E. is more likely to be right since it agrees with the current Volume Oscillator number 3 (May 1) and the Tocqueville Gold (mining stock) T which projects a major top in June 2011 from the major 2008 low.
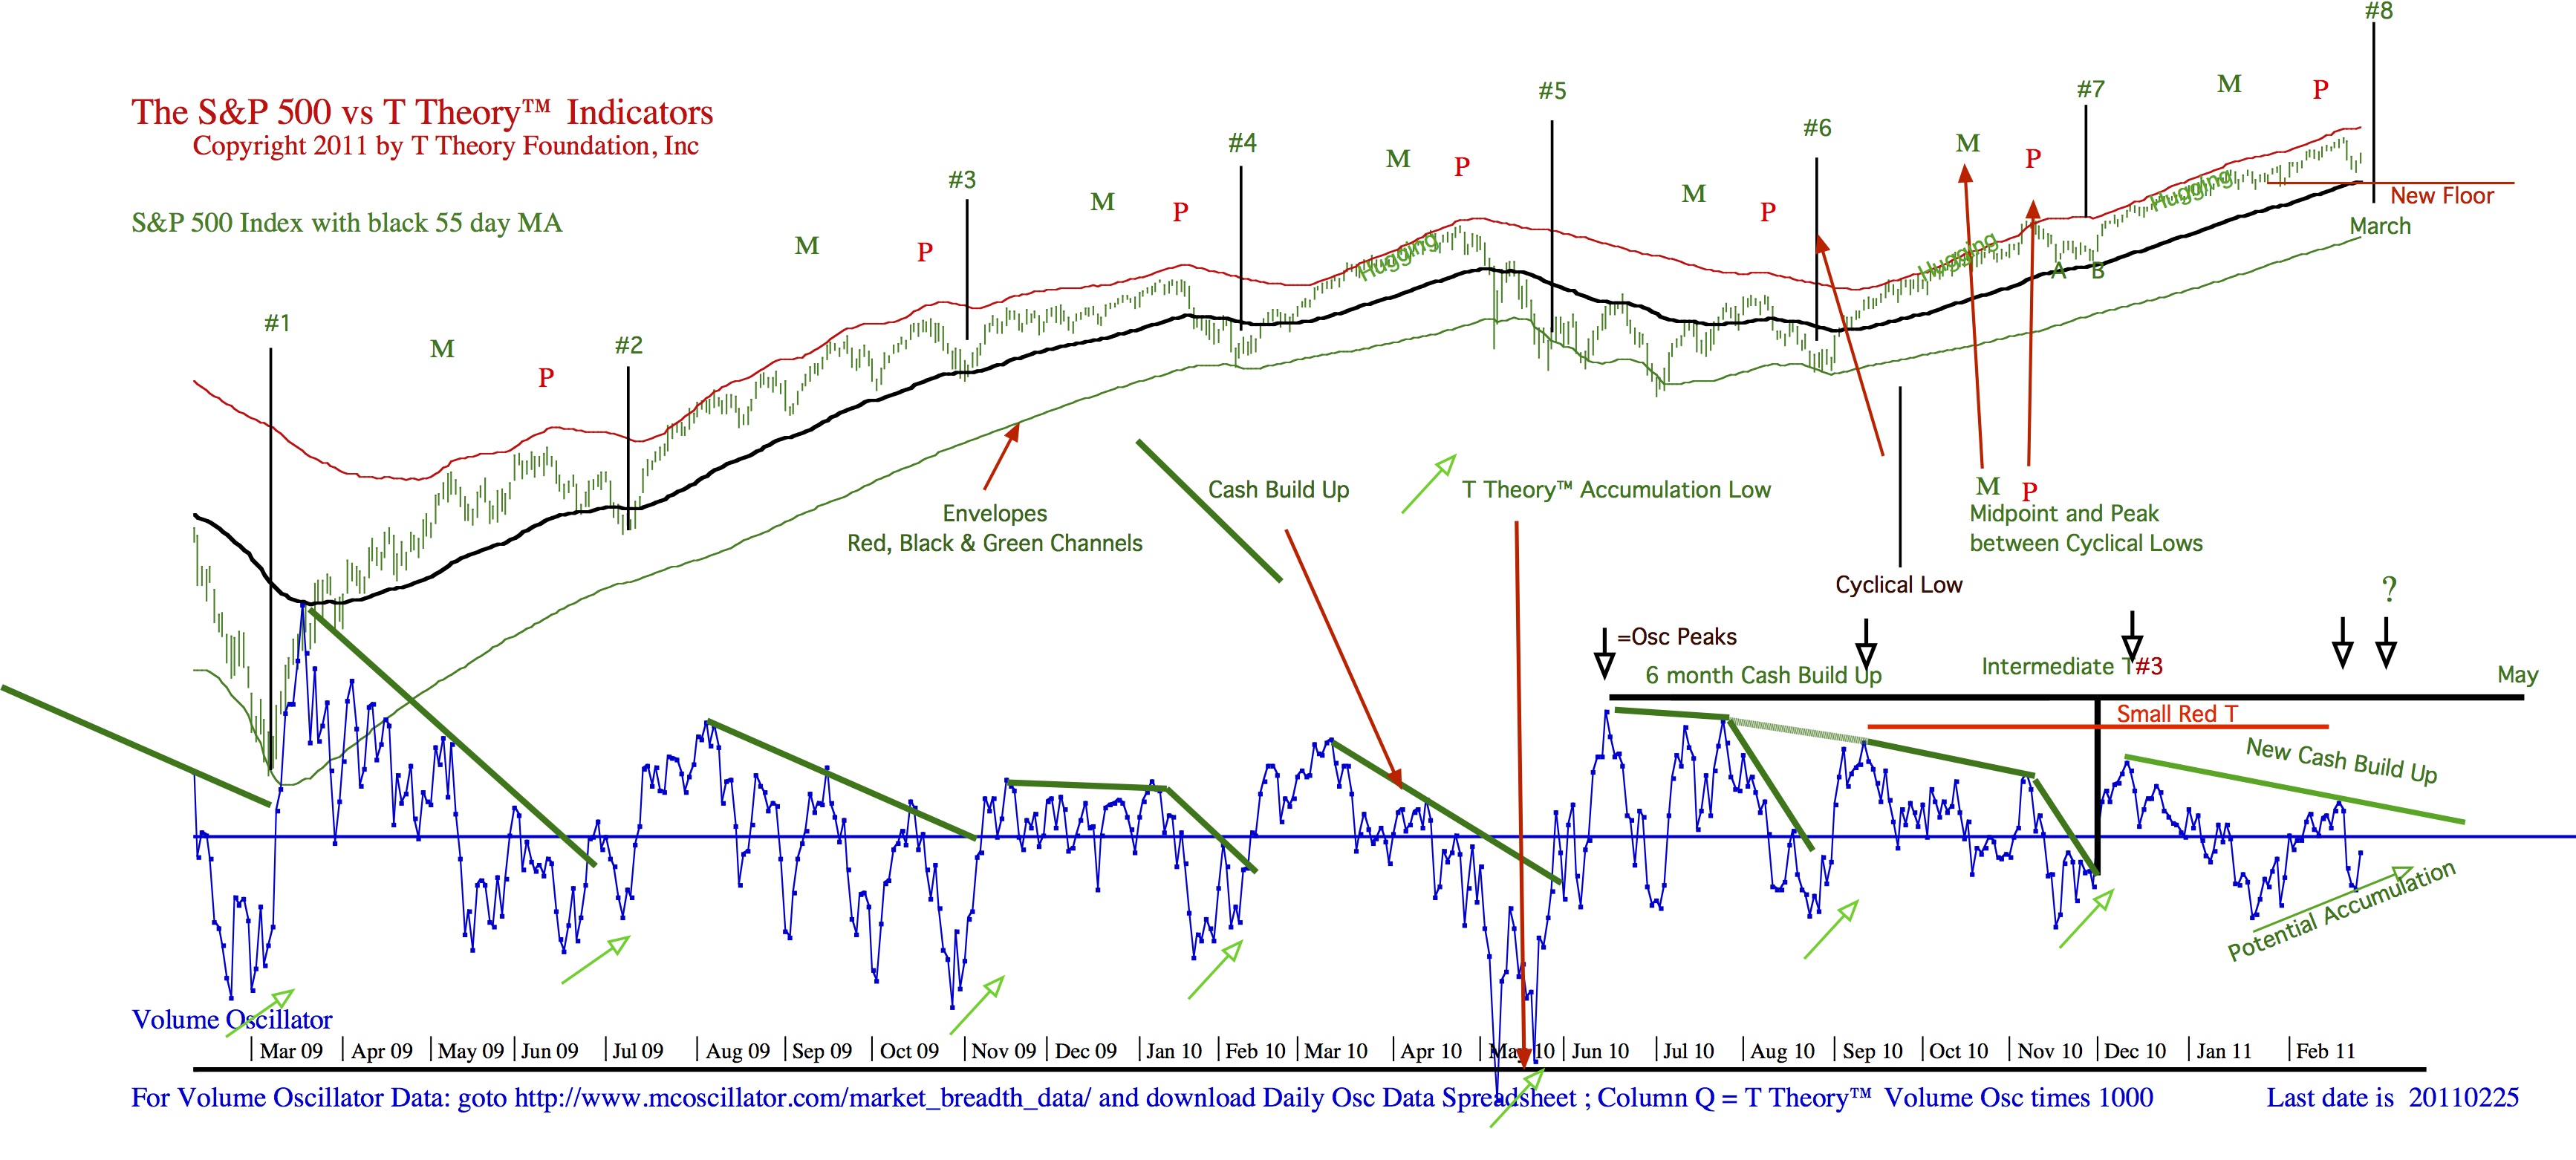
T Theory™ Forecast for the S&P 500
Download TTOAudio20110227B
while looking at the PDF Daily Chart
Download DailyChart20110225pdf
Longer Range TGLDX Gold T Outlook
Download TTOAudio 20110227C
while looking at the PDF Gold Chart
Download TGLDXWK20110224pdf
****************************************************************************************
All Rights Reserved By The T Theory® Foundation ©
Order the T Theory® Encyclopedia
For a complete understanding of the T Theory® and how to successfully use Terry’s unique methods, order the Encyclopedia from Paula at the above link. There is additional material in the encyclopedia not covered here. Paula will be more than happy to answer your questions too.
Many thanks to Paula Burke for her permission to re-post Terry’s old T Theory® explanations. The period re-blogged on these pages are some of Terry Laundry’s best work and was published here from public domain.
****************************************************************************************
I claim no credit for the material found under T Theory® on this blog. All of this material is the creation of Terry Laundry and was downloaded from Terry’s free blog site (TypePad). I have created a mirror of Terry’s original material and now there is a second site containing Terry’s T Theory®. One or both of these websites hopefully will survive through time as Terry’s material is too important to be lost to the ravages of time. This site is simply a memorial to his lifetime work.
The page content re-blogged here is exactly as Terry created on his original webpages (saved on my computer with ScrapBook)). Nothing has been left out from the period Dec 2003 to June 2011. From Terry’s site, I made a lot of formatting changes, creating a more easily readable webpage appearance. The PDF chart duplicates of the JPEGs have been omitted for ease and speed of recreating Terry’s pages. References to PDF charts should be ignored (but no chart was left out).
After June 2011, Terry created a paid subscription website. None of that material is found here.
There were many many, many hours spent on this project; downloading Terry’s individual charts & audio files, followed by the uploading of Terry’s charts and audio to my WordPress blog library, after which I had to insert the uploaded material into my new T Theory® webpages (hopefully in the correct places). This was a dull and arduous project and I hope you enjoy it. I don’t believe there remains any more of Terry’s material in free domain, so my T Theory® project is probably finished. If I’ve missed something, you can leave me a comment.
If you find an uploaded reference error (chart or audio in the wrong place), please note the month and year of the webpage, plus the exact name of the referenced error file. Include any other info that will help me locate the problem file and where it occurs on the webpage. Leave a comment for me with the info and I’ll fix it.
Terry’s material is very long and will take many weeks for you to finish. Don’t hurry, it’s not a marathon and you will absorb more if you go through it at a reasonable rate. This is especially true for those who don’t invest in the T Theory® reference encyclopedia. The encyclopedia is a written reference for T Theory® and includes everything of importance for Terry’s T Theory®. Without the reference encyclopedia you must depend on your memory and Terry’s method carries some rules that you could easily violate. The encyclopedia also includes new information never seen on his website.
You are welcome to save any or all of my blog material to your computer. You also have my permission to re-blog my information, but you must (1) credit me and my blog in an obvious manner and (2) don’t change my material.
FYI – I find the best way to save a webpage is using “ScrapBook” (it’s an add-on for the FireFox browser). ScrapBook saves a webpage to your computer EXACTLY as it appears on the day you saved it. You can’t tell the difference between the internet webpage and your ScrapBook saved webpage. The saved pages are not pictures. Instead the pages consist of HTML and page functionality remains identical on your computer. There is also a second method for using ScrapBook, where you can save all of the webpages down to a defined link depth. This optional method means all links will function on your computer to the link depth specified (meaning you can click on links on your saved webpages and tunnel down into pages within pages). Saving the normal way will only save the top webpage but the links that exist could continue to function by taking you to the website on the internet instead of on your computer. But sometimes the linked website doesn’t exist anymore. I’ve had this happen on some very good webpages with unique information (they just disappear into the internet void). That’s a bummer when you lost some really good info and thus rose my need for ScrapBook. You can also filter the pages saved using the optional ScrapBook method, which can exclude all pages not coming directly from the specified website (filtering is recommended using this method otherwise you wind up with a LOT of useless stuff).
.
Explore posts in the same categories: . . . T Theory®
Leave A Reply