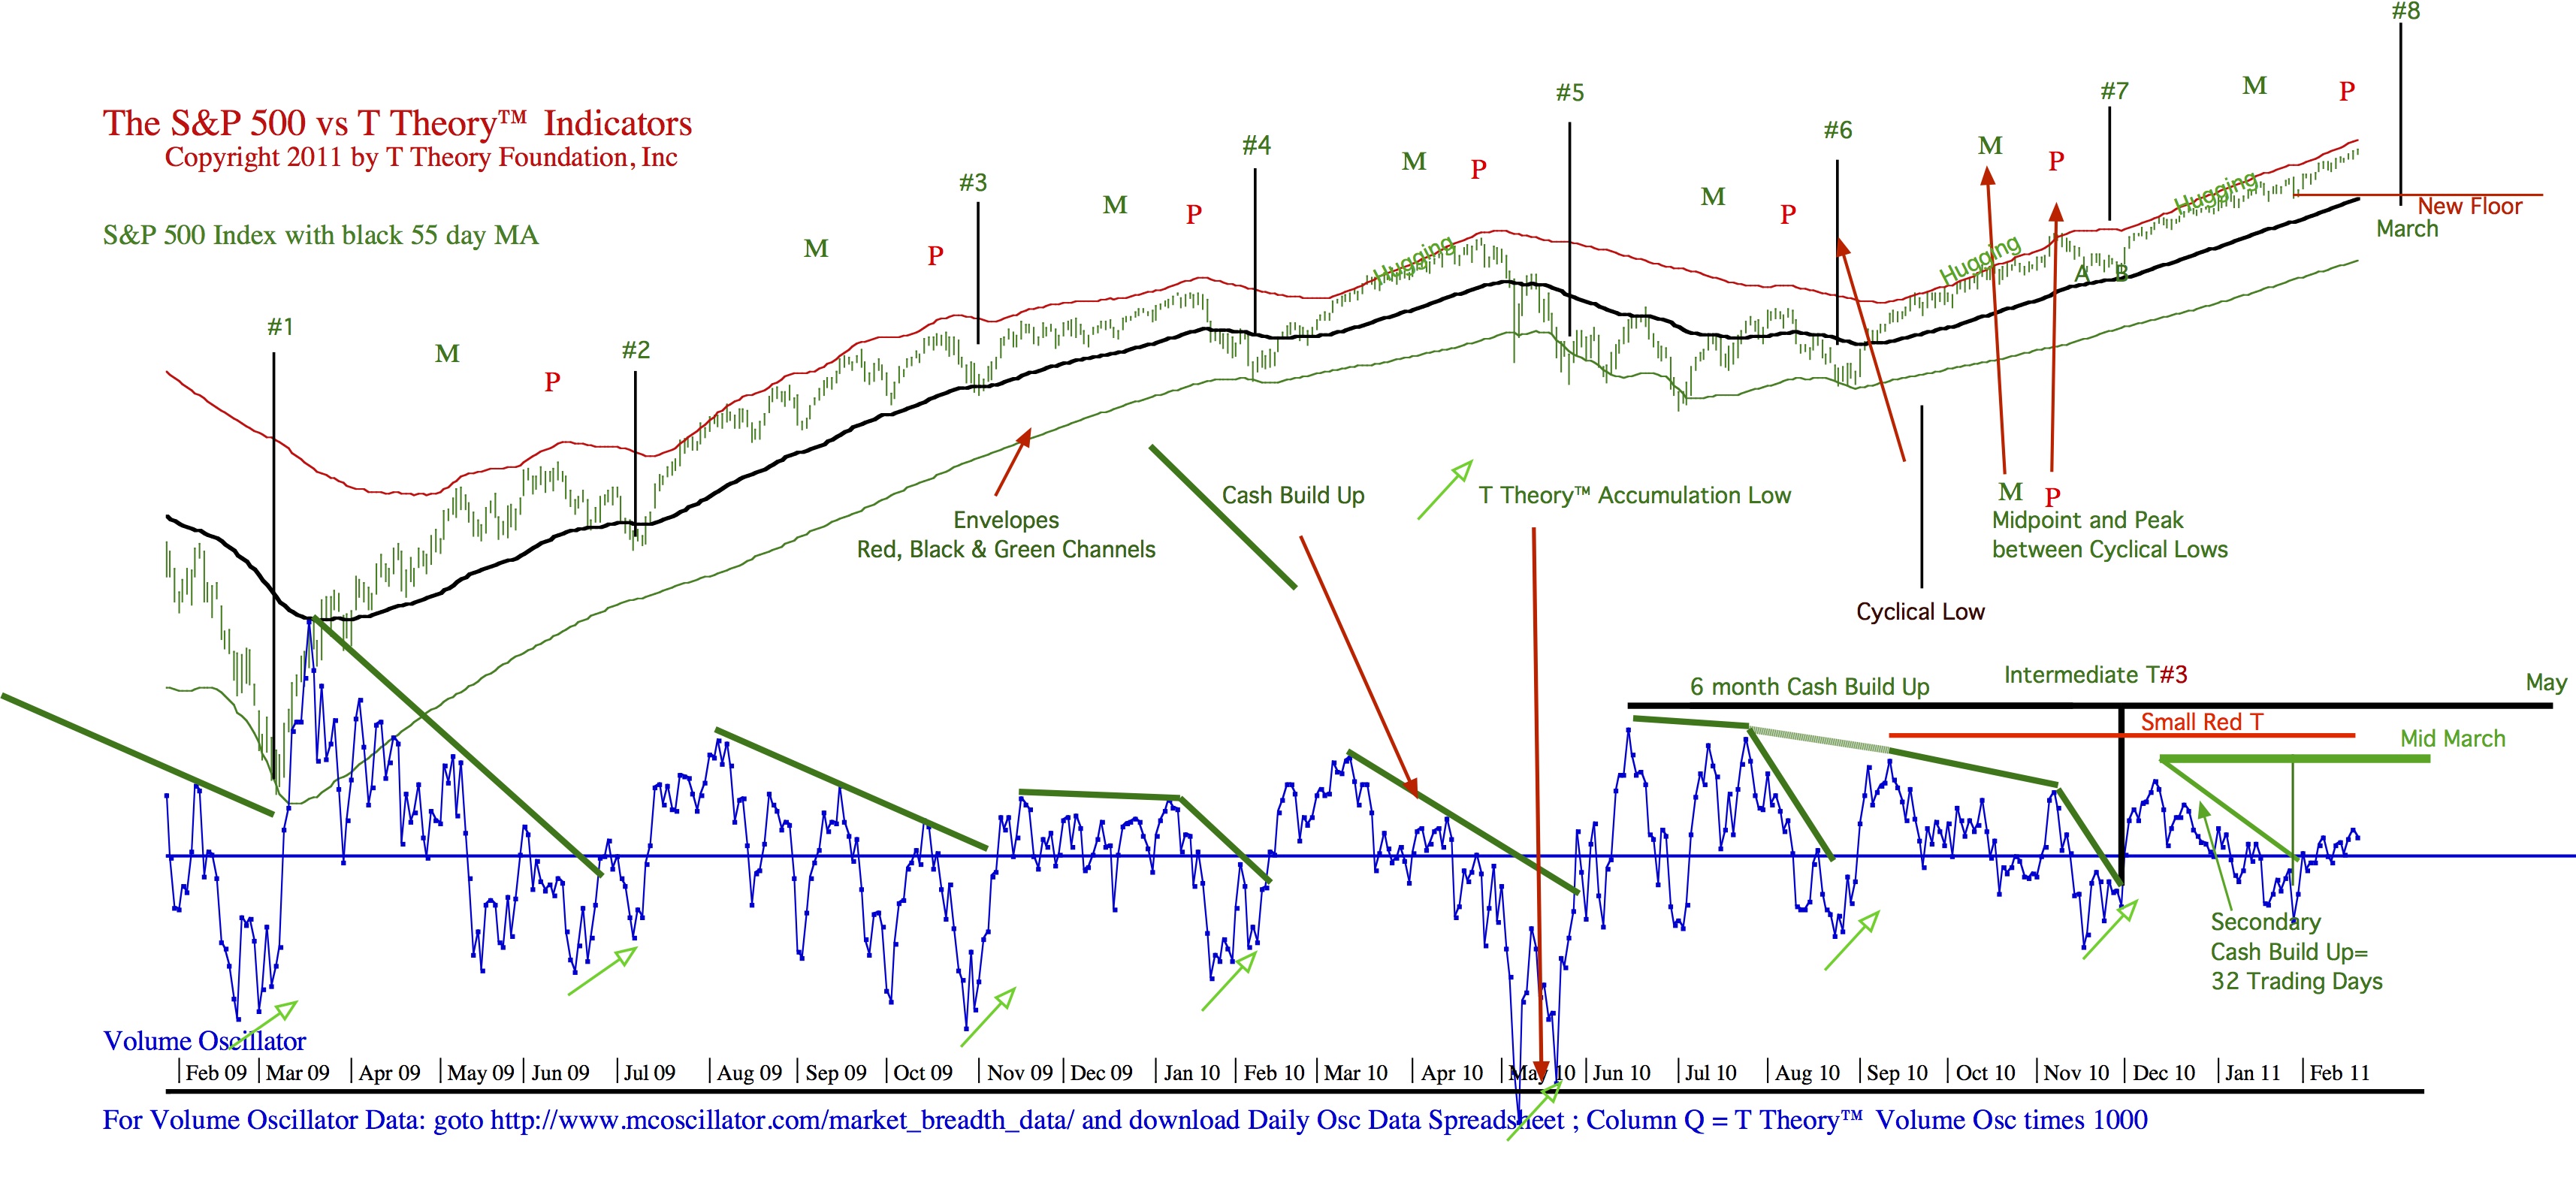
February 2011 – T Theory® Update

February 20 2011
Listen to the mp3 Audio Commentary
Download TTOAudio20110220A
while looking at the PDF Daily Chart
Download DailyChart20110220pdf
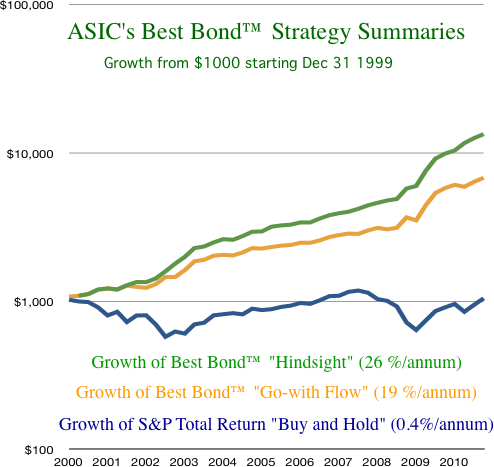
Best Bond™ Strategies
Download TTOAudio20110220B
February 13 2011
Download TTOAudio20110213A
PDF Chart
Download DailyChart20110211pdf
Treasuries and the Coming Correction
By Parker Binion
Sunday, February 13, 2011
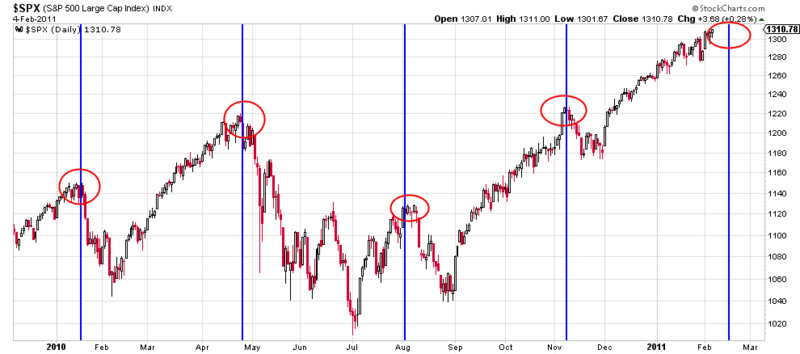
As we have discussed in recent weeks, we expect a topping pattern soon in the S&P 500, culminating perhaps as early as this coming Tuesday. For timing clues, watch for bearish divergence between price and your favorite indicators.
Two of the charts I like to watch are $NYUD and $SPX:$VIX. The first is New York Advance Decline Volume. It showed bearish divergence compared to the S&P 500 at the January 2010, April 2010 and August 2010 tops.
$SPX:$VIX is the S&P 500 divided by the Volatility Index (i.e. fear). If the S&P 500 makes a higher high but the S&P divided by fear makes a lower high, this is a divergence worth watching. While the $NYUD chart is only updated at the end of each trading day, the $SPX:$VIX chart is available on intraday time frames.
Are government bonds an appropriate investment choice during the coming correction phase? The weekly Money Flow T™ on TLT suggests not.
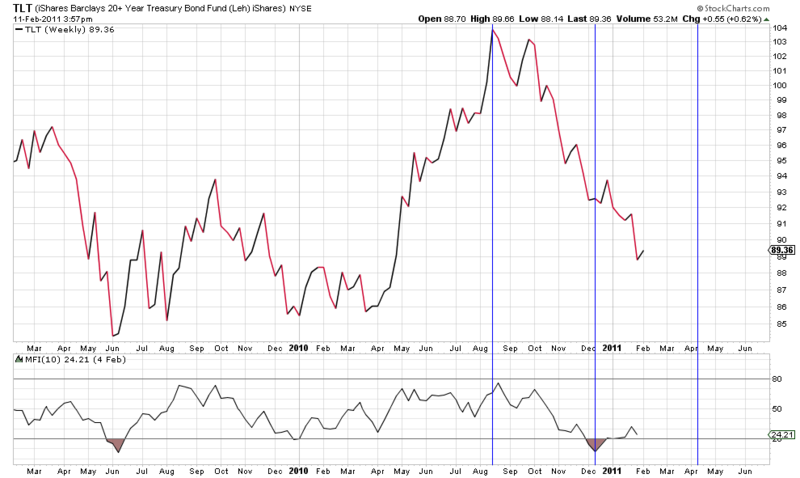
As you can see, the Money Flow T™ expires in early to mid-April. I would not expect TLT to show any sustained strength until after that date.
You may have noticed that I used a 10-period Money Flow Index on this chart. When working with weekly and monthly charts, I find that settings shorter than the standard 14 periods often work better. On any chart, I routinely examine the Money Flow Index from 10 to 15 periods to see where the clearest picture emerges.
T Theory™ Tutorials
t-theory—money-flow-ts-for-sp-symmetries-2011-01-16-1 (1)
t-theory—money-flow-ts-for-gold-and-copper-2011-01-23pdf-1
t-theory—bond-money-flow-ts-and-the-t-theory-confidence-index-2011-01-30
t-theory—14-week-cycle-tops-and-money-flow-ts-suggest-a-mid-february-change-in-sentiment-2011-02-06
t-theory—treasuries-and-the-coming-correction-2011-02-13
February 6 2011
Download TTOAudio20110206A
PDF Chart
Download DailyChart20110204pdf
Download TTOAudio20110206B
14-Week Cycle Tops and Money Flow Ts™ Suggest a Mid-February Change in Sentiment
By Parker Binion
Sunday, February 6, 2011
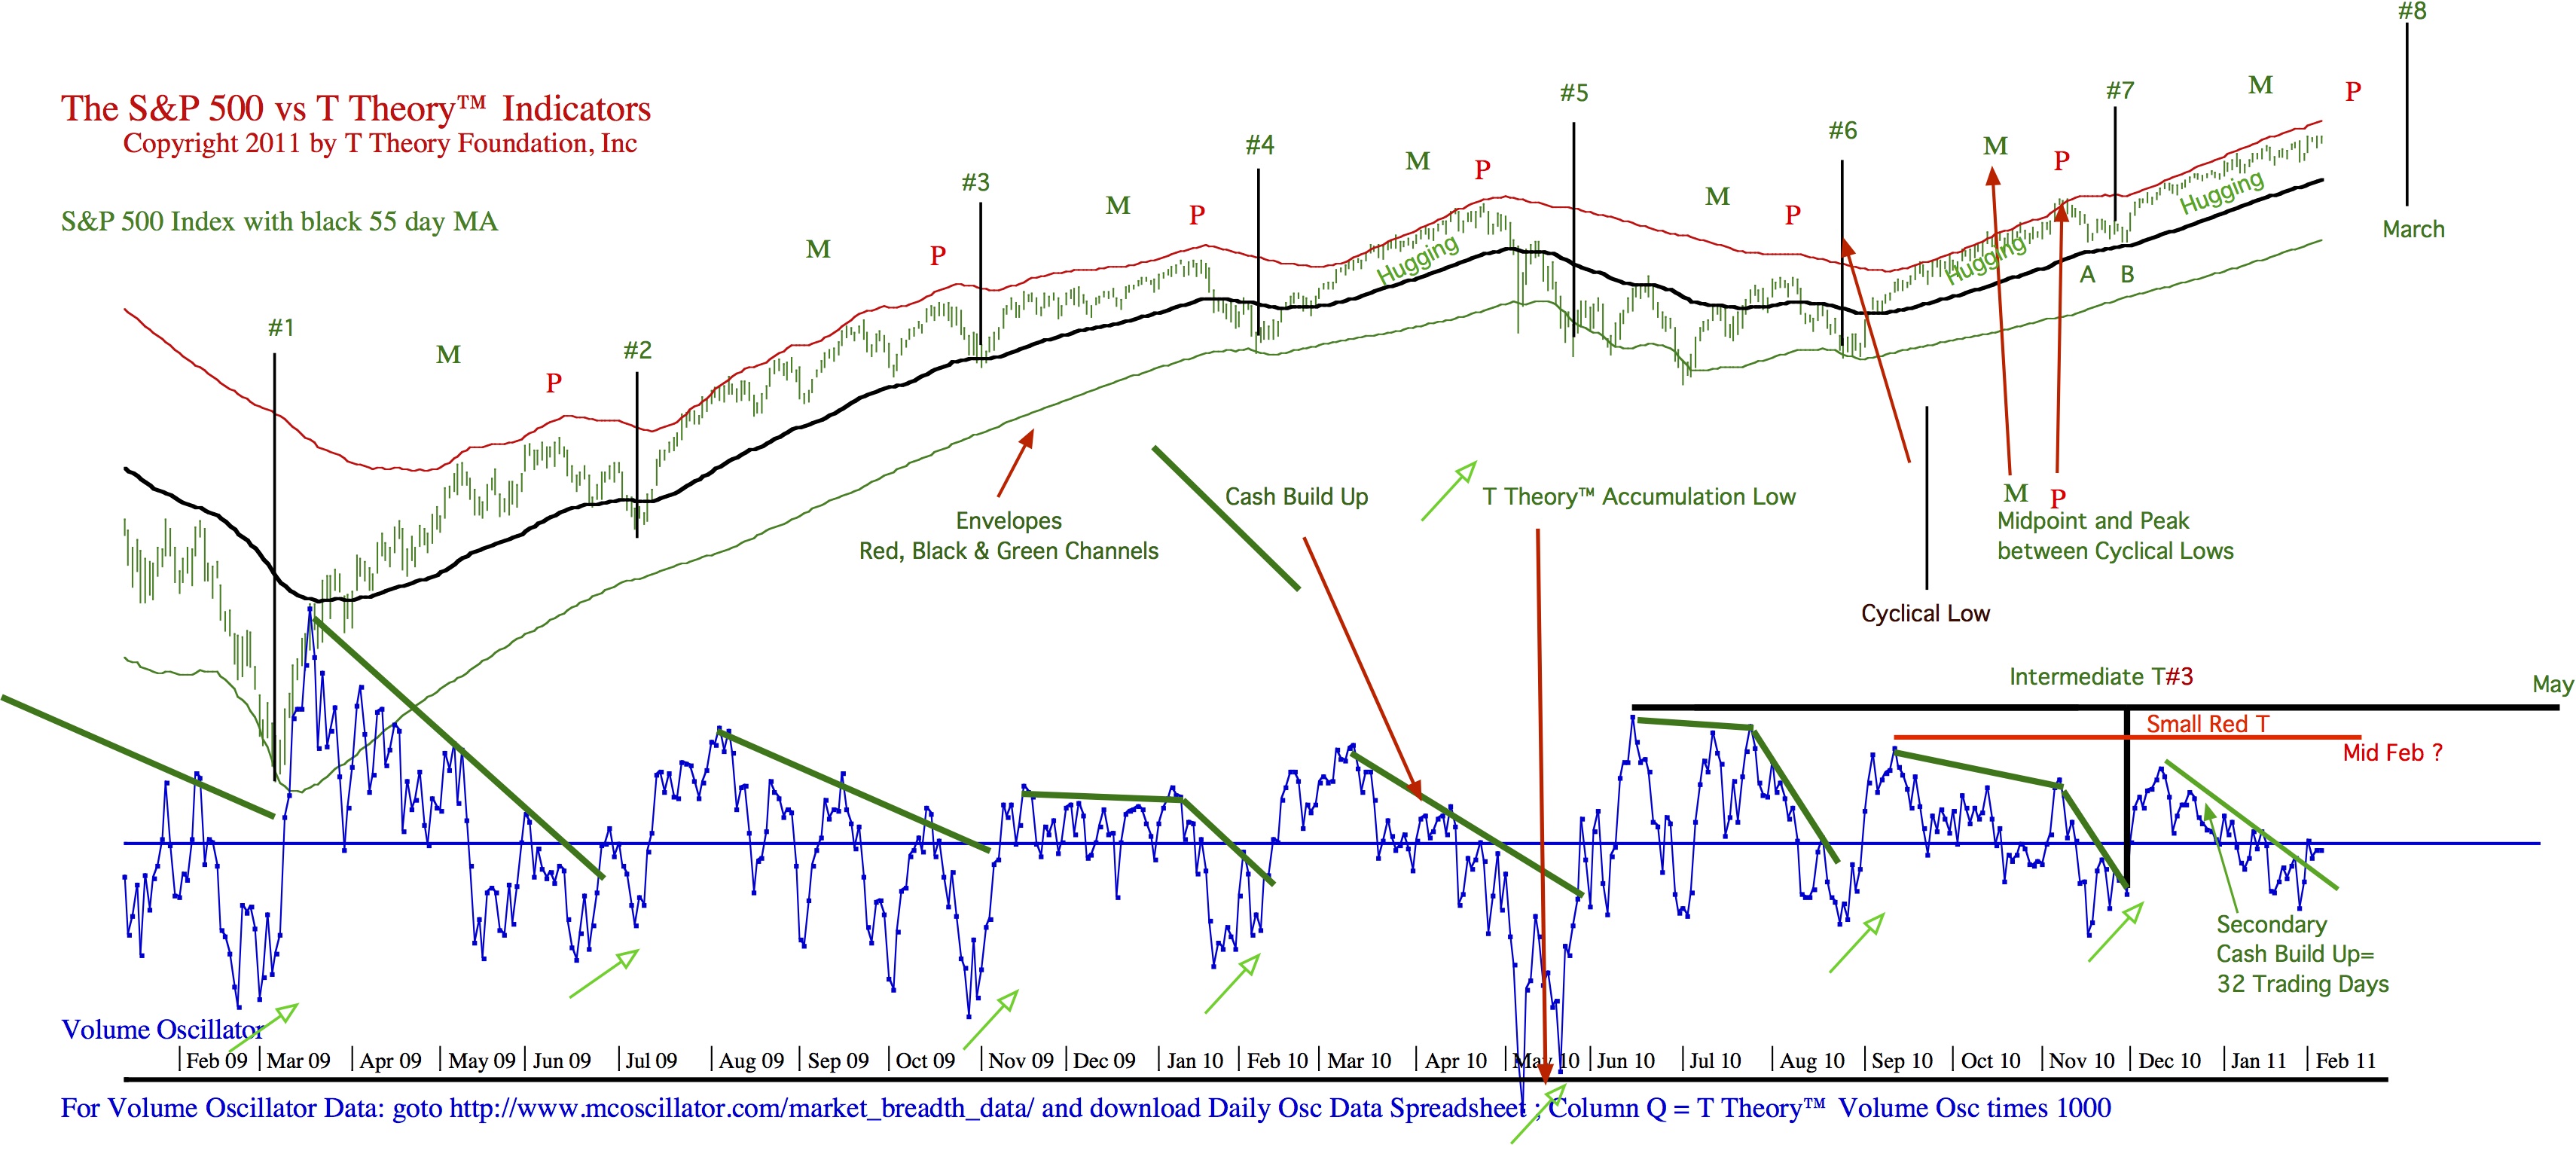
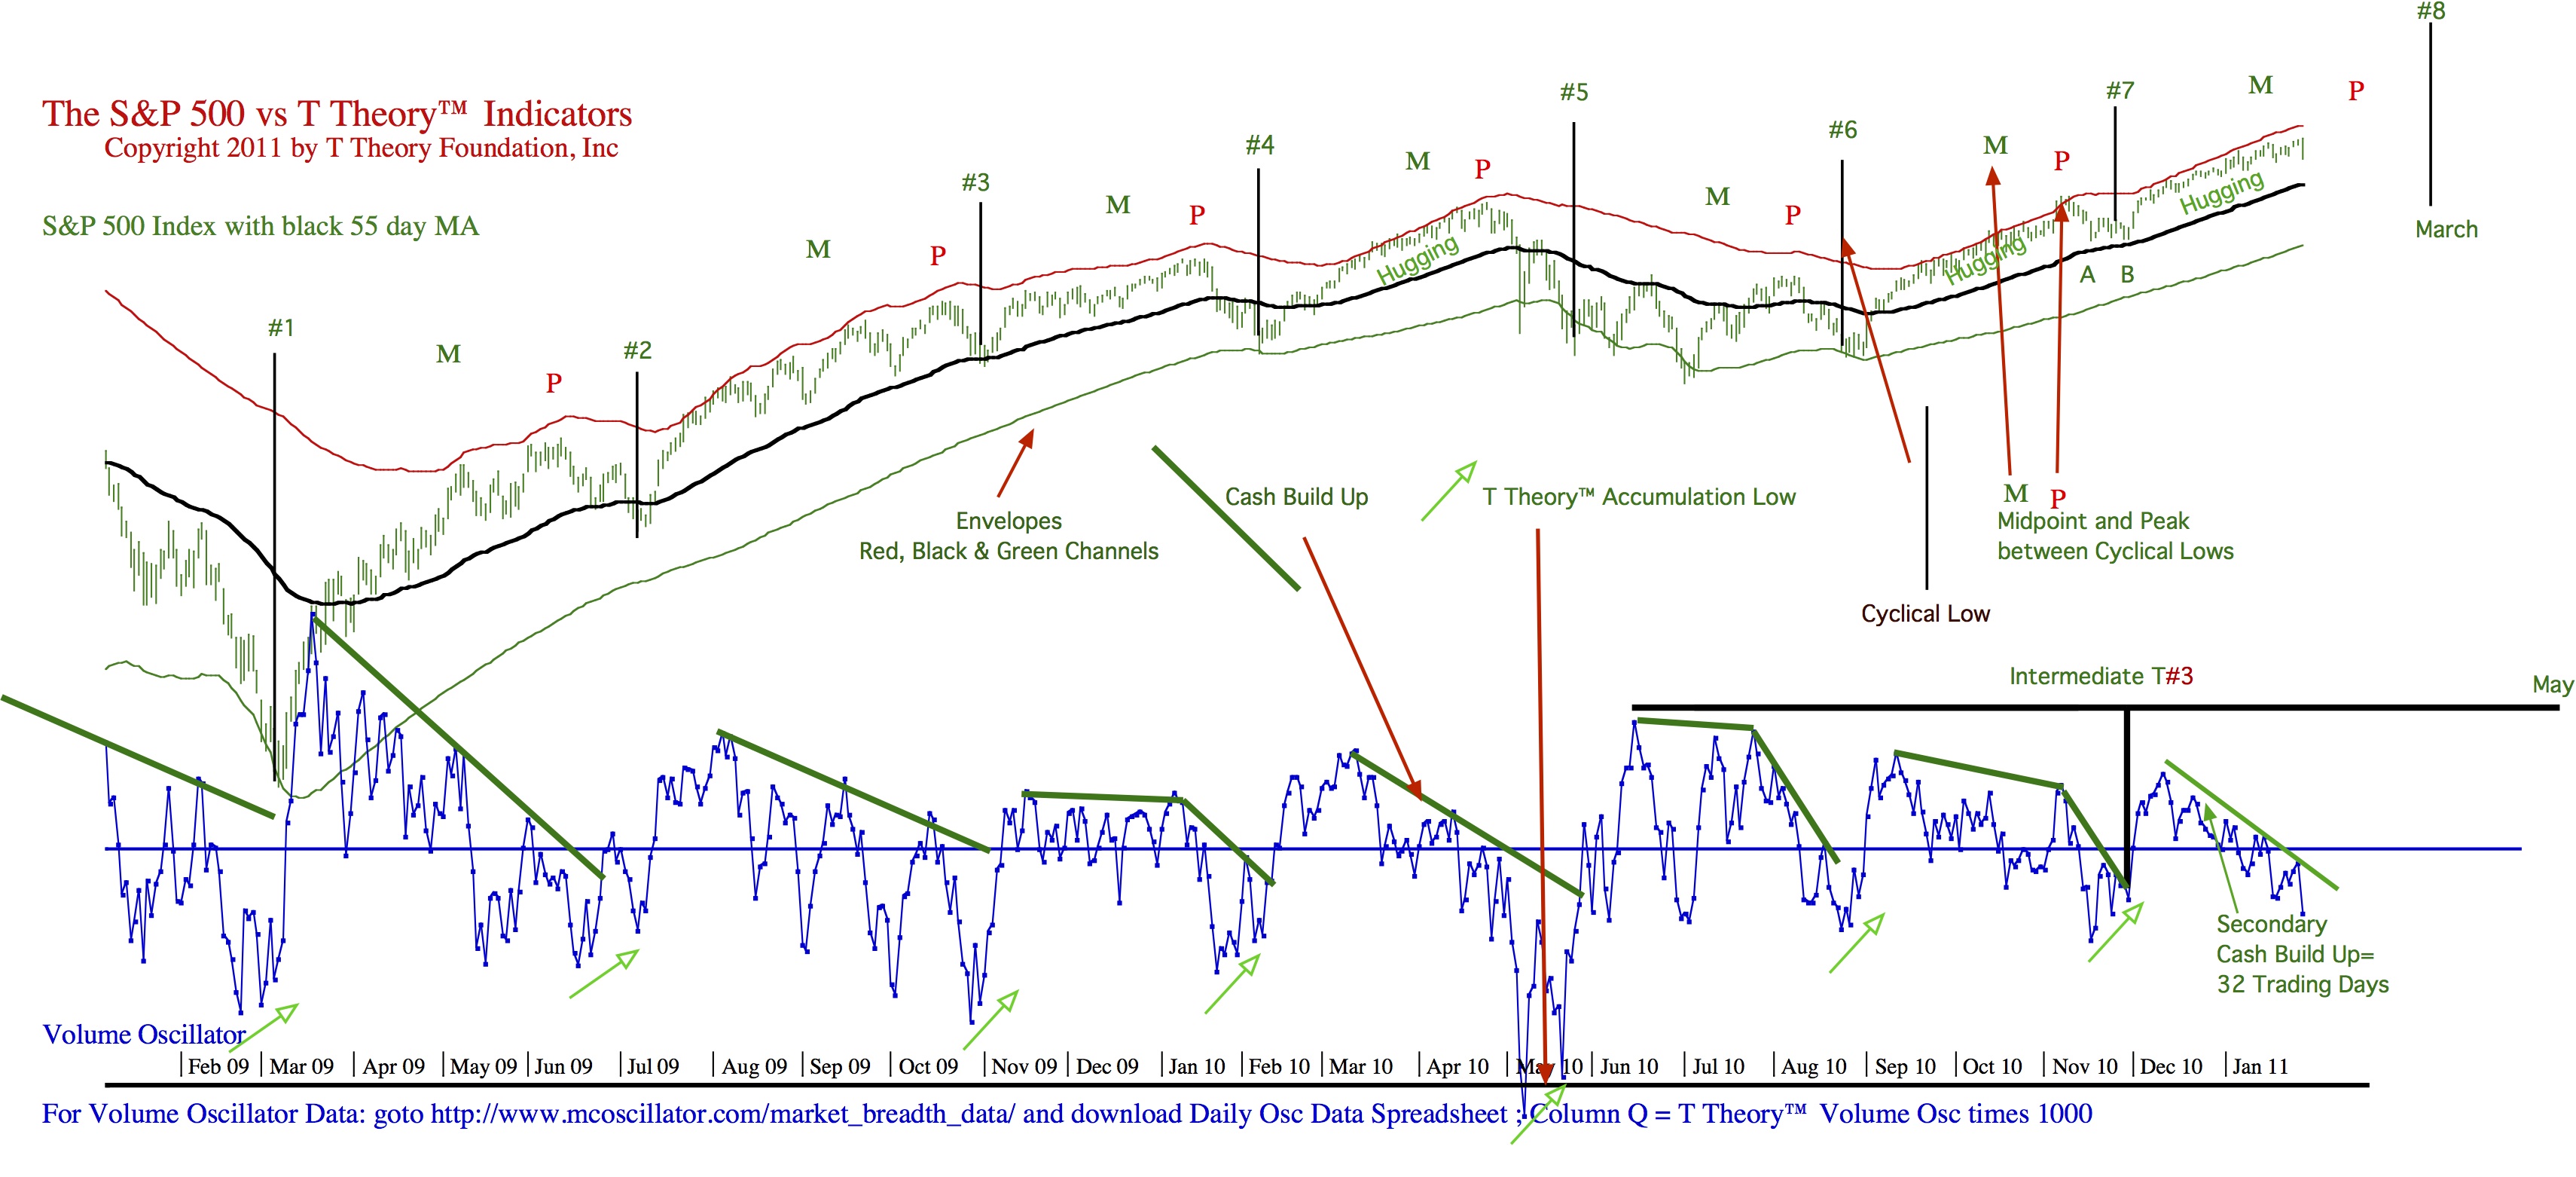
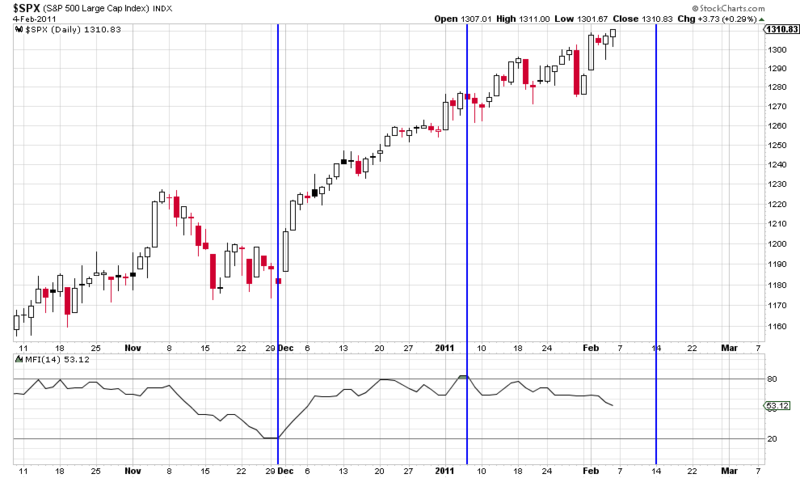
This week we will step back and take a look at the big picture. First, here’s a chart showing that the S&P has been making important tops every ~14 weeks over the last year. If the cycle holds true, we can expect the next S&P top in mid-February.
If we start the Money Flow T™ on the S&P in late November, we get an end date on February 14.

Likewise JNK acts similarly to the S&P at tops, and its Money Flow T™ suggests an end on February 15 as we discussed last week.
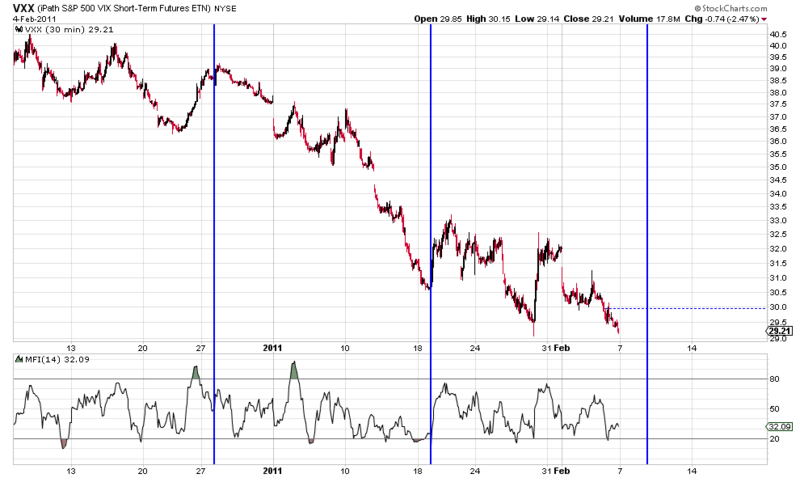
But it’s not just equities and proxies for equities in which we see evidence of a change in sentiment coming in the next week or so. Volatility is inversely correlated with stock prices. Here’s an intraday Money Flow T™ of VXX indicating that volatility is expected to bottom next week.

Further, as I have outlined over the last couple of weeks, the Gold and Copper weekly charts as well as the Dollar daily chart all have Money Flow Ts™ that are due to expire in mid-February.
When a whole bunch of different signs are all pointing in the same direction, I pay close attention. The signposts are telling me to be prepared for a change in investor sentiment coming in the next week or two. Long term, I remain generally bullish on the stock market through at least May of this year, but we are due for a correction in the short term.
January 30 2011
Download TTOAudio20110130A
PDF Chart
Download DailyChart20110128pdf
14-Week Cycle Tops and Money Flow Ts™ Suggest a Mid-February Change in Sentiment
By Parker Binion
Sunday, February 6, 2011
This week we will step back and take a look at the big picture. First, here’s a chart showing that the S&P has been making important tops every ~14 weeks over the last year. If the cycle holds true, we can expect the next S&P top in mid-February.

If we start the Money Flow T™ on the S&P in late November, we get an end date on February 14.
Likewise JNK acts similarly to the S&P at tops, and its Money Flow T™ suggests an end on February 15 as we discussed last week.
But it’s not just equities and proxies for equities in which we see evidence of a change in sentiment coming in the next week or so. Volatility is inversely correlated with stock prices. Here’s an intraday Money Flow T™ of VXX indicating that volatility is expected to bottom next week.
Further, as I have outlined over the last couple of weeks, the Gold and Copper weekly charts as well as the Dollar daily chart all have Money Flow Ts™ that are due to expire in mid-February.
When a whole bunch of different signs are all pointing in the same direction, I pay close attention. The signposts are telling me to be prepared for a change in investor sentiment coming in the next week or two. Long term, I remain generally bullish on the stock market through at least May of this year, but we are due for a correction in the short term.
****************************************************************************************
All Rights Reserved By The T Theory® Foundation ©
Order the T Theory® Encyclopedia
For a complete understanding of the T Theory® and how to successfully use Terry’s unique methods, order the Encyclopedia from Paula at the above link. There is additional material in the encyclopedia not covered here. Paula will be more than happy to answer your questions too.
Many thanks to Paula Burke for her permission to re-post Terry’s old T Theory® explanations. The period re-blogged on these pages are some of Terry Laundry’s best work and was published here from public domain.
****************************************************************************************
I claim no credit for the material found under T Theory® on this blog. All of this material is the creation of Terry Laundry and was downloaded from Terry’s free blog site (TypePad). I have created a mirror of Terry’s original material and now there is a second site containing Terry’s T Theory®. One or both of these websites hopefully will survive through time as Terry’s material is too important to be lost to the ravages of time. This site is simply a memorial to his lifetime work.
The page content re-blogged here is exactly as Terry created on his original webpages (saved on my computer with ScrapBook)). Nothing has been left out from the period Dec 2003 to June 2011. From Terry’s site, I made a lot of formatting changes, creating a more easily readable webpage appearance. The PDF chart duplicates of the JPEGs have been omitted for ease and speed of recreating Terry’s pages. References to PDF charts should be ignored (but no chart was left out).
After June 2011, Terry created a paid subscription website. None of that material is found here.
There were many many, many hours spent on this project; downloading Terry’s individual charts & audio files, followed by the uploading of Terry’s charts and audio to my WordPress blog library, after which I had to insert the uploaded material into my new T Theory® webpages (hopefully in the correct places). This was a dull and arduous project and I hope you enjoy it. I don’t believe there remains any more of Terry’s material in free domain, so my T Theory® project is probably finished. If I’ve missed something, you can leave me a comment.
If you find an uploaded reference error (chart or audio in the wrong place), please note the month and year of the webpage, plus the exact name of the referenced error file. Include any other info that will help me locate the problem file and where it occurs on the webpage. Leave a comment for me with the info and I’ll fix it.
Terry’s material is very long and will take many weeks for you to finish. Don’t hurry, it’s not a marathon and you will absorb more if you go through it at a reasonable rate. This is especially true for those who don’t invest in the T Theory® reference encyclopedia. The encyclopedia is a written reference for T Theory® and includes everything of importance for Terry’s T Theory®. Without the reference encyclopedia you must depend on your memory and Terry’s method carries some rules that you could easily violate. The encyclopedia also includes new information never seen on his website.
You are welcome to save any or all of my blog material to your computer. You also have my permission to re-blog my information, but you must (1) credit me and my blog in an obvious manner and (2) don’t change my material.
FYI – I find the best way to save a webpage is using “ScrapBook” (it’s an add-on for the FireFox browser). ScrapBook saves a webpage to your computer EXACTLY as it appears on the day you saved it. You can’t tell the difference between the internet webpage and your ScrapBook saved webpage. The saved pages are not pictures. Instead the pages consist of HTML and page functionality remains identical on your computer. There is also a second method for using ScrapBook, where you can save all of the webpages down to a defined link depth. This optional method means all links will function on your computer to the link depth specified (meaning you can click on links on your saved webpages and tunnel down into pages within pages). Saving the normal way will only save the top webpage but the links that exist could continue to function by taking you to the website on the internet instead of on your computer. But sometimes the linked website doesn’t exist anymore. I’ve had this happen on some very good webpages with unique information (they just disappear into the internet void). That’s a bummer when you lost some really good info and thus rose my need for ScrapBook. You can also filter the pages saved using the optional ScrapBook method, which can exclude all pages not coming directly from the specified website (filtering is recommended using this method otherwise you wind up with a LOT of useless stuff).
.
Explore posts in the same categories: . . . T Theory®
Leave A Reply