January 2011 – T Theory® Update

T Theory Observations for January 23 2010
PDF Chart
Download DailyChart20110121pdf
Audio Commentary
Download TTOAudio20110123A
Money Flow Ts™ for Gold and Copper
By Parker Binion
Last week, we defined the Money Flow T™ concept which I discovered, and looked at the Money Flow T™ projections for the S&P 500. This week, we’ll look at projections for Gold and Copper. But first, let’s review an expired Gold Money Flow T™ based on the GLD daily chart to illustrate the concepts:
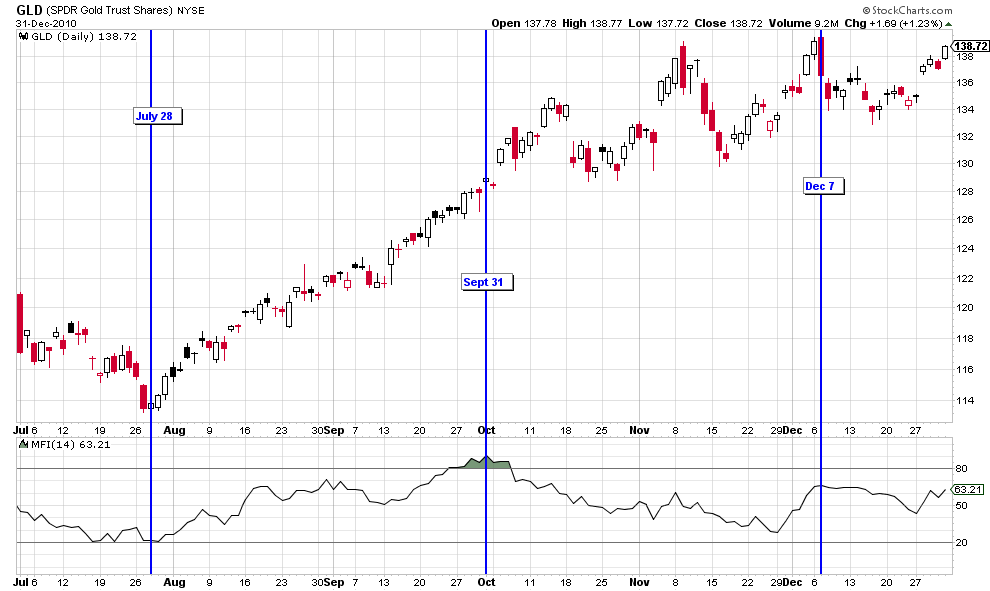
Here, the uptrend in GLD started on July 28, 2010. The Money Flow Index peaked on September 31. Using an equal time projection, the Money Flow T™ suggested that the energy of the move in GLD would deplete on December 7 which was an accurate forecast. It’s important to remember that sometimes, the end of a Money Flow T™ will result in a trend change. Other times, as here, it will result in a period of consolidation that could lead to either a trend resumption or a trend change.
Moving to the current GLD forecast, we will examine a GLD weekly chart. Any time symmetry technique that works on one time frame should work on all time frames. In other words, Money Flow Ts™ are fractal in nature.
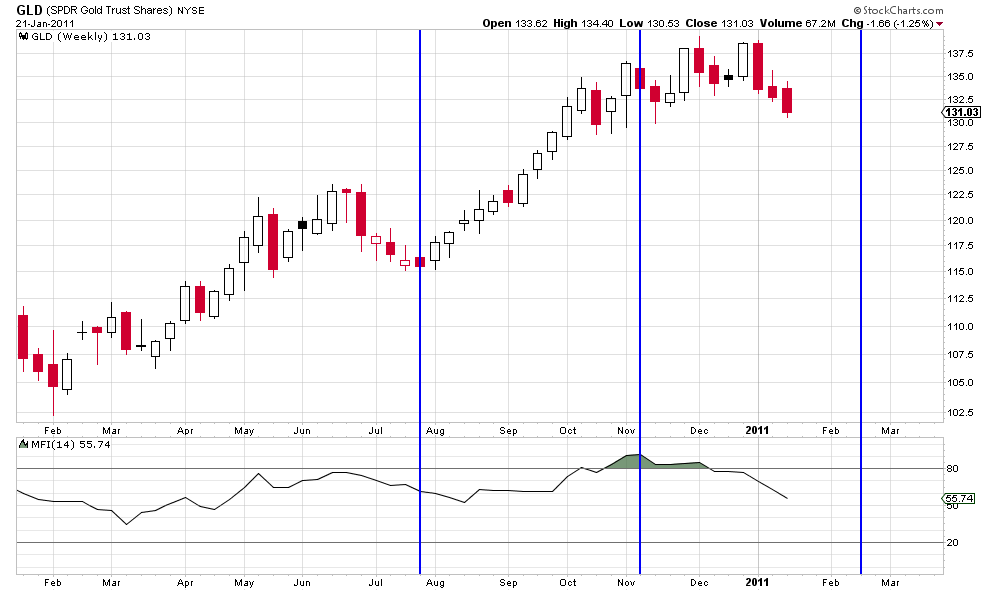
Here we use a Money Flow Index peak in early November as the center post with the same starting date in late July. The Money Flow T™ is projected to end in mid-February.
When forecasting Gold, I always like to check the forecast against the Dollar, since Gold often trades inversely to the Dollar. UUP is the ETF that tracks the dollar. Here, the UUP daily chart confirms a mid-February bottom in the Dollar:

You’ll notice that the Dollar Money Flow T™ is inverted. It uses a low in the Money Flow Index as a center post to project the end of the energy of a down move.
Finally, let’s move to Copper. Copper is not only important as a hedge against inflation, but its demand reflects strong economic activity. There’s an old saying that “market tops are built on a roof of Copper.”
In order to construct Money Flow Ts on Copper, I use the ETF called JJC which seeks investment results that correspond to Copper futures. Here is the JJC weekly Money Flow T™:
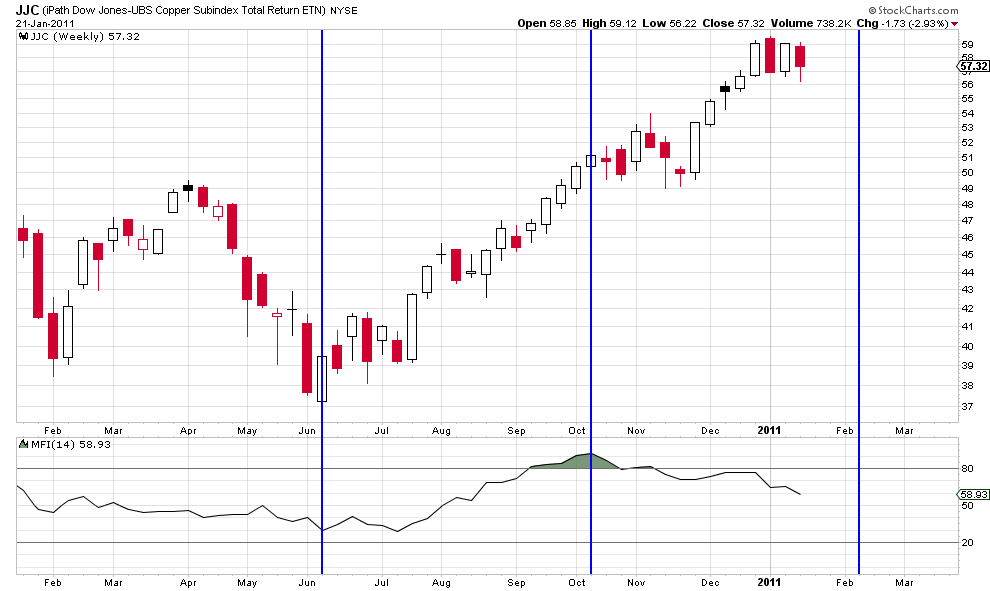
As you can see, from the start of the move to the Money Flow Index peak projects an energy depletion in the second week of February.
That’s it for this week. Next week, we’ll take a look at Bonds.The analysis will focus on high yield bonds vs high quality US Treasuries. As always, please use caution in your investments and manage your risk wisely.
T Theory™ Tutorials
For the next few months the Money Flow T™ concept is the key project for Parker’s and Terry’s research activities at T Theory Foundation. Consider Parker’s weekly postings here as our most significant new Tutorials and try to better understand them by exploring areas of special interest to you.
You can duplicate the Money Flow Ts™ charts with a subscription to http://www.stockcharts.com, but you will need to read the stock charts tutorials on how to place the verticle lines in a time symetrical pattern.
T Theory Observations for January 16 2010
PDF Chart
Download DailyChart20110114pdf
mp3 audio commentary
Download TTOAudio20110116A
Money Flow Time Symmetries
By Parker Binion
Can you increase the odds of determining when a trend will either: 1) reverse, or 2) enter a consolidation phase? In working with the Money Flow Index, I discovered that often during a strong up (or down) trend, the Money Flow will peak (or bottom) in the middle of the move. Accordingly, if you properly define the starting point of the move, I have observed that you can frequently anticipate when the energy of the move will deplete. I call these “Money Flow Ts”.
The Money Flow Index is a momentum indicator which measures the strength of money flowing into and out of a particular security. It is based on a security’s typical price, which is that period’s high, low and close divided by three. The typical price is multiplied by the period’s volume to determine raw money flow. Then a ratio is constructed comparing the positive raw money flow in periods where the typical price increased with the negative raw money flow in periods where the typical price decreased. The standard number of periods used for comparison is 14.
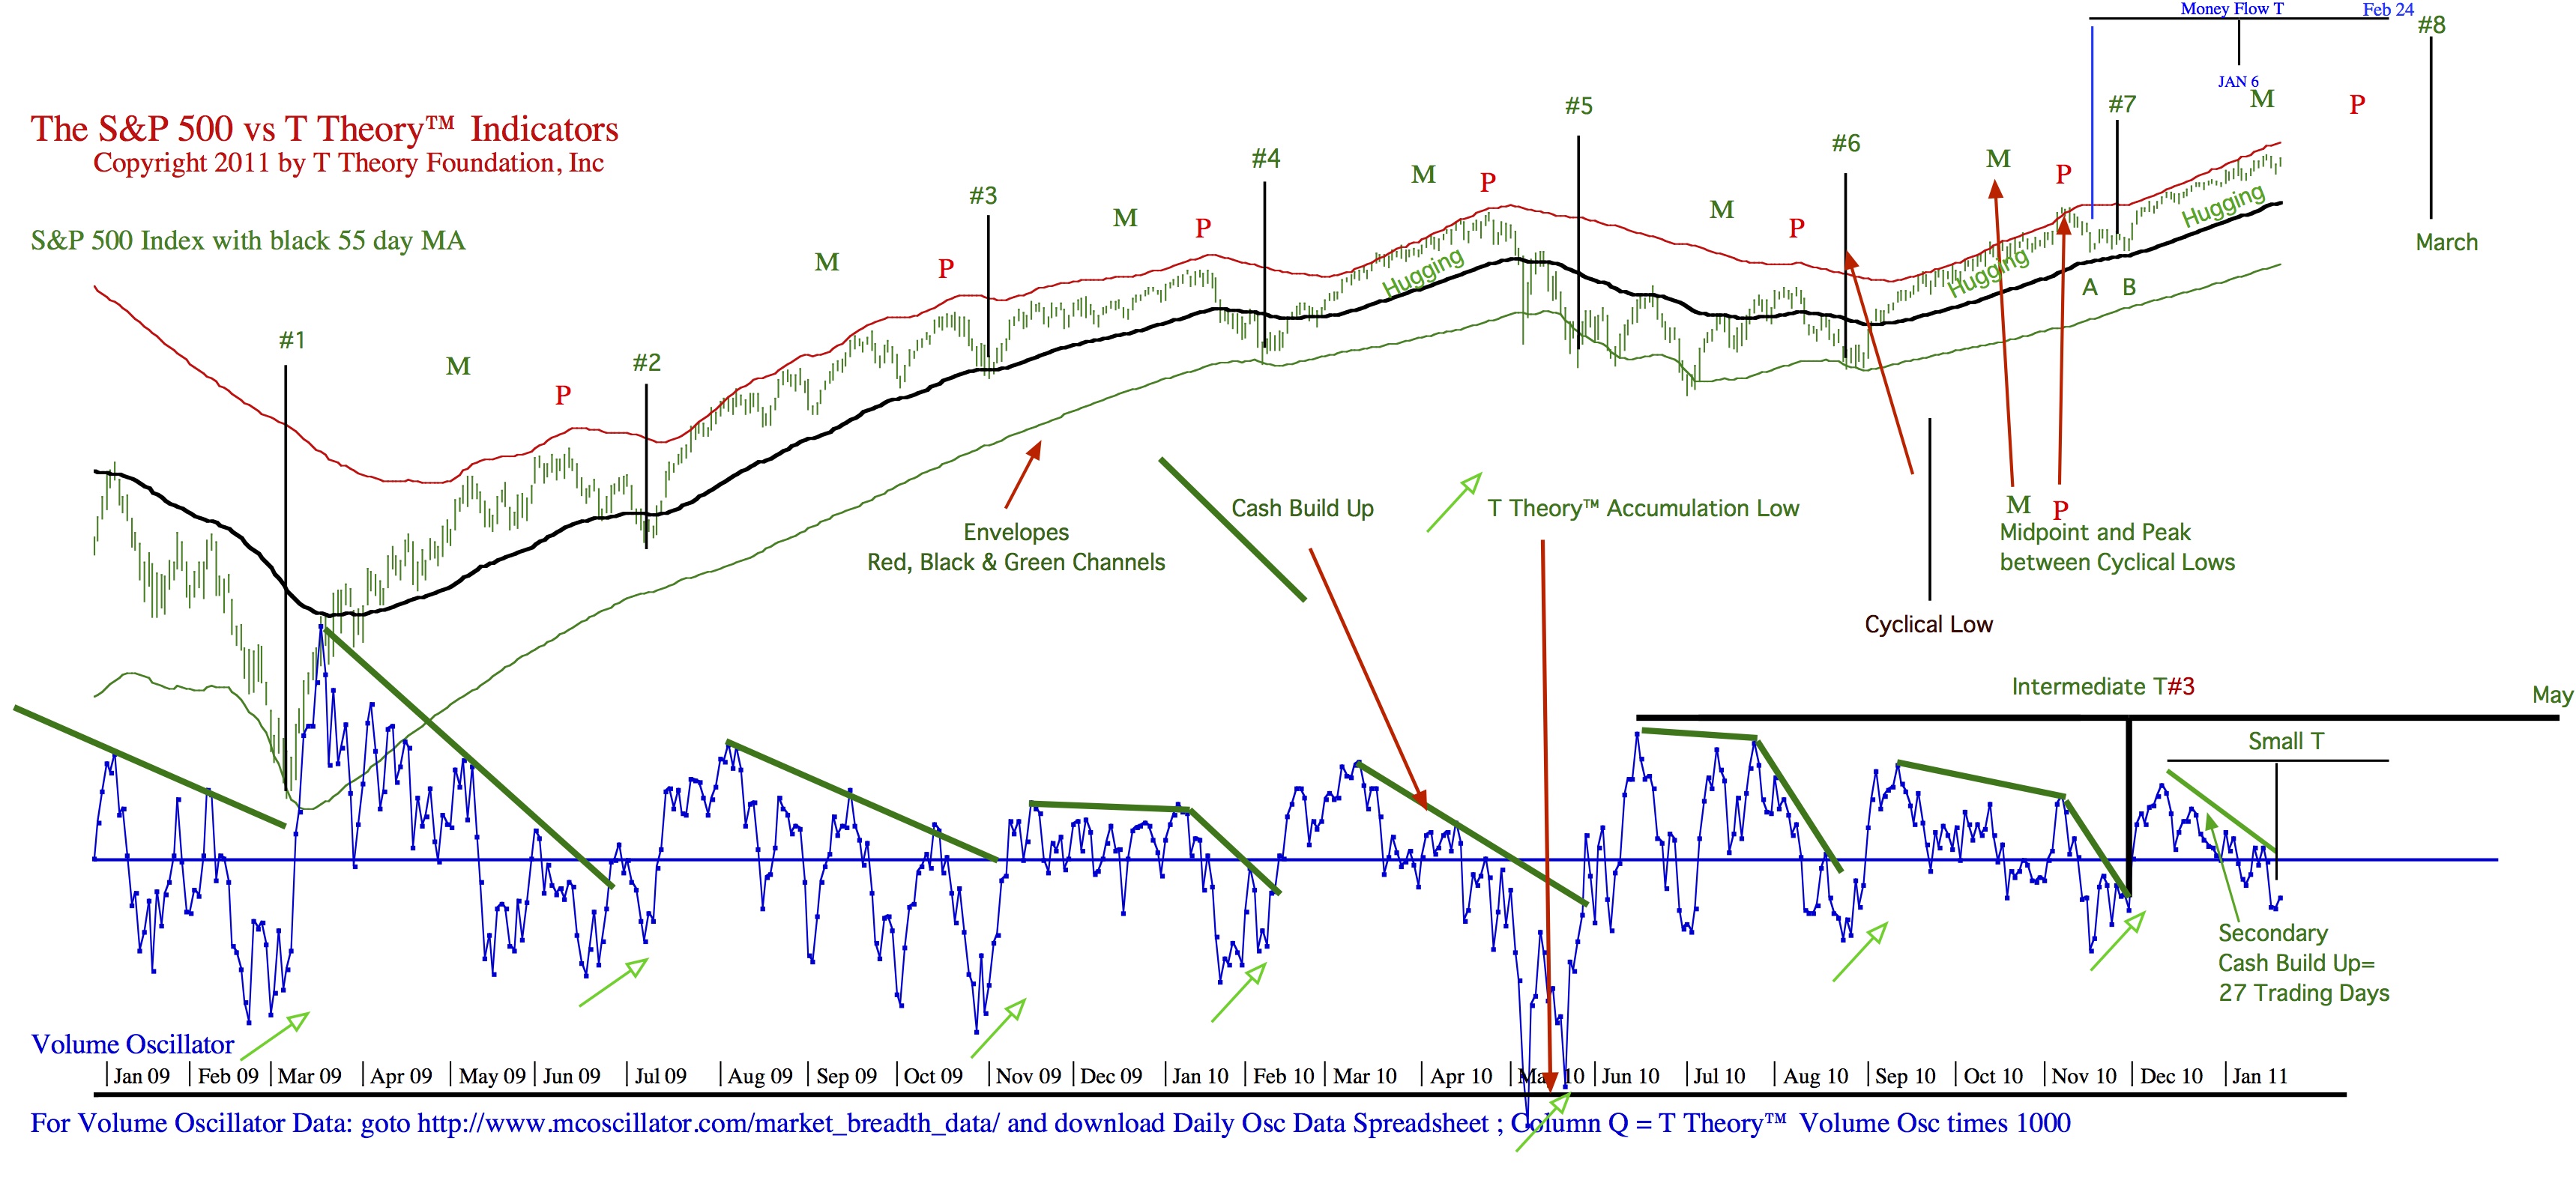
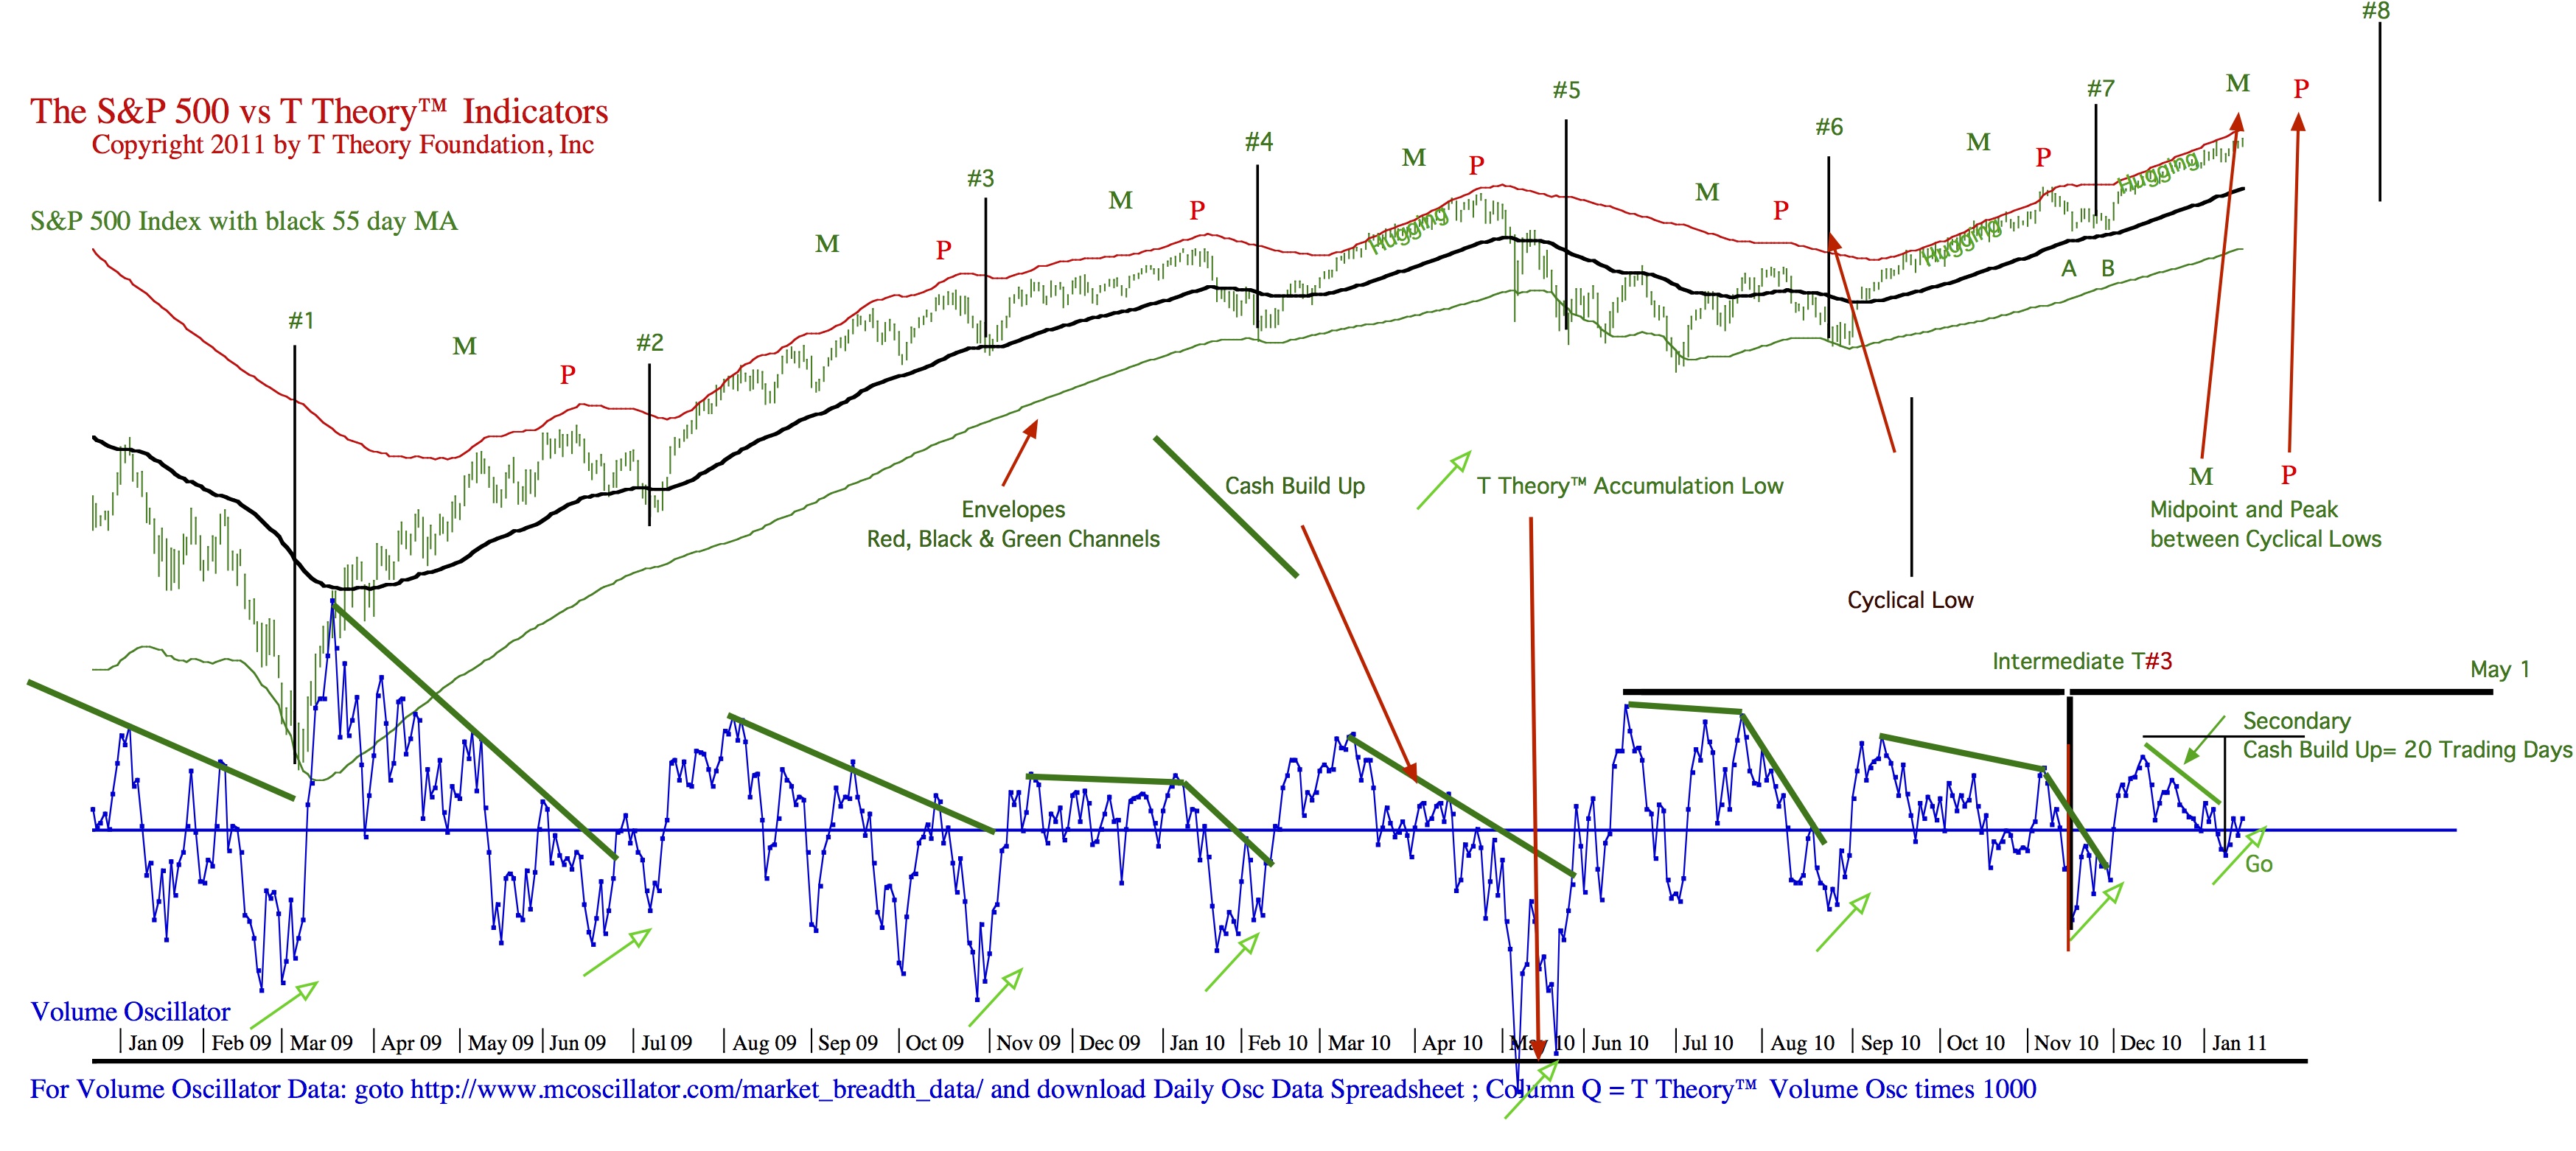
Before we look at the current Money Flow Ts, let’s examine what happened last Spring in the S&P to illustrate several Money Flow T concepts:
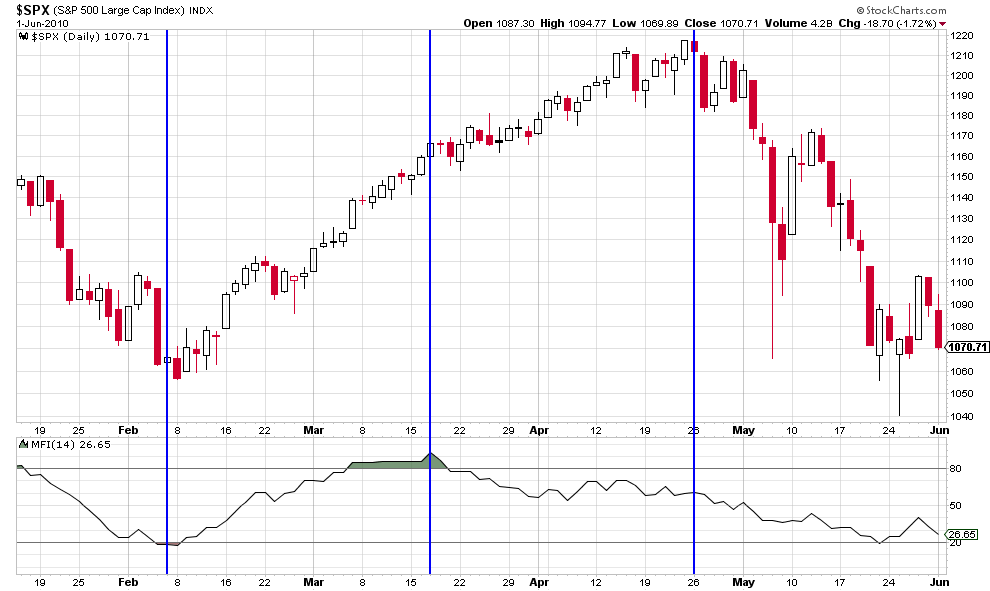
As you can see, the Money Flow Index peaked on March 17, after which the S&P continued to advance while the Money Flow Index retreated. So, 1) placing the center post on March 17, and 2) starting the Money Flow T on February 5 when the up trend commenced, projected that the energy of the move would end on April 26. Not only did the energy of the move deplete, but the trend reversed on that day.
The current up move in the S&P started in November. As shown below, the Money Flow Index recently peaked on January 6, and has started to retreat while the S&P broke to new highs for the trend as of Wednesday, January 12.
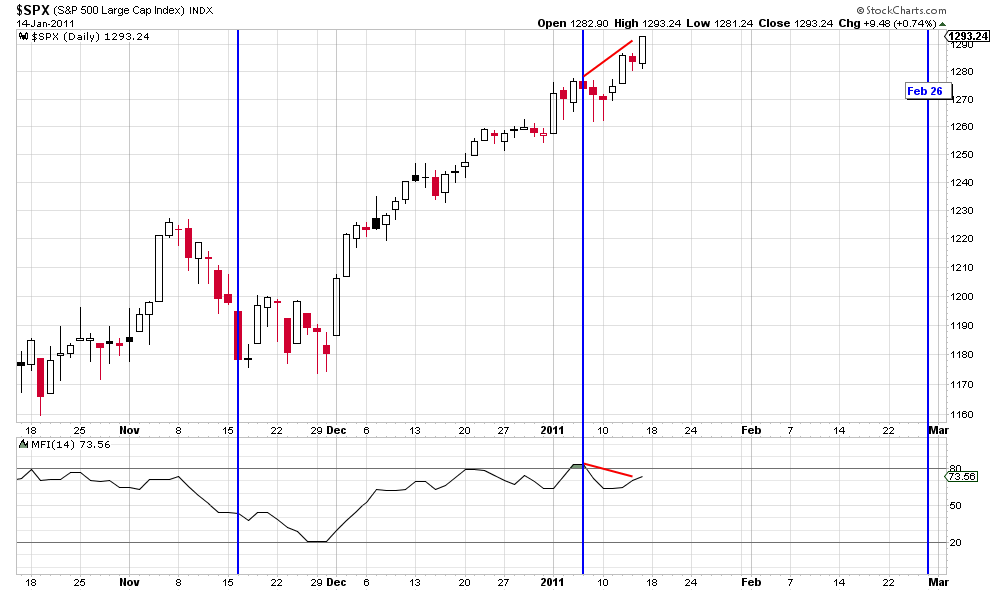
Using January 6 as a center post and November 16 as the earliest possible start date for the Money Flow T projects an end to the energy of the move on February 26. There are two caveats to this analysis. First, there is plenty of time between now and the end of February for the Money Flow Index to make a new center post of an even longer Money Flow T that would project an end to the energy even later. Second, November 16 is the most conservative choice for the start of the Money Flow T. One could argue that the move did not begin until November 30. From a practical perspective, all this two week disparity in potential starting dates means is that you would be on the lookout for a topping pattern in the two weeks leading up to February 26.
Now let’s look at the intra-day chart of SPY:
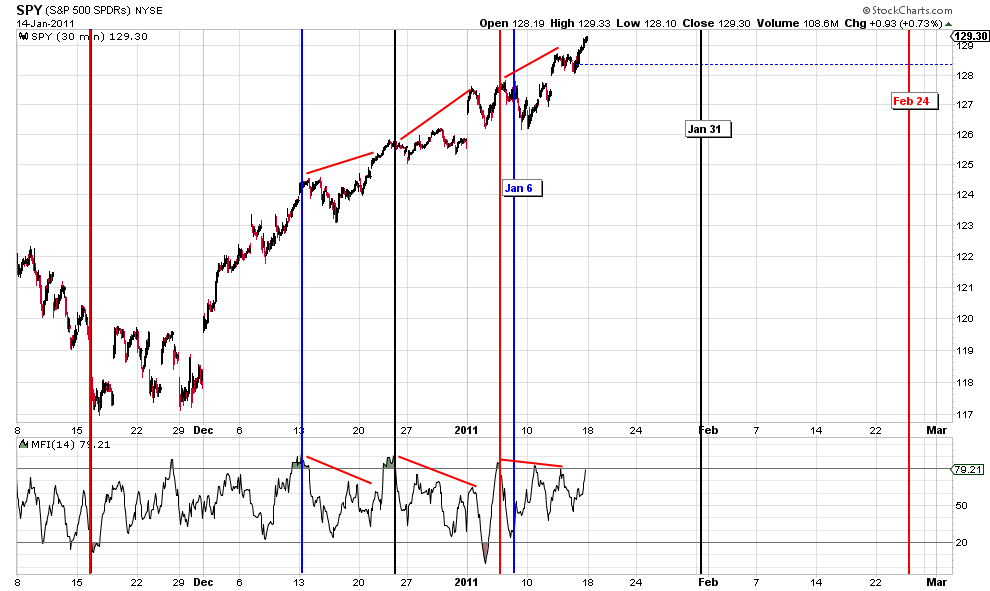
All of the Money Flow Ts depicted on this chart use November 16 as a starting point. The blue lines use a Money Flow peak center post on December 13 to correctly project an energy depletion on January 6. You will notice that we did not get a trend change. Rather, the trend simply took a breather for a couple of days.
The black lines use a Money Flow peak center post on December 23 to project an energy depletion on January 31.
The red lines use a Money Flow peak center post on January 5 to project an energy depletion on February 24, which coincides with the projection we saw on the daily chart.
A couple of notes. First, today, we got another spike in the Money Flow Index which could serve the basis for another center post of an even longer Money Flow T if the S&P continues to advance while the Money Flow Index starts to retreat. Second, no methodology is 100% accurate all the time. Please use caution in your investments and manage your risk wisely.
Parker B. Binion
T Theory Observations for January 9 2010
PDF Chart
Download DailyChart20110107pdf
mp3 Audio Commentary
Download TTOAudio20110109A
PDF Chart
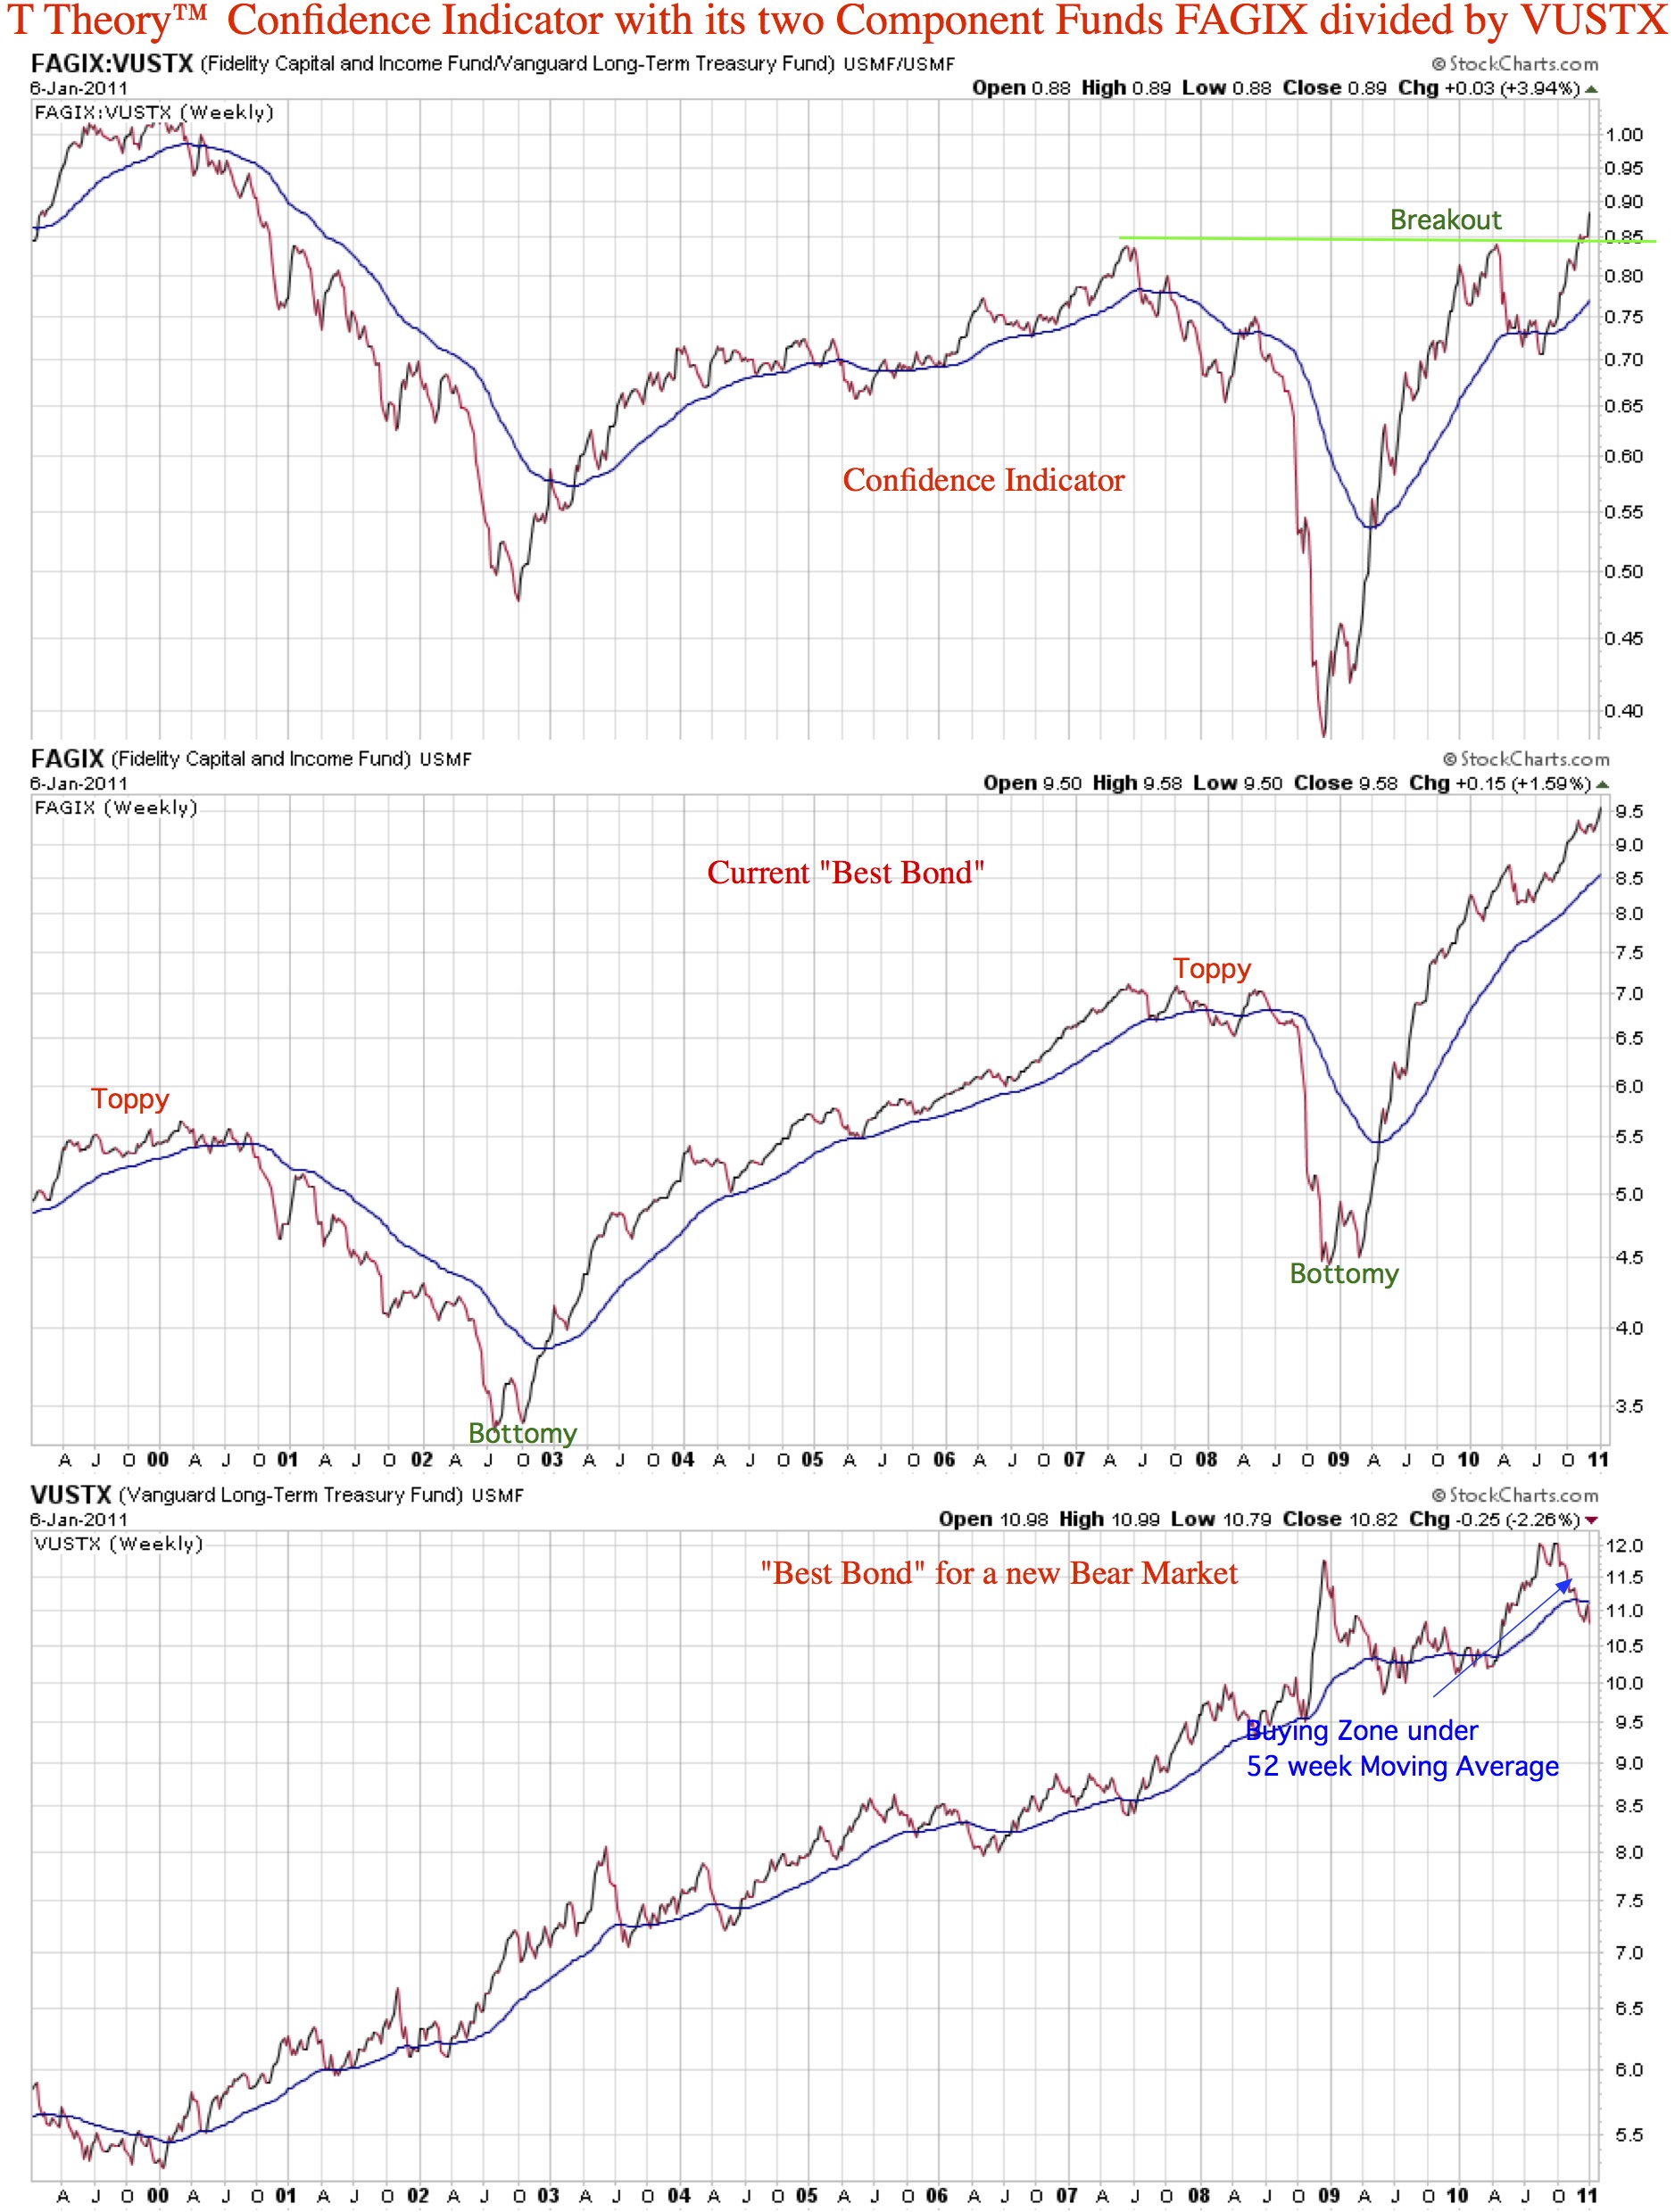
T Theory™ Bullish Bond Confidence Indicator
PDF Chart
Download T Theory Confidence Indicator20110107pdf
mp3 Audio
Download TTOAudio20110109B
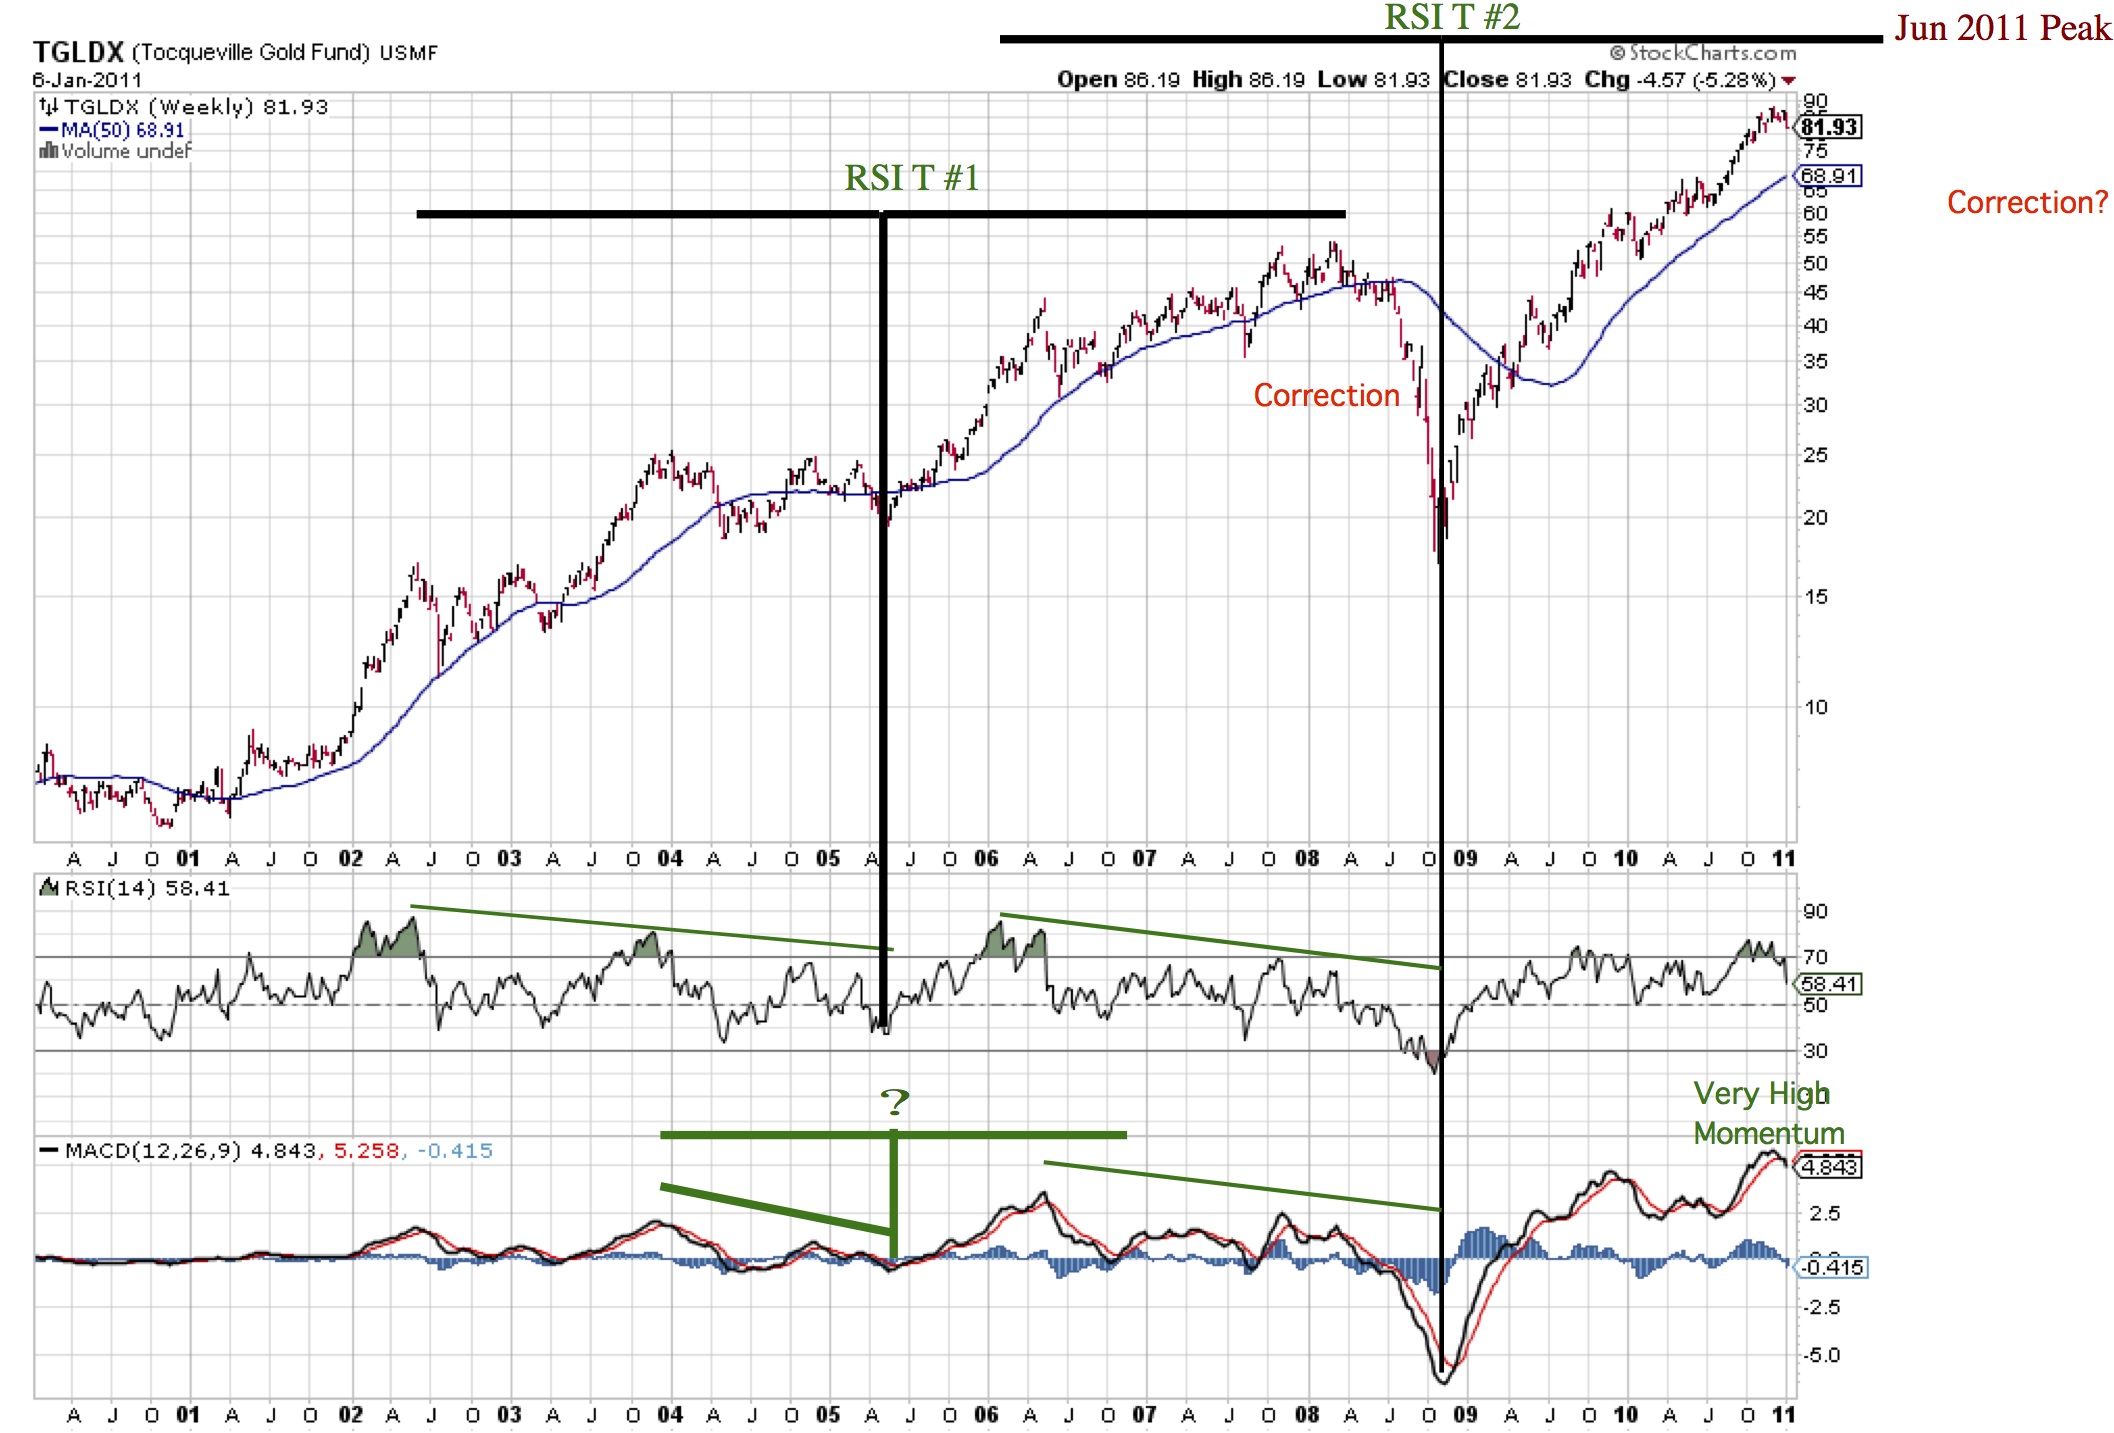
T Theory™ Bullish Gold Outlook into June
PDF Chart
Download TGLDX LT GoldTs20110106pdf
mp3 Audio
Download TTOAudio20110109C
T Theory Observations for January 2 2010
Todays New Daily Chart Download DailyChart20101231pdf
First mp3 Audio Commentary Download TTOAudio20110102A
Second mp3 Audio Commentary Download TTOAudio20110102B
****************************************************************************************
All Rights Reserved By The T Theory® Foundation ©
Order the T Theory® Encyclopedia
For a complete understanding of the T Theory® and how to successfully use Terry’s unique methods, order the Encyclopedia from Paula at the above link. There is additional material in the encyclopedia not covered here. Paula will be more than happy to answer your questions too.
Many thanks to Paula Burke for her permission to re-post Terry’s old T Theory® explanations. The period re-blogged on these pages are some of Terry Laundry’s best work and was published here from public domain.
****************************************************************************************
I claim no credit for the material found under T Theory® on this blog. All of this material is the creation of Terry Laundry and was downloaded from Terry’s free blog site (TypePad). I have created a mirror of Terry’s original material and now there is a second site containing Terry’s T Theory®. One or both of these websites hopefully will survive through time as Terry’s material is too important to be lost to the ravages of time. This site is simply a memorial to his lifetime work.
The page content re-blogged here is exactly as Terry created on his original webpages (saved on my computer with ScrapBook)). Nothing has been left out from the period Dec 2003 to June 2011. From Terry’s site, I made a lot of formatting changes, creating a more easily readable webpage appearance. The PDF chart duplicates of the JPEGs have been omitted for ease and speed of recreating Terry’s pages. References to PDF charts should be ignored (but no chart was left out).
After June 2011, Terry created a paid subscription website. None of that material is found here.
There were many many, many hours spent on this project; downloading Terry’s individual charts & audio files, followed by the uploading of Terry’s charts and audio to my WordPress blog library, after which I had to insert the uploaded material into my new T Theory® webpages (hopefully in the correct places). This was a dull and arduous project and I hope you enjoy it. I don’t believe there remains any more of Terry’s material in free domain, so my T Theory® project is probably finished. If I’ve missed something, you can leave me a comment.
If you find an uploaded reference error (chart or audio in the wrong place), please note the month and year of the webpage, plus the exact name of the referenced error file. Include any other info that will help me locate the problem file and where it occurs on the webpage. Leave a comment for me with the info and I’ll fix it.
Terry’s material is very long and will take many weeks for you to finish. Don’t hurry, it’s not a marathon and you will absorb more if you go through it at a reasonable rate. This is especially true for those who don’t invest in the T Theory® reference encyclopedia. The encyclopedia is a written reference for T Theory® and includes everything of importance for Terry’s T Theory®. Without the reference encyclopedia you must depend on your memory and Terry’s method carries some rules that you could easily violate. The encyclopedia also includes new information never seen on his website.
You are welcome to save any or all of my blog material to your computer. You also have my permission to re-blog my information, but you must (1) credit me and my blog in an obvious manner and (2) don’t change my material.
FYI – I find the best way to save a webpage is using “ScrapBook” (it’s an add-on for the FireFox browser). ScrapBook saves a webpage to your computer EXACTLY as it appears on the day you saved it. You can’t tell the difference between the internet webpage and your ScrapBook saved webpage. The saved pages are not pictures. Instead the pages consist of HTML and page functionality remains identical on your computer. There is also a second method for using ScrapBook, where you can save all of the webpages down to a defined link depth. This optional method means all links will function on your computer to the link depth specified (meaning you can click on links on your saved webpages and tunnel down into pages within pages). Saving the normal way will only save the top webpage but the links that exist could continue to function by taking you to the website on the internet instead of on your computer. But sometimes the linked website doesn’t exist anymore. I’ve had this happen on some very good webpages with unique information (they just disappear into the internet void). That’s a bummer when you lost some really good info and thus rose my need for ScrapBook. You can also filter the pages saved using the optional ScrapBook method, which can exclude all pages not coming directly from the specified website (filtering is recommended using this method otherwise you wind up with a LOT of useless stuff).
.
Explore posts in the same categories: . . . T Theory®
Leave A Reply