January 2008 – T Theory® Update

T Theory Observations for January 28 2008
I still have to take note of the negative declining bottoms trend in the blue volume oscillator as per the red arrowed line for this week’s daily chart. This is getting serious. See the PDF chart link below.
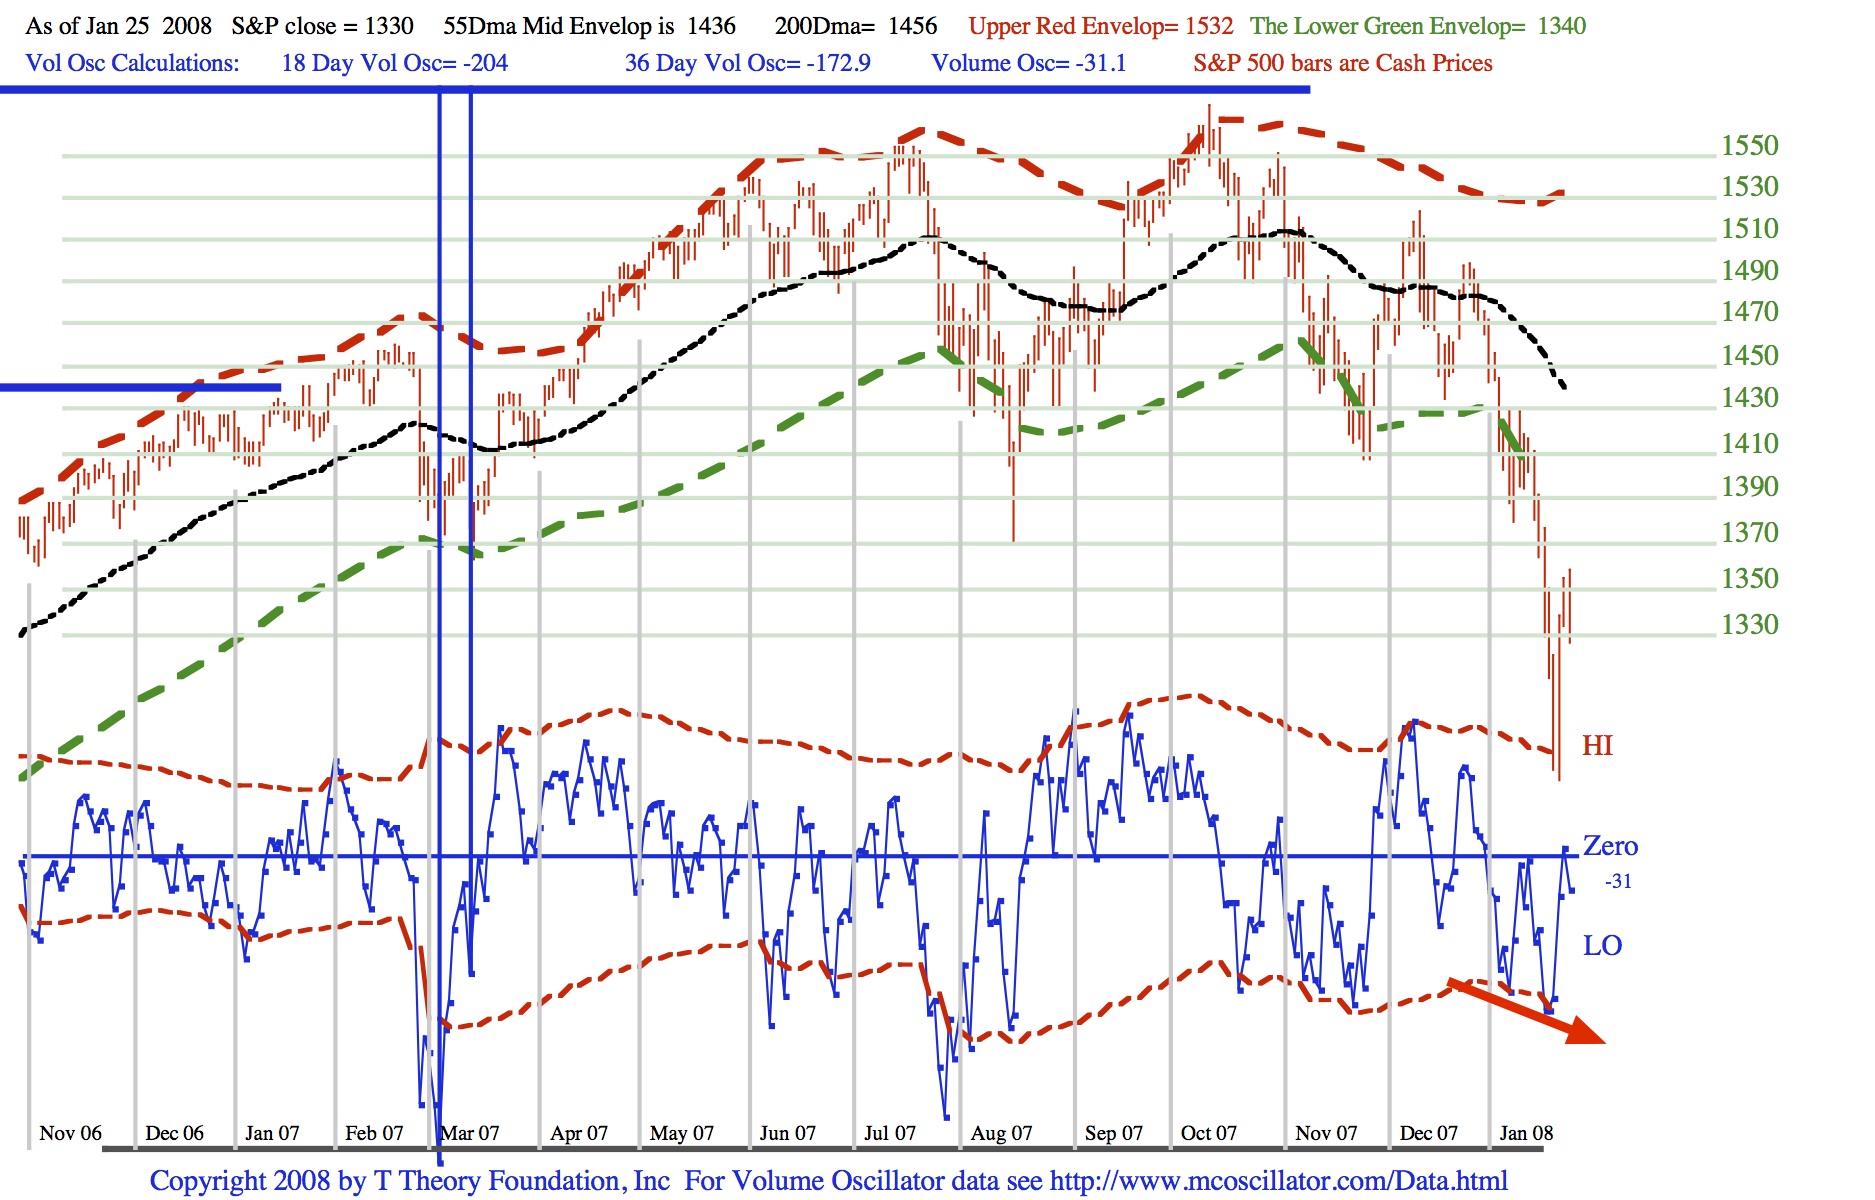
It is possible for a further rally to get under way near term but I would be wary that all we will see is a sideways trend followed by a new very sharp selling wave. Note that the oscillator went very low at the center-post of the last T in March ‘07. Since we have seen no such comparable conditions, the safest conclusion is the usual selling climax that marks a new Ts bottoming, lies ahead.
This is very dangerous because the S&P down trend is accelerating but has never quite washing out. Based on my 35 years of watching this oscillator I would say its current pattern reminds me of the days prior to the 1987 panic.
T Theory Observations for January 21 2008
I am still looking for a rally up to the 55 Day MA. But this week I have to take note of the negative declining bottoms trend in the blue volume oscillator. See the PDF chart link below.
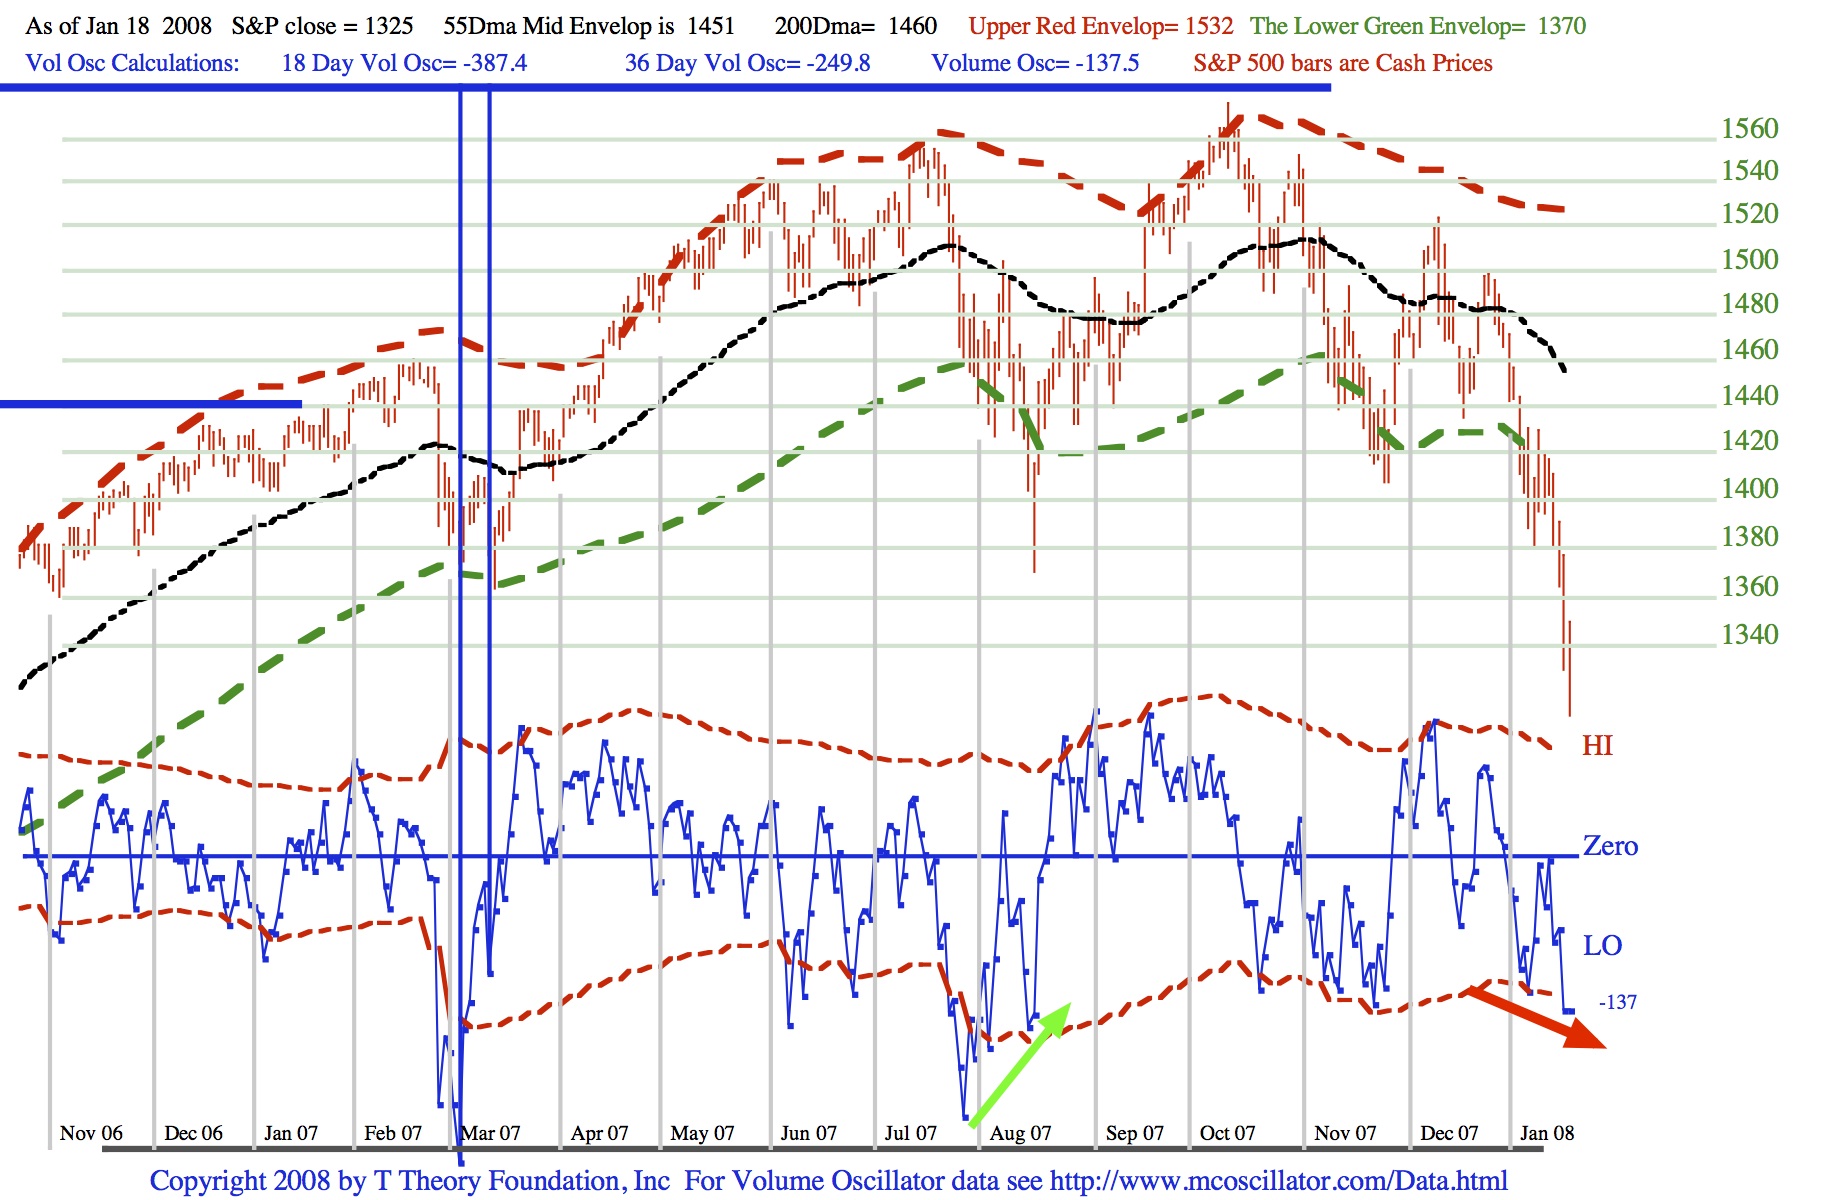
What the market really needs to produce any sustainable rally is a rising bottoms pattern as noted by the rising green line at the August ‘07 low. Any time the oscillator makes a rising pair of lows while the market averages remain under severe selling pressure, it is likely the potential sellers have become sold out, at least temporarily, so a decent recovery can get underway. The current declining bottoms suggests an acceleration in selling which could lead to a greater panic near term before a good rally.
Generally it would be safer to see a rising oscillator bottom pattern before anticipating any decent rally due to the steepness of this decline. Regardless, the 55 Day MA will prove a difficult upside resistance level since we are in a long term down trend.
T Theory Observations for January 14 2008
We appear to have entered the long term bearish trend projected by the Advance Decline T based the recent weakness. As a result rallies are expected to peak at the 55 day MA in the PDF chart below.
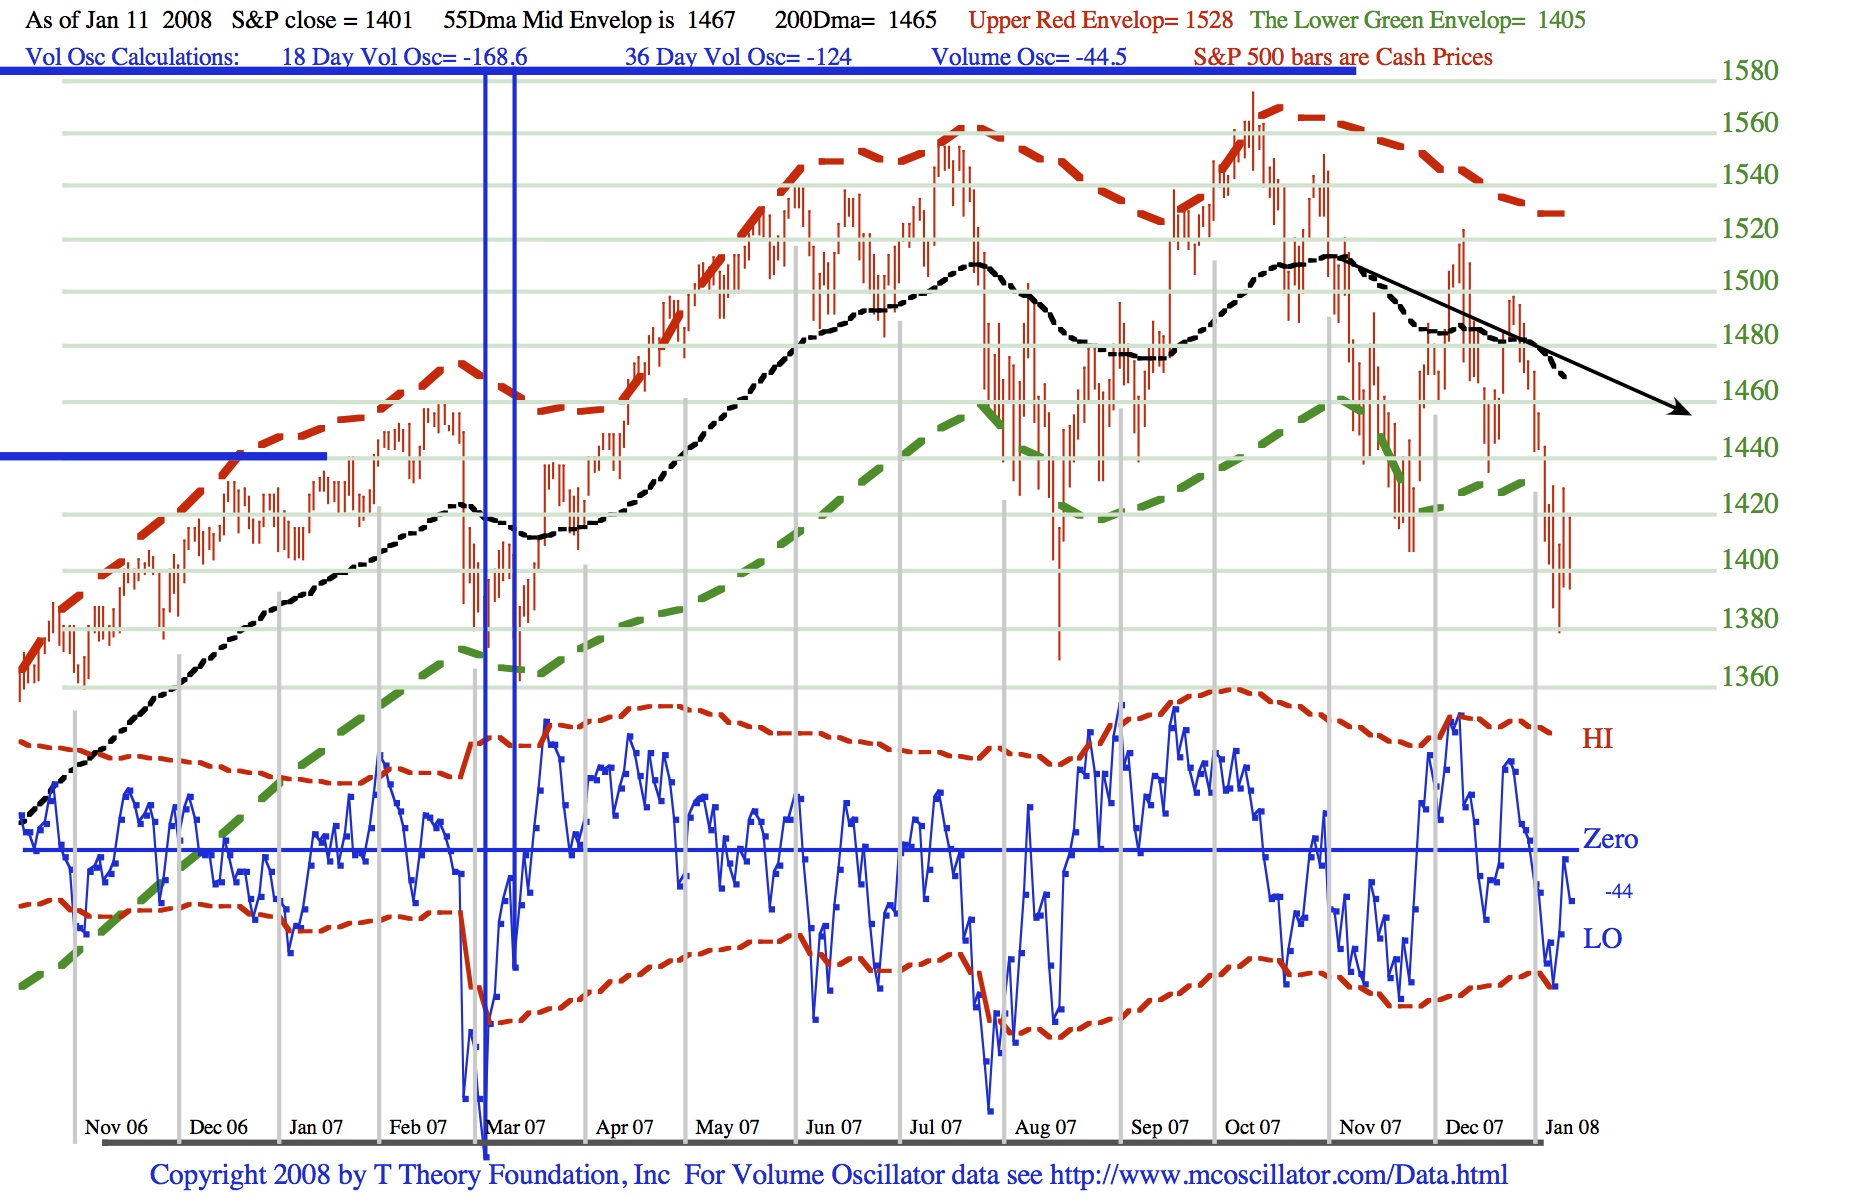
As noted in the chart by the black arrow this MA is definitely trending lower and rallies should peak just above the 55 Day MA, currently 1467 and falling slightly over time. The S&P is clearly oversold, and a rally can be expected at some point during January.
T Theory Observations for January 7 2008
As we have been discussing in the regular Monday updates, the daily indicators have been weakening in line with the Long Range T Theory forecast, which for this period is based on the NY Advance-Decline Line T coming out of the late 2002/early 2003 low, and which technically calls for a September 2007 peak. This concept is, to my knowledge, the best example of the time symmetry I call the Law, or more politely, the Theory of Matched Trend Time. It has no serious time projection errors since 1929, so as we begin the new year I have to say my T Theory is absolutely and unambiguously bearish for the next few years, most likely into late 2010.
To add perspective I have presented the average bear case in the table at my first posting for the year (see below) summarizing the last 14 serious (-34%) bear markets. Of primary interest at this time is the frequency of the 14 declines over almost 80 years for an average interval of 5.7 years. Thus it would not seem unusual to be starting a new bear market some 7 years after the last. The second point of the table, that might not be clear to experienced long term investors, is that basic math can be a big help in growing money from two vantage points.
Very Long Term, that is over your adult life time, the biggest math helper is compound growth. This needs to be assisted by a discipline that insures steady, even if unspectacular gains, with no serious losses to interrupt the compounding over some 30 to 50 years. The second math helper, illustrated in the table is the major profit opportunity that arrived at each of the major lows noted here. As we all know, suffering a 50% loss requires a subsequent 100% gain to “get even”. But with the Advance-Decline T forecast of key peaks, one should avoid the worst, and if patient, concentrate on identifying the next major low. I will work on this aspect with special long range studies to be posted at the first of the month during the new year.
In the meantime let us look at the daily chart which can be downloaded at the link below.
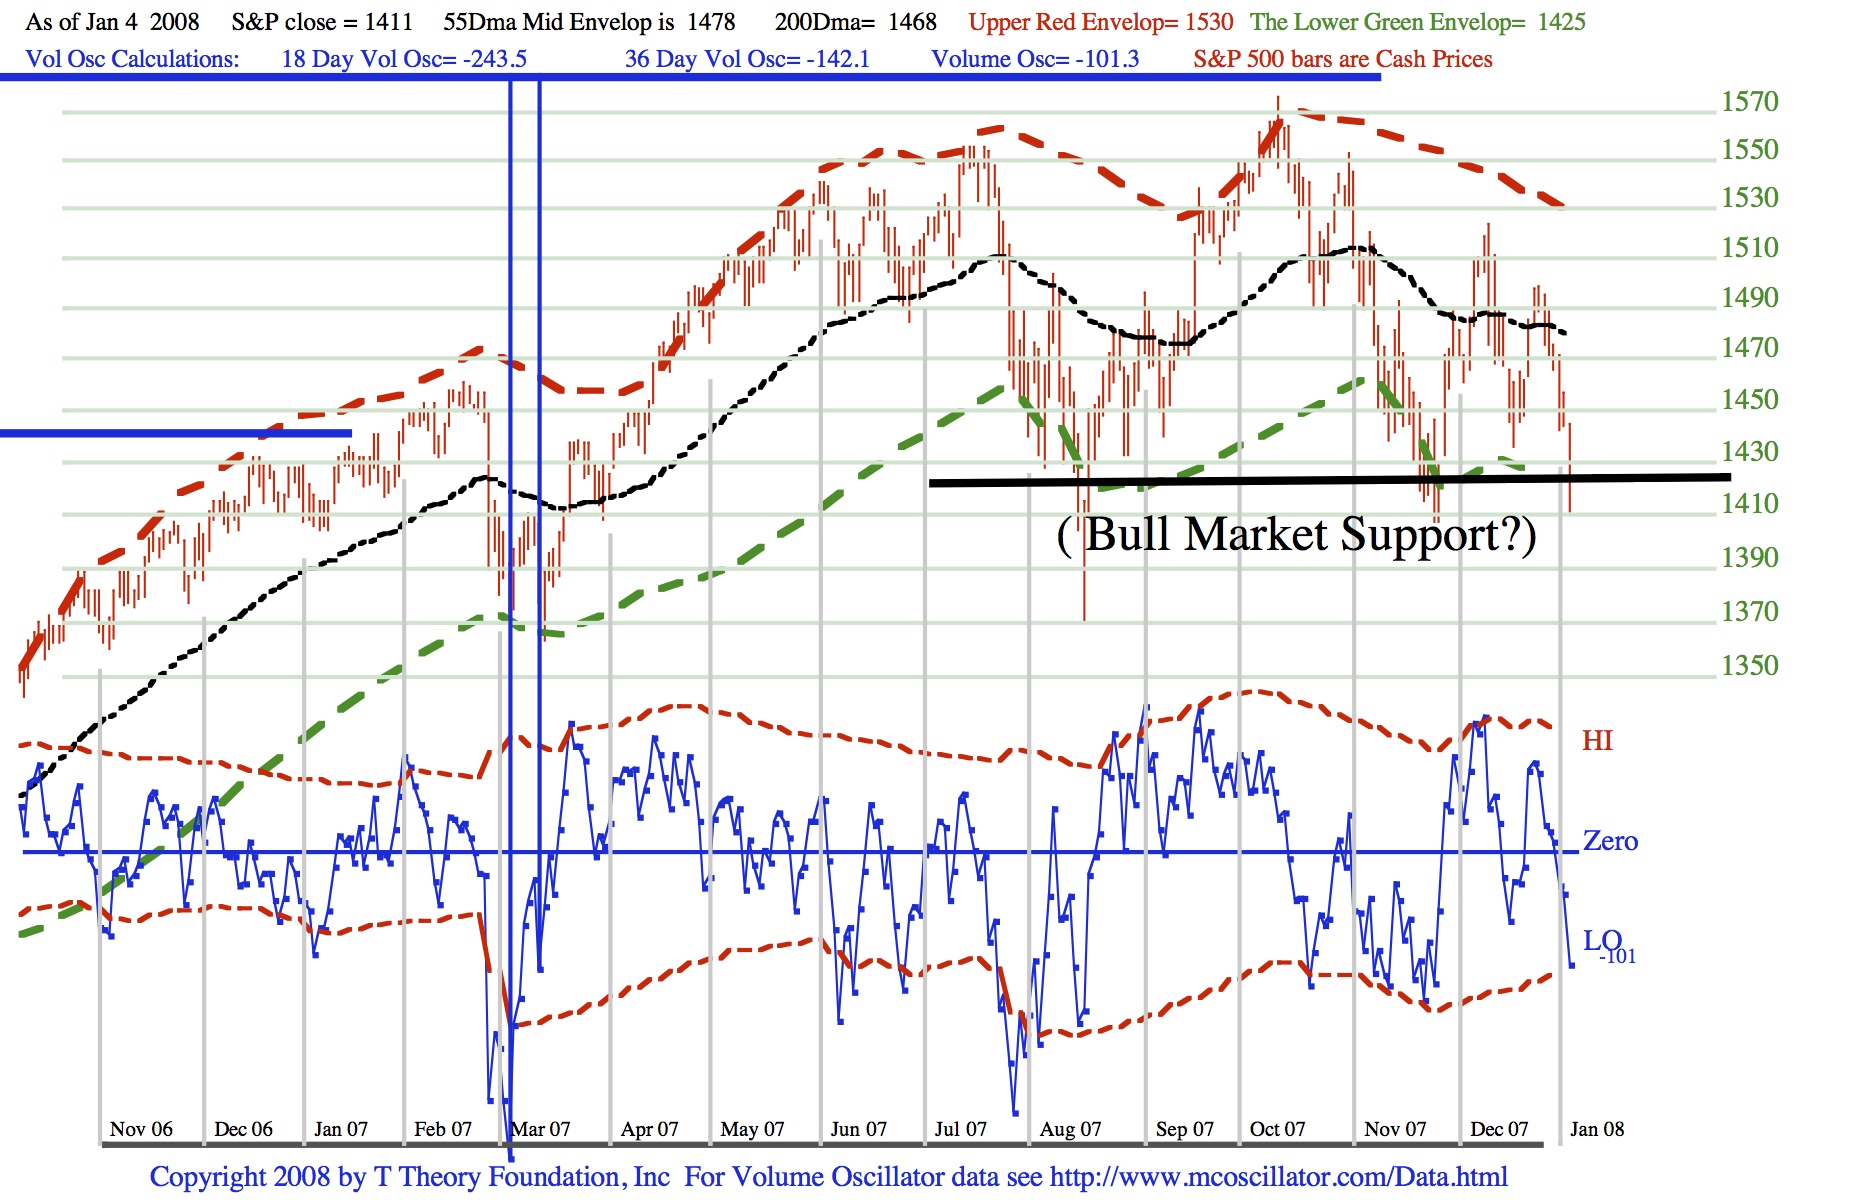
The “Bears” would say this PDF chart shows an “ominous top formation” up around the S&P 1530 + level, while the “hopeful Bulls” might point to a potential triple bottom near 1410, that could be “Bull Market Support”. I say my last small A-D T couldn’t hold the market up, so I expect an eventual break down which will confirm the Long Range A-D forecast is underway. However before we get going with the more serious work, it is worth while letting the bearish confirmation develop next week.
In a few cases the A-D T projection got hung up in a trading range before the major decline in the table got under way. It is always possible the US Gov’t will try to bounce the market from this critical triple bottom level. They could, for example, reduce $100 Oil concerns by opening the Petroleum Reserve or perhaps make a major effort to prop up housing. But I wouldn’t be overly influenced by any rallies at these levels because I think the bear case is fundamentally and historically sound.
By next Monday the outcome should be clearer from this support level, and we can get to work on new Short Range Ts, etc .
January’s Long Term Comments
As we begin the new year I plan to continue Monday morning postings here of the Short Range T and daily Indicator charts in PDF format. Also starting this year I will also post long term charts and table that represents my current research efforts for the very much longer trends, with these charts being posted only at the beginning of each month.
So as we start January 2008 I have posted below my first long term table showing the summary of major swings in the S&P 500 benchmark since the 1929 peak. You may download this table in PDF format and consider some of its long term conclusions. The data is being reviewed for accuracy but I don’t believe there are any serious errors.
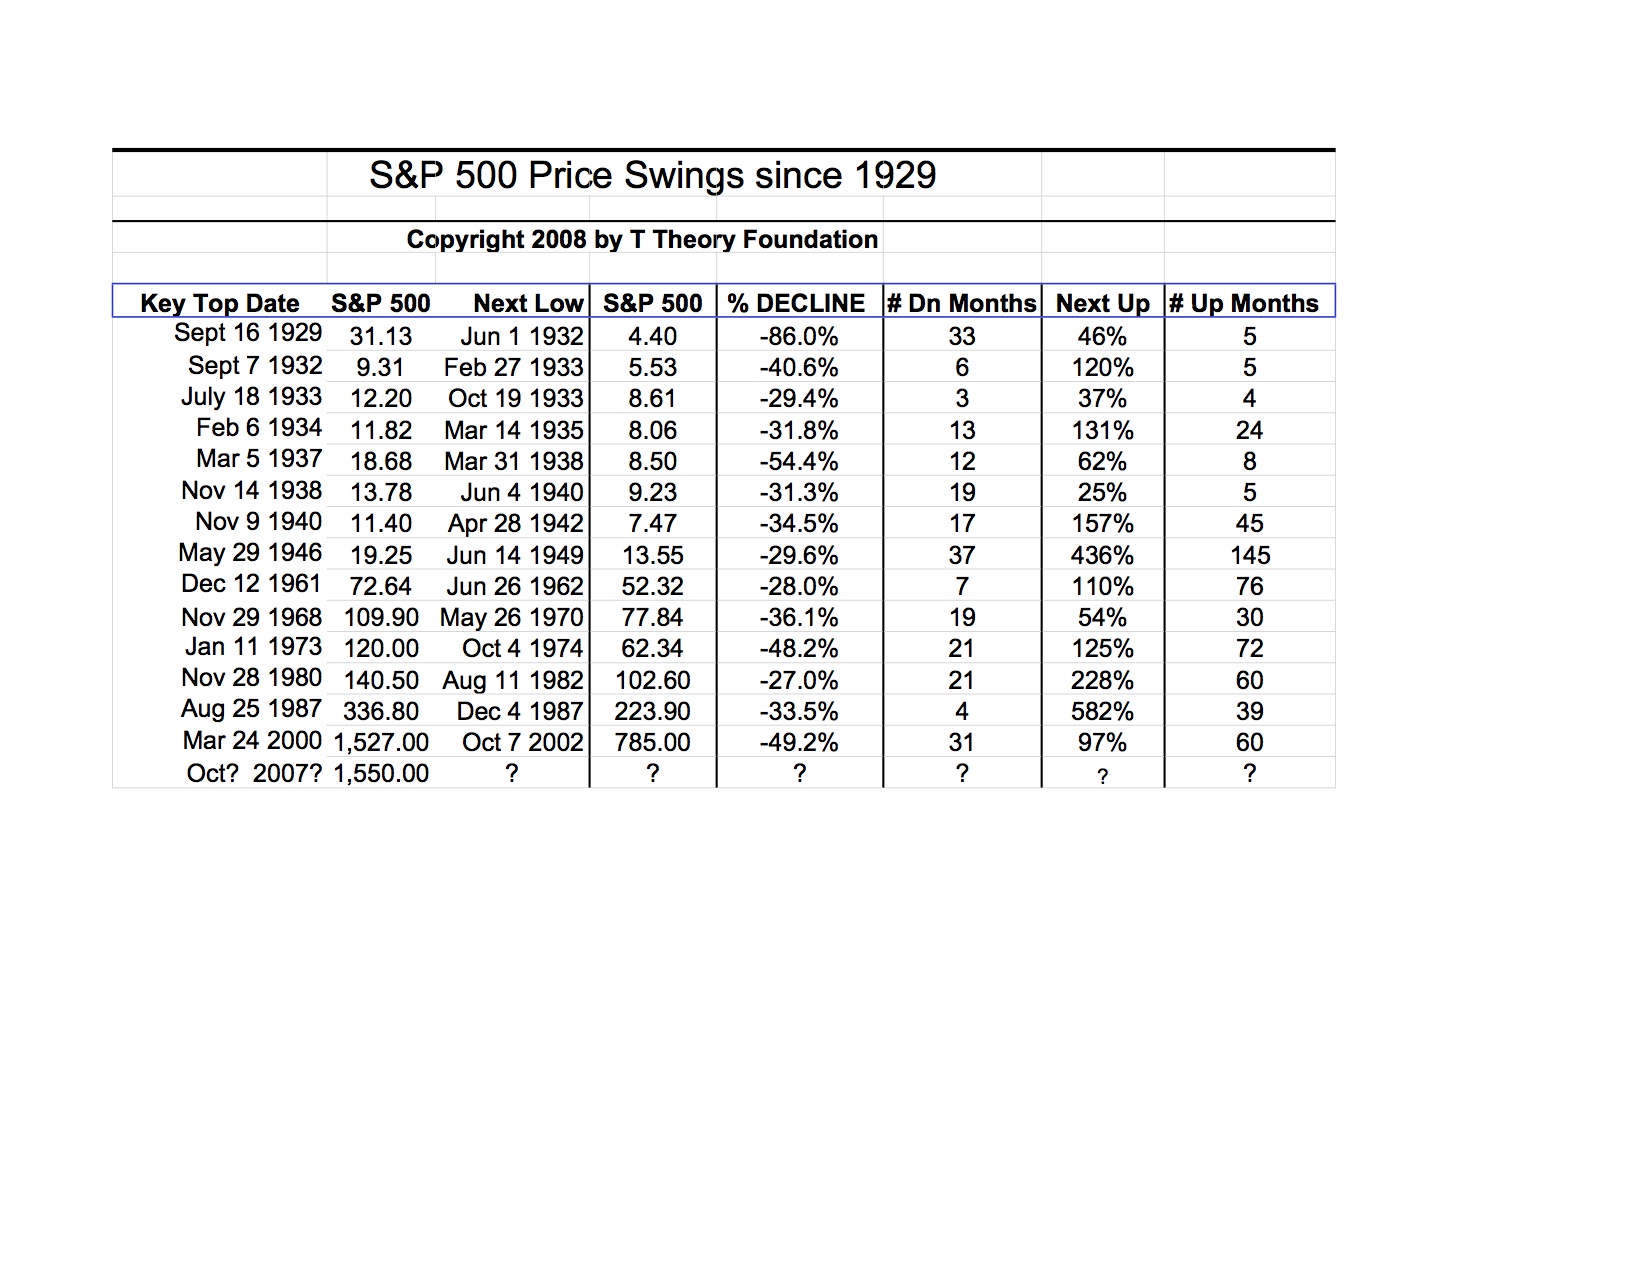
During the year we will be working with my Long Term Mega-Ts and the daily Advance-Decline Ts since 1929 to explain this history. The table make use of the common definition that a bear market can be defined by any 20% decline in the benchmark S&P 500 from a prior peak. This table shows peaks from which there was at least a 25% decline to the next low. The percent decline and approximate number of months to the next low follow. The table then goes on to record the subsequent bull market recovery, summarizing the duration and percent gain in the S&P 500.
As usually the weekly updates will come on Monday morning, usually before the market opens. Terry Laundry
****************************************************************************************
All Rights Reserved By The T Theory® Foundation ©
Order the T Theory® Encyclopedia
For a complete understanding of the T Theory® and how to successfully use Terry’s unique methods, order the Encyclopedia from Paula at the above link. There is additional material in the encyclopedia not covered here. Paula will be more than happy to answer your questions too.
Many thanks to Paula Burke for her permission to re-post Terry’s old T Theory® explanations. The period re-blogged on these pages are some of Terry Laundry’s best work and was published here from public domain.
****************************************************************************************
I claim no credit for the material found under T Theory® on this blog. All of this material is the creation of Terry Laundry and was downloaded from Terry’s free blog site (TypePad). I have created a mirror of Terry’s original material and now there is a second site containing Terry’s T Theory®. One or both of these websites hopefully will survive through time as Terry’s material is too important to be lost to the ravages of time. This site is simply a memorial to his lifetime work.
The page content re-blogged here is exactly as Terry created on his original webpages (saved on my computer with ScrapBook)). Nothing has been left out from the period Dec 2003 to June 2011. From Terry’s site, I made a lot of formatting changes, creating a more easily readable webpage appearance. The PDF chart duplicates of the JPEGs have been omitted for ease and speed of recreating Terry’s pages. References to PDF charts should be ignored (but no chart was left out).
After June 2011, Terry created a paid subscription website. None of that material is found here.
There were many many, many hours spent on this project; downloading Terry’s individual charts & audio files, followed by the uploading of Terry’s charts and audio to my WordPress blog library, after which I had to insert the uploaded material into my new T Theory® webpages (hopefully in the correct places). This was a dull and arduous project and I hope you enjoy it. I don’t believe there remains any more of Terry’s material in free domain, so my T Theory® project is probably finished. If I’ve missed something, you can leave me a comment.
If you find an uploaded reference error (chart or audio in the wrong place), please note the month and year of the webpage, plus the exact name of the referenced error file. Include any other info that will help me locate the problem file and where it occurs on the webpage. Leave a comment for me with the info and I’ll fix it.
Terry’s material is very long and will take many weeks for you to finish. Don’t hurry, it’s not a marathon and you will absorb more if you go through it at a reasonable rate. This is especially true for those who don’t invest in the T Theory® reference encyclopedia. The encyclopedia is a written reference for T Theory® and includes everything of importance for Terry’s T Theory®. Without the reference encyclopedia you must depend on your memory and Terry’s method carries some rules that you could easily violate. The encyclopedia also includes new information never seen on his website.
You are welcome to save any or all of my blog material to your computer. You also have my permission to re-blog my information, but you must (1) credit me and my blog in an obvious manner and (2) don’t change my material.
FYI – I find the best way to save a webpage is using “ScrapBook” (it’s an add-on for the FireFox browser). ScrapBook saves a webpage to your computer EXACTLY as it appears on the day you saved it. You can’t tell the difference between the internet webpage and your ScrapBook saved webpage. The saved pages are not pictures. Instead the pages consist of HTML and page functionality remains identical on your computer. There is also a second method for using ScrapBook, where you can save all of the webpages down to a defined link depth. This optional method means all links will function on your computer to the link depth specified (meaning you can click on links on your saved webpages and tunnel down into pages within pages). Saving the normal way will only save the top webpage but the links that exist could continue to function by taking you to the website on the internet instead of on your computer. But sometimes the linked website doesn’t exist anymore. I’ve had this happen on some very good webpages with unique information (they just disappear into the internet void). That’s a bummer when you lost some really good info and thus rose my need for ScrapBook. You can also filter the pages saved using the optional ScrapBook method, which can exclude all pages not coming directly from the specified website (filtering is recommended using this method otherwise you wind up with a LOT of useless stuff).
.
Explore posts in the same categories: . . . T Theory®
Leave A Reply