February 2008 – T Theory® Update

During February I will continue to focus weekly on the daily chart with updates coming on Monday morning, usually before the market opens. My current major research however is on the 40 year cycle and I hope to introduce this new subject when it is ready later this month or in March. Terry Laundry
T Theory Observations Update for February 25 2008.
For this last week in February I am moving on to a discussion of my pure price Envelope Theory vs pure time T Theory in order to refine the near term outlook using the new PDF file below. Looking at the basic T Theory forecast from a price vs Time perspective is helpful because often one or the other will provide the better insight. This is one of those times as the next week will bring some resolution, but the outcome should be bearish in either case.
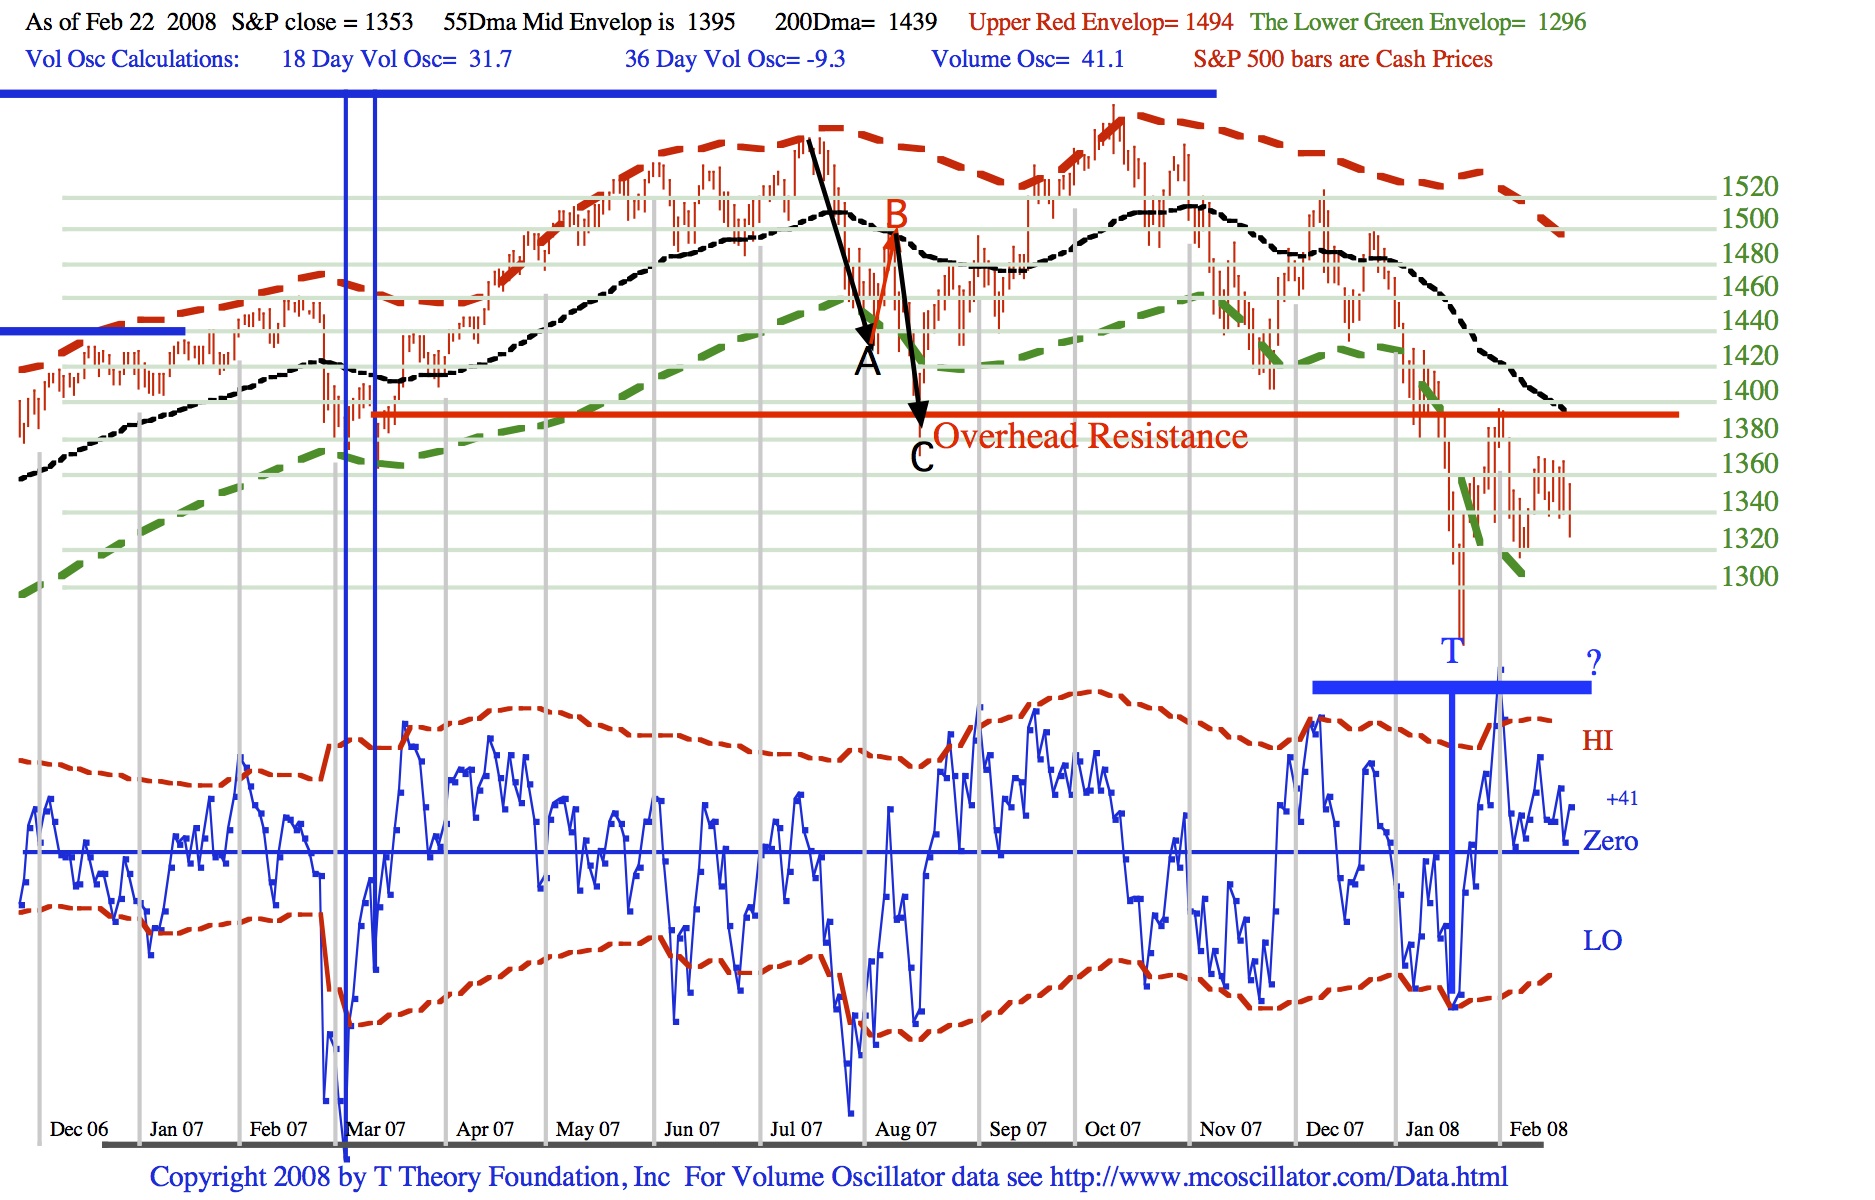
When you download the PDF file you will see the pure price projection of the A-B-C wave leading into the mid August 07 low. In the Blue Volume Oscillator you can see the small T and its pure time projection that calls to an end to the current rally in a week or so. Together these two concept call for some sort of collision in a short time and I want to discuss it before the trigger sets off what could be a new downtrend.
First lets look at the A-B-C wave going into the mid August low. The key here is that after an oversold condition, a recovery via the B wave nearly always occurs up to the 55 Day MA, at which point a new selling wave is sparked by the neutral channel position that attracts a later group of sellers. Historically this pattern is very common and most C waves are a bit scary but runout quickly. However under certain potentially explosive situations where investors have already become very negative about the equity outlook, the spark of selling produced when the up-wave touches the 55 Day MA can produce a 1987 type of selling climax with the help of the large leverage factors inherent in the ever lurking derivative markets.
This is my major concern over the near term because my 40 year cycle study conclude that by the time we reach the next major low in late 2010 we will either have experienced the relatively slow moving 1973-74 bear market or the much faster 1929-32 bear market. I believe the faster bear market is very possible but we would have to consider all the possibilities and how it could play out in this chart.
The simplest case would be to have the red S&P rise to meet the black 55 Day MA in a second retest of the Overhead Resistance line I have placed in the chart. An alternate scenario is to have the S&P move sideways until the declining black line can meet up the the S&P. Either way a touching of the S&P and its 55 Day MA should trigger a new “late selling wave” that will take the market down hard. Because we are in a long term decline the net result will have to be ugly and damaging, but there would not necessarily be any concrete suggestion of a fast bear market.
The limitation of this scenario is that the small T will be ending its support after a week and small Ts usually get very soft in their support in their late stages time-wise. The best they can typically do is promote a “flash in the pan” rally like we saw in the last hour on Friday. This raises the risk that under extreme conditions the S&P will fail to rally back to the 55 Day MA before falling away in a new selling wave that carries it to new lows.
Any evidence that a new decline is unfolding without an upside retest of the 55 Day MA implies an accelerating decline which may in fact be the faster bear market trend. Confirmation wouldn’t come until the S&P fell well below the old January lows and well under the dashed green envelope but the derivative market can make that happen fast, so it pays to keep an eye on these concepts for clues as to what might be happening.
For the present that is about all I care to comment on, pending another week of data. In the mean time these price vs time alternatives should be sufficient to figure out what is likely, and soon enough to make any necessary decisions.
T Theory Observations Update for February 18 2008.
As per my last week’s update, the Nature of the Short Range T picture updated in the PDF file below, has left the market “boxed in” a price range for the S&P 500 roughly defined by the two red horizontal lines Resistance and Last Bear T Low.
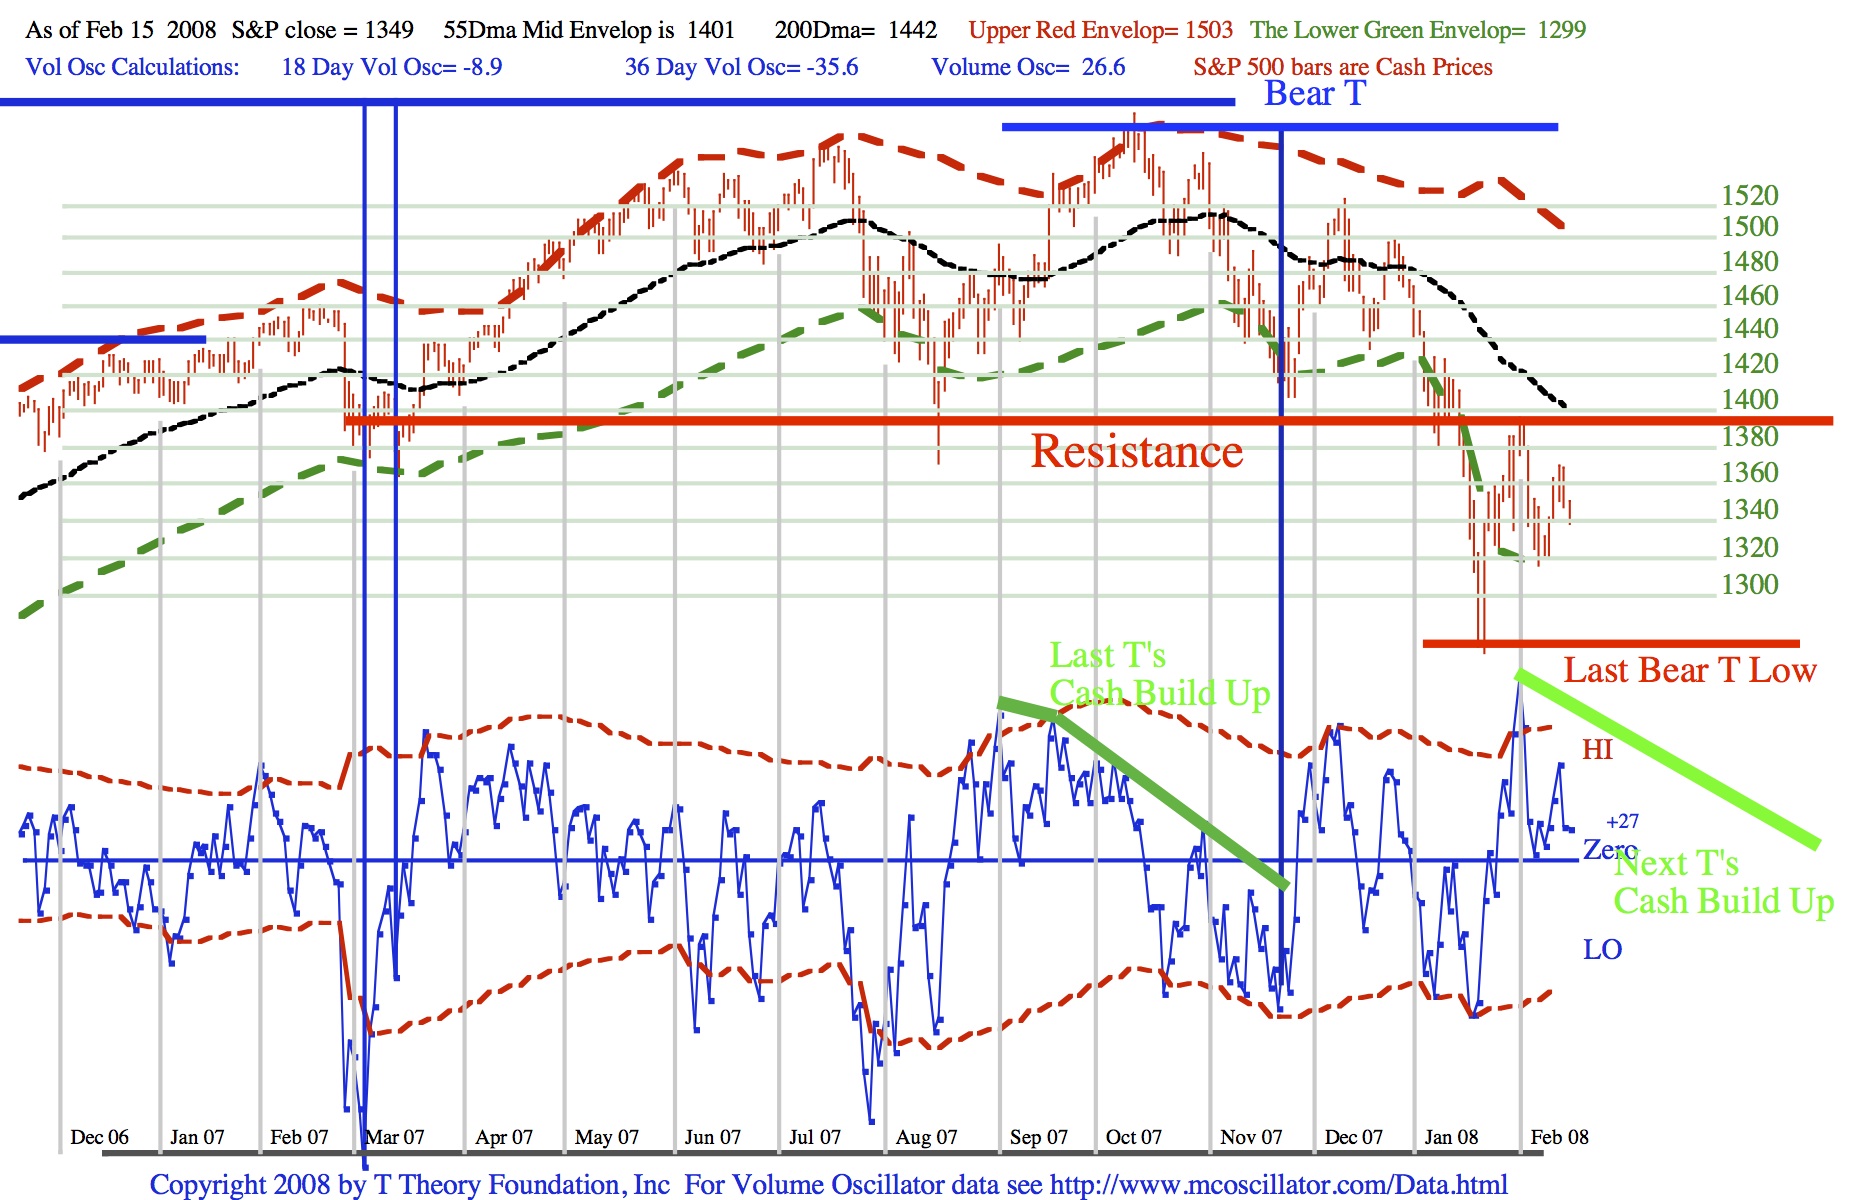
Time-wise the next trend is limited by the fact that a new Short Range T is needed and a few more weeks for the “Next T’s Cash Build Up” will be necessary before the new T will kink off the next phase.
It is true that at some point the new bear market, forecast to begin in the late fall by the larger Advance-Decline T should cause the S&P to fall below the lower red line in order to continue the decline into my projected late 2010 bear market low. However rallies along the way are likely so we need to study the possibilities for both a nearer term bearish and bullish outcome, independent of the longer term trend.
When you view the daily trends over a long period, say from the 1974 low, some of the Short Range T patterns have interesting relationships, however so not much is fixed in stone that we can absolutely count on. Essentially the sequence of Ts that we see in these daily charts evolve to adapt to some larger ongoing requirements which are constantly being buffeted by conflicting factors around the longer term trend.
Generally the adapting nature of the Short Range Ts is made possible by the variability in T behavior. In these daily charts, Ts can either be bullish or bearish in nature. The Bear T collapses in it right side while the normal bull T advances in its right side. This variation in behavior from one T to the next allows a a wide variety of trends to unravel.
However the transitions from one T to the next is generally limited in a bear market to two, and only these two need to be watched for in the weeks immediately ahead, as we await the next T’s Cash Build up to grow in time;
either the S&P declines slowly to the lower support level at the old Bear T lows, and holds these old lows, as the new T gets underway in a strong bullish T that can lift the S&P back up to the overhead resistance
or
the S&P declines and breaks below the Last Bear T Lows and the bear market trend continues to much lower levels, then tries a rally from a lower S&P level.
In either case more time is required, so we can watch the pattern develop.
T Theory Observations Update for February 11 2008.
For this week I am going to summarize some of the serious problems my T Theory sees for the market as noted in the PDF file below. In later weeks I will discuss these concepts in greater detail.
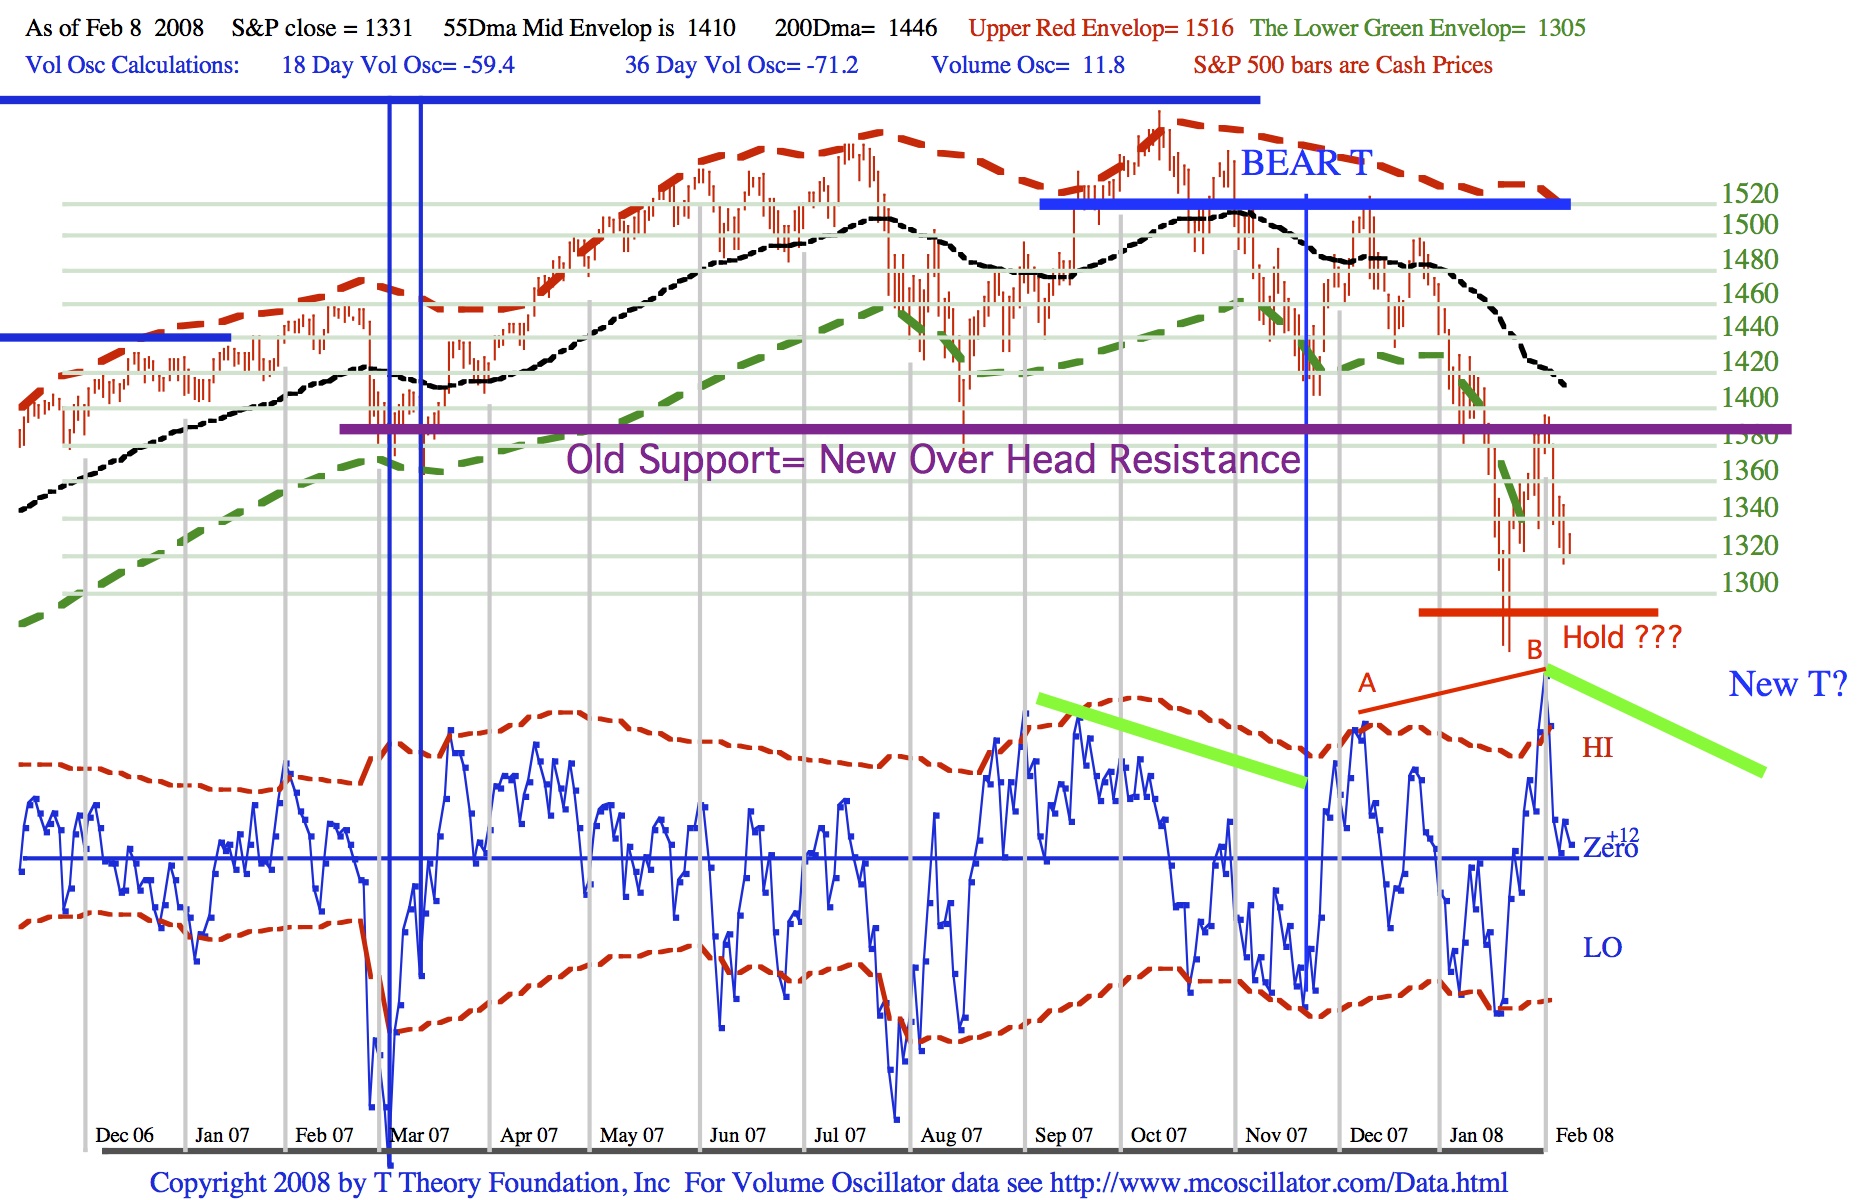
The first and foremost negative was the projection of the Advance-Decline T of a Fall peak last year thereby ending the early 2003 to late 2007 bull market in line with prior discussions. Note the apparent base defined by the Jan’07 and mid August’07 lows was recently broken and will now act as overhead resistance despite the big Fed cuts. Longer term we are therefore in a bear trend estimated to last until the Fall of 2010.
During these long declines the Short Range Ts are forced to collapse within their right side producing the Bear T as noted in the chart. This collapsing allows down trends to be maintained while the T’s time symmetry still tries to project peaks at the right end. The Bear T’s right end rally ran into the upside resistance as noted in the chart and that move has pretty well been exhausted.
The next requirement for a rally will be the formation of a new T’s Cash Build Up phase as represented by the green line extend to the future weeks. These oscillator declines must start from the highest oscillator peak within the right side of the prior T.
Thus the strong rate rally has left the market boxed in both price and time and without any easy way to get a new T started at least for a some weeks. In the mean time the market will try to hold the old S&P lows at noted, but I don’t see how the market can sustain the holding pattern needed to generate a new T while contained in a well developed longer term down trend.
Therefore I would expect an eventual failure to hold the old lows and a continuation of the down trend, probably into March.
T Theory Observations Update for February 4 2008.
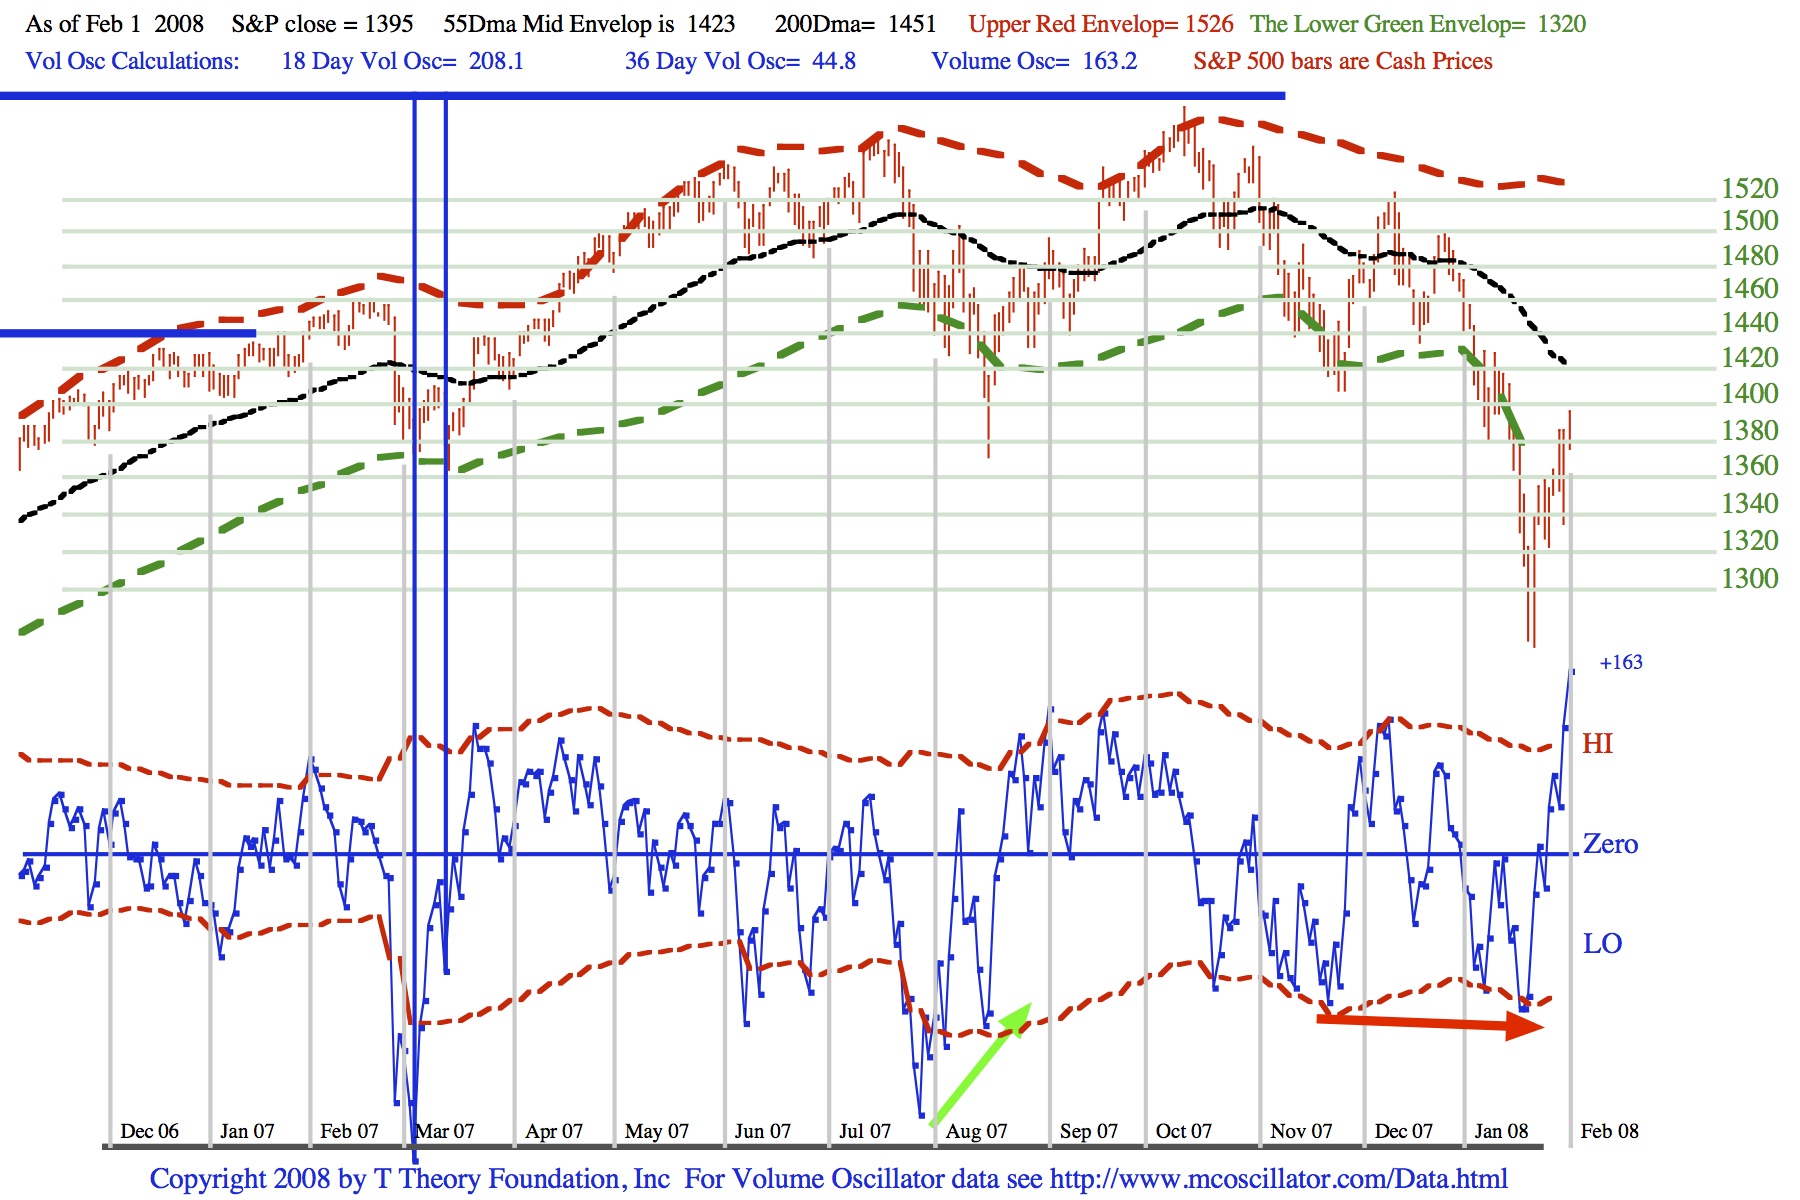
Despite my negative interpretation of the volume oscillator the big Fed rate cuts have triggered a strong initial response. For now T Envelope Theory sees only two practical outcomes; A topping at the 55 Day MA currently 1423, or if penetrated significantly, up to the red dash line as a maximum. I will need another week of data to refine the picture.
You can download in the PDF file below to view the current daily chart.
****************************************************************************************
All Rights Reserved By The T Theory® Foundation ©
Order the T Theory® Encyclopedia
For a complete understanding of the T Theory® and how to successfully use Terry’s unique methods, order the Encyclopedia from Paula at the above link. There is additional material in the encyclopedia not covered here. Paula will be more than happy to answer your questions too.
Many thanks to Paula Burke for her permission to re-post Terry’s old T Theory® explanations. The period re-blogged on these pages are some of Terry Laundry’s best work and was published here from public domain.
****************************************************************************************
I claim no credit for the material found under T Theory® on this blog. All of this material is the creation of Terry Laundry and was downloaded from Terry’s free blog site (TypePad). I have created a mirror of Terry’s original material and now there is a second site containing Terry’s T Theory®. One or both of these websites hopefully will survive through time as Terry’s material is too important to be lost to the ravages of time. This site is simply a memorial to his lifetime work.
The page content re-blogged here is exactly as Terry created on his original webpages (saved on my computer with ScrapBook)). Nothing has been left out from the period Dec 2003 to June 2011. From Terry’s site, I made a lot of formatting changes, creating a more easily readable webpage appearance. The PDF chart duplicates of the JPEGs have been omitted for ease and speed of recreating Terry’s pages. References to PDF charts should be ignored (but no chart was left out).
After June 2011, Terry created a paid subscription website. None of that material is found here.
There were many many, many hours spent on this project; downloading Terry’s individual charts & audio files, followed by the uploading of Terry’s charts and audio to my WordPress blog library, after which I had to insert the uploaded material into my new T Theory® webpages (hopefully in the correct places). This was a dull and arduous project and I hope you enjoy it. I don’t believe there remains any more of Terry’s material in free domain, so my T Theory® project is probably finished. If I’ve missed something, you can leave me a comment.
If you find an uploaded reference error (chart or audio in the wrong place), please note the month and year of the webpage, plus the exact name of the referenced error file. Include any other info that will help me locate the problem file and where it occurs on the webpage. Leave a comment for me with the info and I’ll fix it.
Terry’s material is very long and will take many weeks for you to finish. Don’t hurry, it’s not a marathon and you will absorb more if you go through it at a reasonable rate. This is especially true for those who don’t invest in the T Theory® reference encyclopedia. The encyclopedia is a written reference for T Theory® and includes everything of importance for Terry’s T Theory®. Without the reference encyclopedia you must depend on your memory and Terry’s method carries some rules that you could easily violate. The encyclopedia also includes new information never seen on his website.
You are welcome to save any or all of my blog material to your computer. You also have my permission to re-blog my information, but you must (1) credit me and my blog in an obvious manner and (2) don’t change my material.
FYI – I find the best way to save a webpage is using “ScrapBook” (it’s an add-on for the FireFox browser). ScrapBook saves a webpage to your computer EXACTLY as it appears on the day you saved it. You can’t tell the difference between the internet webpage and your ScrapBook saved webpage. The saved pages are not pictures. Instead the pages consist of HTML and page functionality remains identical on your computer. There is also a second method for using ScrapBook, where you can save all of the webpages down to a defined link depth. This optional method means all links will function on your computer to the link depth specified (meaning you can click on links on your saved webpages and tunnel down into pages within pages). Saving the normal way will only save the top webpage but the links that exist could continue to function by taking you to the website on the internet instead of on your computer. But sometimes the linked website doesn’t exist anymore. I’ve had this happen on some very good webpages with unique information (they just disappear into the internet void). That’s a bummer when you lost some really good info and thus rose my need for ScrapBook. You can also filter the pages saved using the optional ScrapBook method, which can exclude all pages not coming directly from the specified website (filtering is recommended using this method otherwise you wind up with a LOT of useless stuff).
.
Explore posts in the same categories: . . . T Theory®
Leave A Reply