September 2005 – T Theory® Update

September 1 2005 Comments
Next chart update scheduled for Thursday September 8
Comments; The S&P continues to weaken under the 55 Day MA (1215) but the volume oscillator is basing in an oversold condition and the Rydex Cash Flow Ratio is near bullish levels on a contrary opinion basis. There is still time for the Ts rally into late September/early October.
Comments on recent questions posted here.
Art on August 3 asked about the gold indexes. All gold stuff, and natural resources generally, have a very long term bullish outlook, but only Oil related assets are in demand now for obvious reasons.
For John M on August 9, Owning Energy long term makes more sense at this point in time. Mutual fund trader should trade energy.
To Jim on Aug 12. You can send graphics to me via my management company American Shareholders (email: amshar@ earthlink.net), attention Paula Burke president. She will get it to me. I may post your work back here. Do not send questions to her as she is primarily interested in having you open a managed account.
Alexandra on Aug 15 ask about the VO formula. The McClellan site data should correct any mistakes.
For Bob Carver Aug 23 ; I would like to know if Hurst ever published anything in more recent years. My adaptive bands is an advance triggered by his 1970’s discoveries.
For Palresh Aug 21, I will calculate the exact day later in September but it is a late Sept early or Oct projected peak for now.
For James Pollocks The blue volume oscillator can be approximated by McClellan Volume but is only used to compute projected top T dates. The A/D Ts are only based on the simple Advance-Decline Line. See my detailed construction of the T in 1932 etc in past discussions.
For Conor, Aug 25; It is normal for Ts to overlap each out. This is how bull markets can keep rolling along without much correction time. This why the market can go up more that half the time.
For Bob. Aug 25. You can always find an indicator that will project a small T in retrospect. But going forward, the adaptive channels will usually best catch the kinds of peaks in prices one needs to lighten up etc.
Terry Laundry
Chart Update September 8 2005
Next comment update scheduled for Thursday September 15
Palresh on August 21 asked for the projected peak date for the current T. I have done the work and noted the parameters in the chart below. The theoretical projected peak, which may not be accurate, is Friday September 23 2005. If you are planning to lighten up on positions I would take action before the 23rd as the market will likely turn toppy going into the projected top date.
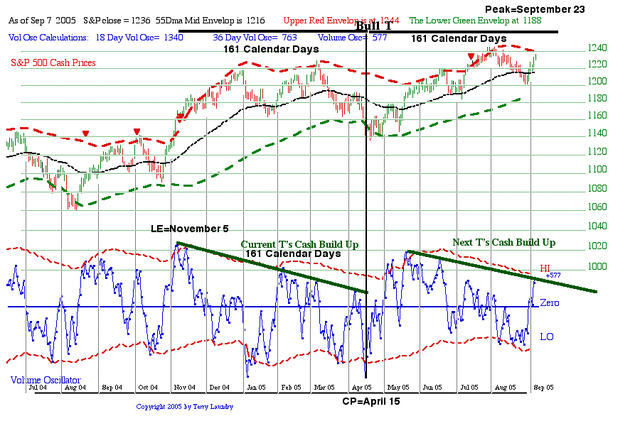
The mechanics of this calculation is very simple if one keeps the data in a spreadsheet because the left end date for any T and the center-post date are easily determined to the very day and most spreadsheets allow a calculation of days between dates which is needed for the eventual projected peak date at the right end of the T.
Of course the theory behind the calculation is that nature has for the last 200 years (at least) been inclined to permit market advances to last only for as many days (or months) as the prior period of what we call Cash Build Up Phase. This is nearly always the period of time that market momentum has been making a relatively shallow descending tops pattern under the green line that defines the time span for the left side of the T. It measures 161 calendar days for this T. So one has to invest the necessary time and effort to at least see the formations that normally define Ts if one is to make progress in T Theory.
Some of the questions posed in August about T construction and behavior deserve further discussion at this time so I will discuss a few ideas that one has to keep in mind if mistakes, based on lack of understand, are involved.
The big mistake most people make is that they draw the cash build up line at too steep. In my last update, before the recent rally, I pointed to the DecisionPoint.com data that fund traders were moving too aggressively into the bear funds. This behavior, from a contrary opinion basis. called for the rally into the T’s projected peak date.
In the time remaining, this same data can be put to good use as a refinement to the T’s simple, and inflexible time symmetry. For example if these same traders suddenly start turning bullish and move money into the bull funds on the mistaken assumption that this rally is the beginning of something really big, then one can anticipate greater problems in setting up the next T’s cash build up phase for a year end rally. They simply will drain the cash build up efforts that are now ongoing in the chart for a new T.
The point is that bear fund flows are the only reliable tool that currently exists to measure short term buildups of money that have a likelihood to act as fuel for the next important rally. Cash built up in money market funds might be a good measure for the very long term but it may not be willing to come back for some years. Bear fund money flows, if they are high, will come into the market on any suggestion of a turn or oversold condition.
So one wants to monitor this key trend as the weeks unfold for clues to the potential damage when this T expires.
Terry Laundry
Update September 15 2005
The S&P is turning choppy in a normal overbought area with some additional time potential. However Gold investments are breaking out this week. I like the Aden Sisters approach as discussed in the article for some 5% or so of ones investments based on the long range bullish T picture into 2020.
http://www.safehaven.com/article-3766.htm
Terry Laundry
Comments September 22 2005
Next comment update scheduled for Thursday September 29
The now expiring Bull T faded quickly after the brief rally into the 16th of September. As per the chart posted earlier, the rally to the upper envelope was rather feeble and this probably suggests further weakness in October. I am not looking for a new low until mid November.
As a note to this T, and its projection of a Sept 23 peak (161 calendar days from the center post location), a charitable interpretation would assume that the Sept 16th peak was the actual date, thus the time projection error was about 5 days out of 161, or about 3%. The time symmetry, which I believe is a natural law never really gets much better, percentage wise, so channel references are usually needed to provide the final clue.
For someone who is a trader, the channel position is a normal day to day concern, and that mindset can deal with the guessing needed to make the final peak decision. But for the rest of us who are longer term oriented, I did suggest that portfolio weighting more towards the market’s major concern ( rising energy prices) was the preferred way to offset the final period of this T. So far market concerns of hurricane Rita economic effects were largely offset offset by rises in energy related investments. However as we run out hurricane worries, Oil should correct and so I see the need for a new hedge opportunity.
Once the market peak is insight it is safe to assume that knowledgeable money will to some degree sense the near term dangers and start looking for a safer and perhaps more profitable new home. The easiest way for most of us to uncover the new trends is to periodically check the Morningstar.com fund rankings for the last 1 and 3 month period at the links I have provided. If “all funds” are selected, the best 50 or so funds out of some 16,000 will be returned and you can look for patterns of strength for clues as to the movement of new money.
Energy dominates this list with Gold recently appearing. This doesn’t prove that Gold is currently being sought out by smart money because it could just be a reaction to near term events. However it is the precondition for a sustainable intermediate Gold T, so it is a reasonable hedge candidate to the projected weakness ahead.
I will look at the downside estimates as the trends develop. However even now the Rate Ts projection is for a low well into November which I think suggest a decline most of us would view as being longer that we might wish.
Terry Laundry
Sept 29 2005 Comments
Next brief comment scheduled for Thursday October 6
The critical point in developing an extended T Theory outlook, beyond the completed September peak, is to initially accept the Rate T’s forecast of a new low between Nov 8 and Nov 21 (my best estimate), then waiting patiently for more data to gauge how the decline and bottom projection is progressing technically.
During October I will be making a very detailed study of the long term rate data from the mid 1990 to the present to see how reliable these projections have been, and whether they might be trusted for the future. There is also the question of Rate T date projection accuracy and I need to detail at least 10 years of specific data by November before making any concrete assumptions. But as it now appears the mid November period (plus or minus) should be a general low. My earlier Rate Study can be seen in the July Archives.
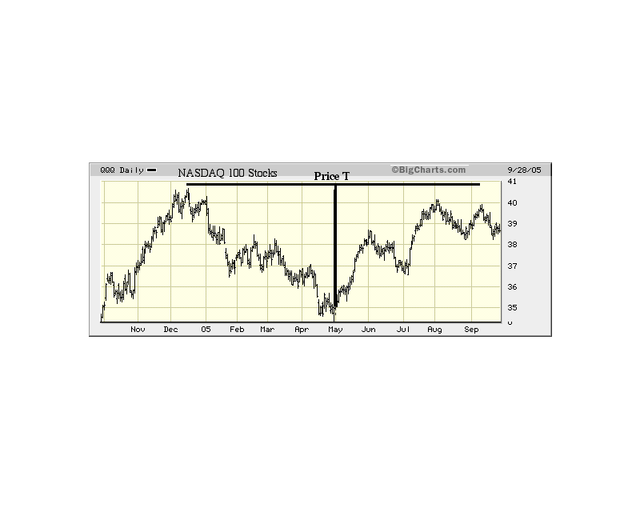
The basic dilemma can be illustrated by the simple Price T sketched in the QQQ chart above. The QQQ index is a trust of the 100 largest NASDAQ tech-heavy stocks which are very savvy with respect to the technical picture. The T illustrates the basic time T Theory symmetry, that is price advances in the right side of the T last only as long as the prior price decline. In this case no volume oscillator is being used to define the cash build up phase that always defines the T’s left side. A simple Price T merely uses the period of price decline as the Cash Build Up phase, not the potentially more sophisticated and often much longer oscillator decline.
Looking at this T’s performance one wonders why a leading indicator such as the QQQ failed to make a new high in the time matching right side. Presumably there are problems looming, and in time, the QQQ trend should roll over into a steeper decline then try for a bottom in November based on the rate Ts outlook.
However at that time it is likely the period of price decline will be fairly short relative to the completed T and if the market is not very oversold the T Theory’s time symmetrical interpretation may not be supportable when interpreted by the volume oscillator. In other words, the next Short Range T may not be of the (normal) bullish type.
My way out of this ambiguity for what we call Oscillator Ts (because the cash build up is defined by a momentum decline instead of a price decline) was to develop the more advanced Rate T concept and its assumed ability to to project the eventual lows based on interest rate projections. Thus far the results look excellent, starting with the 1999 Study, and then continuing its analysis into recent history. However I am sure there are potential problems and possible errors in the interpretation, so I will be spending the rest of this year on this one project so as to better define rate T history and its eventual reliability.
The Rate T concept is potentially very powerful and the details of the concept must necessarily remain proprietary to my company, American Shareholders Investment Corp. But the results and practical applications will be published here as I complete the studies. By mid November I hope to have all Rate T projected low date determined, and plotted on a 10 year history of the S&P so we can see if the concept is worthy of consideration for inclusion into T Theory.
In the meantime I will present some of my preliminary observations. First, rate Ts project correction lows, not bear market trends, so one needs to keep the long term perspective independent of these “potholes” that tend to interrupt the longer term projections. This potential good news is offset somewhat by the evidence that the QQQ can not manage a bullish breakout. A reasonably aggressive investor would suspect their is no technical evidence of a bull market. As a manager I can say the total return on the S&P, running at under 2%, year-to-date, is an additional concern. Nevertheless the current A-D T forecast of an eventual March 200 7 peak looks secure to me. The real problem I think is that the bullish trip to March 2007 will be very difficult emotionally and perhaps financially.
The potential resolution to this conflict is that that Rate Ts, by manipulating long term rates, can persuade investors to sell with sufficient intensity to get the needed cash build up to high enough levels that its low dates ( like mid November) will enforceable. I can’t guarantee this will occur for the November date, but I can not see how it will be justifiable unless there is sufficient selling over the next 6 week to produce a very oversold condition.
Terry Laundry
****************************************************************************************
All Rights Reserved By The T Theory® Foundation ©
Order the T Theory® Encyclopedia
For a complete understanding of the T Theory® and how to successfully use Terry’s unique methods, order the Encyclopedia from Paula at the above link. There is additional material in the encyclopedia not covered here. Paula will be more than happy to answer your questions too.
Many thanks to Paula Burke for her permission to re-post Terry’s old T Theory® explanations. The period re-blogged on these pages are some of Terry Laundry’s best work and was published here from public domain.
****************************************************************************************
I claim no credit for the material found under T Theory® on this blog. All of this material is the creation of Terry Laundry and was downloaded from Terry’s free blog site (TypePad). I have created a mirror of Terry’s original material and now there is a second site containing Terry’s T Theory®. One or both of these websites hopefully will survive through time as Terry’s material is too important to be lost to the ravages of time. This site is simply a memorial to his lifetime work.
The page content re-blogged here is exactly as Terry created on his original webpages (saved on my computer with ScrapBook)). Nothing has been left out from the period Dec 2003 to June 2011. From Terry’s site, I made a lot of formatting changes, creating a more easily readable webpage appearance. The PDF chart duplicates of the JPEGs have been omitted for ease and speed of recreating Terry’s pages. References to PDF charts should be ignored (but no chart was left out).
After June 2011, Terry created a paid subscription website. None of that material is found here.
There were many many, many hours spent on this project; downloading Terry’s individual charts & audio files, followed by the uploading of Terry’s charts and audio to my WordPress blog library, after which I had to insert the uploaded material into my new T Theory® webpages (hopefully in the correct places). This was a dull and arduous project and I hope you enjoy it. I don’t believe there remains any more of Terry’s material in free domain, so my T Theory® project is probably finished. If I’ve missed something, you can leave me a comment.
If you find an uploaded reference error (chart or audio in the wrong place), please note the month and year of the webpage, plus the exact name of the referenced error file. Include any other info that will help me locate the problem file and where it occurs on the webpage. Leave a comment for me with the info and I’ll fix it.
Terry’s material is very long and will take many weeks for you to finish. Don’t hurry, it’s not a marathon and you will absorb more if you go through it at a reasonable rate. This is especially true for those who don’t invest in the T Theory® reference encyclopedia. The encyclopedia is a written reference for T Theory® and includes everything of importance for Terry’s T Theory®. Without the reference encyclopedia you must depend on your memory and Terry’s method carries some rules that you could easily violate. The encyclopedia also includes new information never seen on his website.
You are welcome to save any or all of my blog material to your computer. You also have my permission to re-blog my information, but you must (1) credit me and my blog in an obvious manner and (2) don’t change my material.
FYI – I find the best way to save a webpage is using “ScrapBook” (it’s an add-on for the FireFox browser). ScrapBook saves a webpage to your computer EXACTLY as it appears on the day you saved it. You can’t tell the difference between the internet webpage and your ScrapBook saved webpage. The saved pages are not pictures. Instead the pages consist of HTML and page functionality remains identical on your computer. There is also a second method for using ScrapBook, where you can save all of the webpages down to a defined link depth. This optional method means all links will function on your computer to the link depth specified (meaning you can click on links on your saved webpages and tunnel down into pages within pages). Saving the normal way will only save the top webpage but the links that exist could continue to function by taking you to the website on the internet instead of on your computer. But sometimes the linked website doesn’t exist anymore. I’ve had this happen on some very good webpages with unique information (they just disappear into the internet void). That’s a bummer when you lost some really good info and thus rose my need for ScrapBook. You can also filter the pages saved using the optional ScrapBook method, which can exclude all pages not coming directly from the specified website (filtering is recommended using this method otherwise you wind up with a LOT of useless stuff).
.
Explore posts in the same categories: . . . T Theory®
Leave A Reply