October 2005 – T Theory® Update

Reply to Comments October 3 2005
Here are my replies to recent September questions grouped by topic. Terry Laundry
————————————————
Hi Terry:
I see that the energy stocks continue to exhibit great strength in the face of market weakness. Many energy stocks have doubled and tripled this year and gone up considerable more since early 2003 when then trend began. The energy sector including the oil stocks appear to me to be in the early stages of a multi year run up. Does this notion fit with your T theory research? A
Hello Terry Have you ever done a T Theory on the Oil sector and I wondered if that is pointing to a top now also? Gloria
Hello Terry,
Based on your T-theory work on gold, even though we are on the rising side of the 20-year T, from your diagram, it looks like we should be falling off a short-term T whose center post was early in 2000. Based on this T, the projected top should be around now. From my understanding, shouldn’t we be entering a cash build up phase in gold with a decrease in price? Thanks Steven
Oil is bullish very long term. The CRB/Gold T is better considered as a Natural Resource T that projects strength from 2000 to 2020. This would include Oil, Natural Gas, Uranium, Tar Sands and other alternatives to petroleum (solar?) and precious metals, and even the most basics; water companies, well positioned land, etc.
At some point I will put up a 33 year chart of Gold vs the S&P500 which points out the wisdom of watching these two alternatives (basically Natural Resources vs Financial Resources) to see which has the better opportunity to grow. Starting in 1972 and putting equal amounts of money in to these opposite investments one would have seen two very divergent trends over the next 30 years but by 2005 the overall results would be nearly identical. So history says you should watch and consider both. T Theory suggests the better investment will always be the one that is just beginning to break out of a longer period (1-2 years) of relative weakness referred to in T Theory as the the cash build up phase. You can often see this in basic charts.
The technical condition for gold can best be seen by viewing its trend against it own 65 week moving average. It is well above its 65 Week MA right now, so it is quite overbought presently. On the other hand when viewed over the years from the major 2000 low, we saw a strong early stage, then a consolidation for almost 2 years (a more recent cash build up within the right side of the bigger T) with a possible upside breakout now occurring. If so, gold which has proved somewhat disappointing in recent months, could now start doing better. A reasonable interpretation of this conflict is that Gold you own should start to act better longer term, but you don’t have to buy it here, while it is overbought.
The bigger and much more complex possibility that could really upset someone’s apple cart is the possibility that the natural resource trend into 2020 will be characterized by a rotation of interest because the 1980-2000 cash build up period can not supply growth to all the alternatives natural resources simultaneously. A possible bad case is that, if Oil became strong in 2003 when gold started resting, then perhaps if gold or other alternatives start strengthening, Oil might start to rest. This really has to occur over the 20 year projected up trend for natural resources since sector rotation within a very long term bull market is a well known, common historical behavior.
My suggestion for one who is interested in the Natural Resource sector generally is to study the alternatives, not just the one favorite one owns, reading about their relative advantages and uses in order to gain a much broader perspective. The Big T will likely get around to all of them in time by 2020. When something you like looks be to breaking out of a resting phase, I would buy a token position and hand on to it for some months to see what’s up. This way you will start to diversify, and if lucky, will start you might start moving your more diversified portfolio closer to the “next big thing”.
As an additional suggestion, with my new Rate Ts forecasting of a coming correction, I would sell some portion of anything I owned that was overbought and might be ripe for profit taking, or something I no longer wanted, in order to have the cash available (in a month or two) after a correction provides a new buying opportunity. In many cases the new correction will reveal a great deal about what is happening and provide the insight as to what’s hot and what’s not. You will likely need the cash at the next low so lightening up at a T projected peak area will probably work out fine.
———————————————————
Next series of questions on indicators
—————————————————————–
Hello terry,
Do you know where I could find reasonable indicators to monitor the contraion opinion? sincerely, marc
Hi Terry, and thank you for your hard work and generous sharing of quality information.
Regarding Bear Fund money flows, where should we look to see this activity? All the Best, Craig
See http://www.decisionpoint.com, Rydex Cash Flow Indicator. Cost is $20 month. I think the new Rates Ts will be a better solution because it is more specific in the warning. Will start discussing this aspect in October.
———————————————————–
Next series of questions on the projected correction
———————————————————————————-
Terry, I applaud your work and look forward to your weekly comments. Can you recommend a course of action for one to profit in the markets in the 6 week period you have alluded to?
Thanks, Bill
Terry, To clarify, I understand that the posts imply that in the near term (around sep-oct) we will have a pullback but I am a little confused as to what T Theory implies for the period after that. You had mentioned in earlier posts the likelihood of a year end rally (post about years ending in 0 and 5). Is that still the direction or are we now heading into a pullback to the T center post through next year ? Thanks. Jason
Terry, I’ve been following your work since before the crash of 1987. I find your analysis of great value. My question now concerns what you see for the balance of the 3rd quarter and 4th quarter. After listening to your pod-casts and reading your most recent comments. I’m a bit confused as to what you see for the balance of the year. Is T Theory suggesting that the market will top sometime in late September and early October to be followed by a fairly healthy correction, i.e. 10% or more. Or, is T Theory indicating a new T is generating and going to overlap the currently fading T, leading to a rally that will, like last year, lead to an immediate rally that carries into year-end. Kevin Sept 3
Hi Terry, I’ve been following your commentary for many years with great pleasure and interest. At this time, with the possible emergence of another T, I don’t see the necessity for a top in late Sept. early Oct. Since I have been following the mkt. since ’78 (as a student, of course), I’m thinking that what is influencing you is the experience of such years as ’78 and ’79 when the tops happened late Sept. early Oct. and the following sell offs in Oct. were so alarming… yes, I agree that with Oil flying (then, it was Gold) we can easily see that October Massacre sceneario… only I don’t think that we need a run-up now in order to set it up… we could just sit here for a few weeks and then sell off …anyway, it sure will be interesting to see what develops… regards, Mario
On Thursdays regular update I will summarize my Rate T forecast which looks for a significant, but not necessarily traumatic decline into November that will provide a pre year end oversold condition. This oversold low will help to sustain a rebound for the market that will be in line with the Advance-Decline Ts longer range forecast of a rise from the 2003 low to an eventual early 2007 peak. However I judge the decline as being more severe than I would like to see, partly because the Fed is going to raise rates further than anyone wants, in order to control the overflow of energy price increases into the general inflation measures they watch.
Also I can see T constructions in the long term charts (to be posted Thursday) that looks suspiciously toppy to me, with a possible steeper drop once investors see the correction process has started to unfold.
The main thing is too raise some cash so that as the trends unfold over the next month or two, you will be able to take advantage of the situation and not feel forced to sell as the trend deteriorates.
More on Thursday. Terry Laundry
October 6 2005 Rate T Update
The correction successfully projected by the Rate T concept struck hard this week pushing the S&P 500 down to its 39 week MA (1200-ish) which usually acts as bull market support. Nevertheless I think there is the increased downside risk that this key technical level will fail to hold due the over riding influence of the Rate T concept.
Research is progressing and I have detailed a number of the Rate Ts sketched in my 1999 study (see July Archives)
I also have a better understanding of how they work and recognize you don’t want take the Rate T’s projected date (Nov 9th) as a reliable estimate of the correction low estimate.
Basically Rate Ts work by punching up 30 year rates suddenly such that the balance of power between the market’s prior expected long term equity returns and the now newer and higher 30 year bond rates become “unbalanced”. This shift requires a readjustment of expected equity for the decades ahead. To increase the equity return over the next 30 years to match the bond shift, the current level of stock prices must drop enough such that new money being invested at the more attractive valuation will be able to justify an extra rate of return on equity that off set the bonds advantage.
Because rate T’s can force changes to long rates near their projected peak date, the concept is a powerful predictor of upcoming corrections and this appears to be true historically from my research so far. The problem in trying to get more specific is that the downside shock always triggers an avalanche of selling, but the magnitude really can’t be known.
I did research the last Rate T in the 1999 study which was calling for a year 2000 correction and was able to see that the precise date was at the end of March 2000. In that instance, the dot com bubble peaked March 17th and the avalanche of selling dropped the NASDAQ about 30% over a few weeks. From that example I would conclude the major casualty will be stocks that have had big run ups and especially any speculative sector which might have high levels of margin buying.
By my next Thursday’s update I think we will have seen enough of the selling to characterize it and make a better judgment as to how the correction might play out eventually.
Terry Laundry
October 13 Update
Next Update scheduled for Thursday October 20 2005
Research on the Rate Ts has nearly been completed as far as their projected low dates for the market from 1994 to the present. The concept is extremely powerful and will require that I re-write the book on T Theory. It has vast implications for both long term multi-year bear market low projections as well as for the shorter-term corrections like the one we are now experiencing.
The current Rate T has been warning of a correction that might bottom a week or two into the month of November, and now, I think we have seen enough to start looking at the probable or possible outcomes for this next low. The Short Range chart below notes the key points that need to be watched as we move into November.
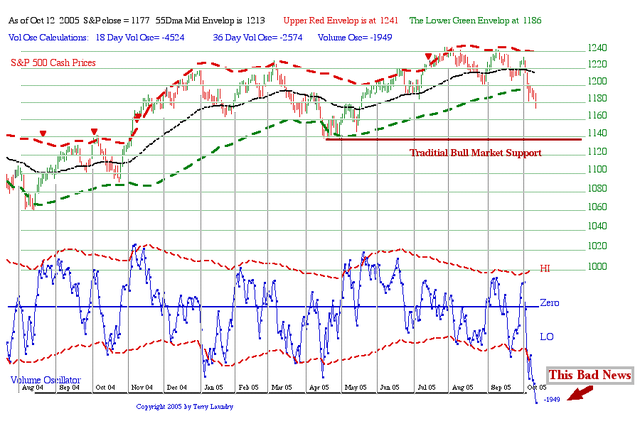
The main point is that the blue volume oscillator in the lower portion of my daily chart has fallen off the bottom of the normal history which is “Bad News” for the bullish trend. It implies that investor’s main concern is that the Fed will be raising rates at least into year end and probably into the later January meeting. This is becoming viewed as a negative that can’t really be offset by an oversold condition. The difficulty is that the negative environment extends over time and most long term investors won’t want to take new positions right now in the face of a longer term series of negative rate hikes.
My best guess is that trader rallies will fail to gather any strength near term, and the S&P will have to fall to the Traditional Bull Market Support level for an ongoing bull market. This is roughly the old April low as noted in the chart around the S&P 1140 level. If we see that level reached, and investor confidence doesn’t improve, or even worse deteriorates further, then I would expect a brief panic selloff under the normal support at 1140. This doesn’t have to be the only scenario and it doesn’t negate the eventual A-D T rise to an early 2007 projected peak.
The advantage of a panic ending is that any serious sign of instability in the US market will travel quickly around the Globe and central bankers will suddenly fear disaster and reverse their policy away from fighting inflation, and towards halting a slowdown. This is ideal for the investor because he or she can simultaneously gain the two historical advantages of falling interest rates along with depressed equity prices.
This combination would produce a new bullish T in this short term chart and it would provide the single most powerful outcome for the current situation from my T Theory perspective.
Terry Laundry
Rate T Forecasting
This week I am summarizing my Rate T concept which I believe will usher in a new era for my T Theory. It makes the ideal starting point for a beginner wanting to get into T Theory because it provides simple, direct conclusions that have worked very well in the period since 1994, yet it does not require any oscillator calculations.
I will use this summary to get started on this lengthy rewrite of my T Theory and use Rate T principles to comment on the recent rally from the oversold condition, as a topical example of its general conclusions. Also I will respond to some recent reader requests as I upgrade my T Theory presentations.
The two reader requests that I am addressing on a priority basis are:
1. An improvement in the quality of the graphics and
2. An easy starting point for the novice who wants to get started in T Theory.
The first request is now being answered by introducing the use of an Adobe PDF high resolution file which I have placed at the end of the the weekly commentary. It requires your computer have a copy of Acrobat Reader, but all computers have it pre-installed so hopefully you won’t have any problems opening the file. Of course it is always a good idea to include a low resolution graphic that is compatible with the internet’s so I am including a lower resolution copy below. But for the future, the better graphic will always be included as a PDf file at the end of the commentary. Just click on the link and your computer should receive a better quality copy.
For this week’s commentary on the Rate Ts the graphic differences are not so dramatic because time constrains have dictated that I use my old “fuzzy” chart from the July Archived file as the basis for my up-to-date research. However I am developing a very high resolution program which is approaching a useful state and these higher resolution charts will be introduced before November 9th, the next critical date for a projected market low based on this Rate T history.
The main conclusion to be emphasized this week is that Rate based Ts provide a more complete, more reliable view of when key market lows are to be expected. It does so with very advanced warnings and seems to side step most of the complex issues that make the interpretation of the volume oscillator Ts ambiguous in their early stages. However this history also makes it clear, that in order to avoid getting involved in the market’s most serious traps, it is key that one wait until the Rate Ts projected date for a market low to be honored. Complex issues for the short term view, like that one views in the recent daily chart postings, are best delayed until the Rate T’s specific projected date has been experienced (Nov 9th). Only then can one see the essential consequences that allow an unbiased view of the market situation and its probable outcome.
Some will be impatient with such a delay, but the historical record shows it is wiser to wait for the projected date ( e.g. Nov 9th). Two of the big T examples in the chart illustrate the forward looking aspects of Rate Ts. When in error on details, they still tend to be a bit early in their projection of a market low which is an advantage because it gives additional time to sort out the real world implications of its mechanical forecast. This property suggests we can wait until the next projected low and not worry that the market will take off early, leaving us to chase any new bull trend.
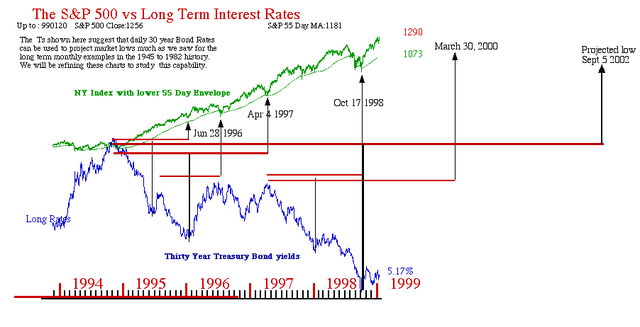
Looking at the broad history of the chart, the evolution of the Rate Ts shows the key 1994 peak for the 30 year bond Rates which begins the Rate T process. This starting point allows the construction of a whole series of impressive Rates T forecasts as the history unfolds into the 2002 period. I have spent considerable time over the last week computing each possible Rate T’s projected of future market low date. I am satisfied that these Ts provide the best all around warning of an important correction without getting bogged down in petty details that invariably confuse the issue, and so prevent one from focussing on the essential money making opportunities. For example, starting from the 1994 peak in 30 Year Bond Rates, to the end of this interest rate data in 1999, I note that all serious market corrections in this history are correctly projected with a long lead time.
Looking at the two big Rate Ts that run off this equity market history, I see what is the most compelling argument for making Rate Ts the top priority for T Theory. The longest T uses this 1994 to 1998 history to reach out with a bottom projection that goes beyond the coming year 2000 peak, and on to the bear market low of late 2002. Specifically this largest T projects a Sept 5 2002 low. While not technically a most precise estimate, it is close enough to the market’s momentum low to rank as a remarkable projection, given that the projection was derived from interest rate data in such an early period.
The second projection which greatly enthused me for this concept is the Long Rate T projection of a March 30 2000 low for the market. Again, this date is not very precise. But in the bigger scheme of practical warnings, it has the isolated singular date that correctly “red flags” what is to about to become the bursting of the dot-com bubble at its actual Peak of March 17, 2000, two weeks earlier than the projected low of March 30. The actual market low didn’t occur until a full month after the projected March 30th low, but from a practical stand point I view this Rate T, which was in place coming out of the 1998 low, as extremely helpful in warning of the March 2000 dot com bubble break down. Even today, 5 years later this collapse in the tech sector is exerting a negative influence and I am impressed with this concepts then forward looking projection.
I should mention that conventional T Theory at the time had a long range forecast of a June 2000 major top. As the year 2000 got underway a Short Range T projected a rise into April, maybe May 2000. So at that time conventional T Theory was pretty secure in its conclusion that a major top would occur in the year 2000, maybe in the April, May or June time period. Naturally when the severe March collapse came, I was devastated. I saw the need to restructure T Theory for the new environment in the post 2000 period. The premature March 2000 peak was not a problem with respect to the long range forecast which was derived from the 1987 low. The long term June 2000 peak was a projection made over a 12 year period and so a time error of a couple of months was not a serious concern. The more serious concern was that of the Short Range T forecast which at that time was seriously “gutted” and proved deceptive and therefore unreliable in a critical situation.
Since then I have harbored a suspicion that Short Range Ts are not completely reliable in critical situations and some higher concept was probably interfering with its projections. I now realize that the Rate Ts are probably the over-riding T Theory concept and that it is best to honor their projected market lows dates as a first step in any Short Term forecast.
So to wind up this week’s discussion, let me summarize what the Rate Ts have to say. Following the September 2005 top based on conventional Ts, we have a Rate T projection of a market low around November 9th or 10th. History says that it is best to wait until this date just in case there are some unpleasant surprises that could come out over the next three weeks. This doesn’t mean we don’t want to eventually do the refinement of the forecast in my traditional daily chart. It simply means we need to wait a few more weeks to let any surprises filter into the daily market trends before we start a detailed analysis of the recovery process.
Looking ahead, a more complete study of the Rates would clearly make a good starting point for an introduction to T Theory. This I will do in future reports. In the mean time the 30 years bond rate, which is key to the forecast, can be obtained from the link at the lower left in my “Web Links”.
In my next report I will expand on this powerful new direction for T theory.
Terry Laundry
Outlook October 27 2005
Next Update scheduled for Thursday November 3 2005.
This week I am summarizing my thoughts relative to the Short Term Daily chart below. The fuzzy graphic is placed below but a higher resolution PDF file is available at the end of this posting.
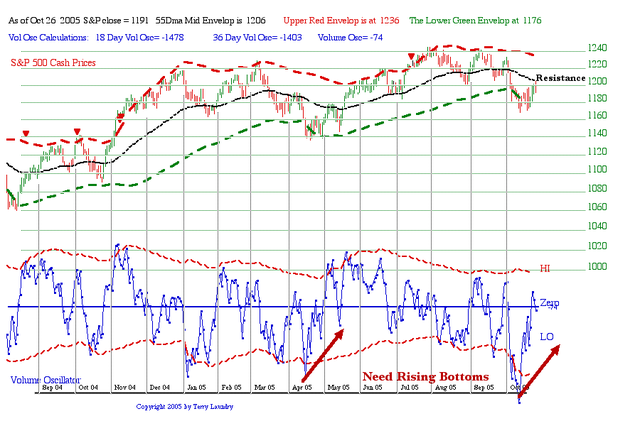
The first point is to remember the Rate T saw an upcoming correction in September that might bottom around November 9th. There is no reason to believe this date is completely accurate, except to say that if the market wants to extend its decline to much lower levels than what we have seen so far, then it should be come apparent by November 10.
Notice there is no Short Range T or green Cash Build Up period defined in the blue Volume Oscillator. None is necessary at this stage. This is to illustrate that once the Rate T projection of a low date has been accepted, and the A-Decline T’s projection of a general advance into an early 2007 eventual peak is also accepted, then the exact place or type of new T (bullish vs bearish) need not be considered.
The only critical point is the identification of a bottoming process. This is almost always made evident by a series of rising oversold bottoms in the blue volume oscillator much as was seen at the earlier April low. Rallies that start appearing from these bottoms will normally fail at the S&P 500 black 55 day moving average which we already know ahead of time. So much of what is going on right now is not a mystery. The S&P bounced from an oversold condition and now looks to be topping near the black 55 Day MA Resistance level in the center of the adaptive channel.
The critical issue is whether a new decline might see the S&P fall below its recent low perhaps back to the April low, or below. Of course the market could dig in near its recent low which would doubtless cause a rising oversold bottoms pattern to begin the confirmation process of an upturn and therefore a new T developing to extend the bull market. This remains to be seen, but the history of the Rate T’s is that sooner or later, relative to Nov 9th, the decline must end and a new advance must follow.
Furthermore if one looks at the history of Rate Ts one sees that once a Rate T’s correction is technically seen to be over the bull market will resume until roughly some 1 to 2 months prior to the next Rate T projection low. This is known to be in the Fall of 2006 so the remainder of the forecast will be very straightforward. Technically it would not require any consideration of the exact placement of any Short Range Ts.
Of course this still leaves open the possibility of a very sharp decline as the S&P turns down from here over the next few weeks. It is negative that the 30 year bond rate has broken today to new highs at 4.80% with a daily rate increase of some 1.76%. The rise in rates makes equities look relatively more expensive so a decline in stock prices of some 1.76% might be called for to restore the fundamental balance between long term bond and long term stock values.
I don’t believe this relationship is that simple or direct, but certainly if 30 year rates head up to over 5.00% over the next few weeks, additional negative pressure should be forthcoming and selling pressure in stocks ought to be increased to the point new market lows might be expected. Furthermore, it might be logical to expect long rates to start dropping before a real low is seen, since dropping rates would make stocks look cheaper and encourage a new up trend.
So knowledge of the Rate Ts projected low date, a simple volume (or other oscillator), and a monitoring of long interest rate trends may be all that is needed to eventually anticipate a November low.
I will be busy with my Management Report duties over the next week so updates may be delayed. You can review a sample copy of a recent report at our sister site which is being ramped up now. The link for American Shareholders is in “my web links” at the left. The PDF report confirms the three Rate Ts for the recent past.
Terry Laundry
****************************************************************************************
All Rights Reserved By The T Theory® Foundation ©
Order the T Theory® Encyclopedia
For a complete understanding of the T Theory® and how to successfully use Terry’s unique methods, order the Encyclopedia from Paula at the above link. There is additional material in the encyclopedia not covered here. Paula will be more than happy to answer your questions too.
Many thanks to Paula Burke for her permission to re-post Terry’s old T Theory® explanations. The period re-blogged on these pages are some of Terry Laundry’s best work and was published here from public domain.
****************************************************************************************
I claim no credit for the material found under T Theory® on this blog. All of this material is the creation of Terry Laundry and was downloaded from Terry’s free blog site (TypePad). I have created a mirror of Terry’s original material and now there is a second site containing Terry’s T Theory®. One or both of these websites hopefully will survive through time as Terry’s material is too important to be lost to the ravages of time. This site is simply a memorial to his lifetime work.
The page content re-blogged here is exactly as Terry created on his original webpages (saved on my computer with ScrapBook)). Nothing has been left out from the period Dec 2003 to June 2011. From Terry’s site, I made a lot of formatting changes, creating a more easily readable webpage appearance. The PDF chart duplicates of the JPEGs have been omitted for ease and speed of recreating Terry’s pages. References to PDF charts should be ignored (but no chart was left out).
After June 2011, Terry created a paid subscription website. None of that material is found here.
There were many many, many hours spent on this project; downloading Terry’s individual charts & audio files, followed by the uploading of Terry’s charts and audio to my WordPress blog library, after which I had to insert the uploaded material into my new T Theory® webpages (hopefully in the correct places). This was a dull and arduous project and I hope you enjoy it. I don’t believe there remains any more of Terry’s material in free domain, so my T Theory® project is probably finished. If I’ve missed something, you can leave me a comment.
If you find an uploaded reference error (chart or audio in the wrong place), please note the month and year of the webpage, plus the exact name of the referenced error file. Include any other info that will help me locate the problem file and where it occurs on the webpage. Leave a comment for me with the info and I’ll fix it.
Terry’s material is very long and will take many weeks for you to finish. Don’t hurry, it’s not a marathon and you will absorb more if you go through it at a reasonable rate. This is especially true for those who don’t invest in the T Theory® reference encyclopedia. The encyclopedia is a written reference for T Theory® and includes everything of importance for Terry’s T Theory®. Without the reference encyclopedia you must depend on your memory and Terry’s method carries some rules that you could easily violate. The encyclopedia also includes new information never seen on his website.
You are welcome to save any or all of my blog material to your computer. You also have my permission to re-blog my information, but you must (1) credit me and my blog in an obvious manner and (2) don’t change my material.
FYI – I find the best way to save a webpage is using “ScrapBook” (it’s an add-on for the FireFox browser). ScrapBook saves a webpage to your computer EXACTLY as it appears on the day you saved it. You can’t tell the difference between the internet webpage and your ScrapBook saved webpage. The saved pages are not pictures. Instead the pages consist of HTML and page functionality remains identical on your computer. There is also a second method for using ScrapBook, where you can save all of the webpages down to a defined link depth. This optional method means all links will function on your computer to the link depth specified (meaning you can click on links on your saved webpages and tunnel down into pages within pages). Saving the normal way will only save the top webpage but the links that exist could continue to function by taking you to the website on the internet instead of on your computer. But sometimes the linked website doesn’t exist anymore. I’ve had this happen on some very good webpages with unique information (they just disappear into the internet void). That’s a bummer when you lost some really good info and thus rose my need for ScrapBook. You can also filter the pages saved using the optional ScrapBook method, which can exclude all pages not coming directly from the specified website (filtering is recommended using this method otherwise you wind up with a LOT of useless stuff).
.
Explore posts in the same categories: . . . T Theory®
Leave A Reply