November 2005 – T Theory® Update

Update November 3 2005
Next Update scheduled for Thursday November 10 2005.
This week I am summarizing my thoughts relative to the current rally which looks to be trying to break above resistance at the 55 day MA, roughly 1206 on the S&P 500 cash price. I am tied up with some projects but did want to point out some of the interesting ways to help resolve the new T possibilities.
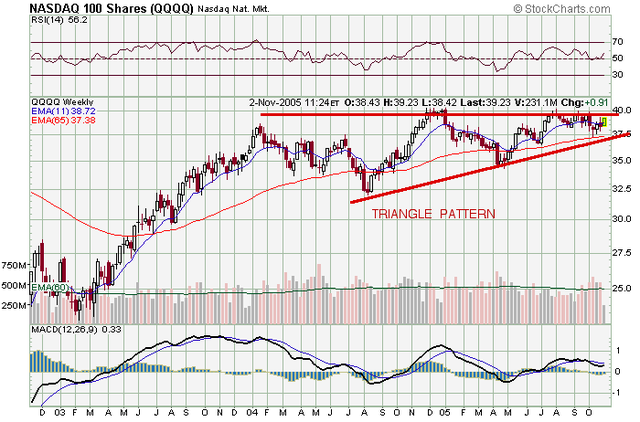
As I pointed out in earlier reports, the September peak saw a negative situation when the big tech index, the Nasdaq 100 wasn’t able to make a new high. Even now there is no evidence of a serious rally in Intel, the classic technology benchmark stock. As a group, the QQQQ index charted below (and in higher resolution PDF at the end) shows an interesting picture, that of a triangle pattern for the 100 biggest tech issues. The triangle pattern seen here is basically the left side of a potential new T. What is missing from all T Theory is confirmation that a bullish new T is in the works for a sustainable rally over the weeks ahead and into the new year.
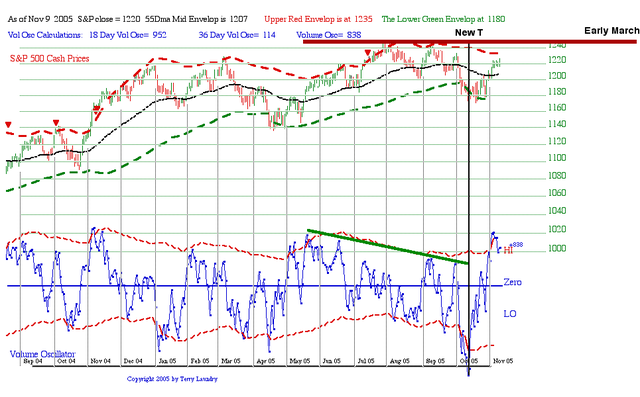
Of course the matter must be resolved soon. Conventional T Theory says the rally from the oversold condition will run into resistance at the 55 day MA, which has been true. But today the S&P got up to 1215 which probably typical for the initial rally of a new T. The Volume oscillator has broken out so we know a new Short range T has been defined time wise.
In the rare event we are in a new and strong Bullish T, the S&P will rally further until it reaches the upper envelope detailed in last weeks chart, then it will pullback but hold the 55 Day MA (1206). This is rare and doesn’t seem the most likely outcome if the QQQQ and Intel etc don’t seem to want to lead the rally in the next few days.
The more probably outcome, if tech remains weak and 30 year rates stay high, is this initial rally will peter out within a few days and the S&P will fall back below the 55 Day MA and set up a new oversold condition. From that oversold condition it would be important to see the tech stocks start leading on the next rally or their may be problems with the T and we might end up in some sort of 3 month trading range.
In any case by the time we reach the Rate T’s Nov 9th date we should know more about how the trend is developing.
Terry Laundry
Update November 10 2005
Next Update scheduled for Thursday November 17 2005.
Below are my Short Range T charts and comments regarding the new T which looks strong on the volume trends but which so far is considerably weaker in the breadth area which is the key criteria for the longer term Advance Decline T. Right now the blue volume oscillator is very over bought and I should have a better view of the situation after a correction that usually lasts some 5 to 7 trading days.
But thus far I continue to be negative on this T thus far because there are no signs of real investment demand. For example the best one month funds during the initial rally are the worst performing funds for the past few years. This suggests the recent rally was fueled by traders buying depressed stocks in anticipation of a year end rally as tax loss selling ends. But neither Intel or GE have moved much. So what we have is a traders market without any appreciable long term investment demand.
This is a bad environment for the new T but over time the situation could improve because the T lasts into early March of the new year and later consolidations could improve the situation. Good news from the Fed could be the spark then the bull market should resume with full breath into the main A-D T’s projected early 2007 peak. The main problem I see is that the market is at risk to be captured by the 4 year cycle low, probably after this T’s March projected peak date. This cycle can shift the various stock sectors relative strength and my main goal is to find the new sector leadership for my company American Shareholders.
Looking at the rate T chart from 1994 to the present, periods of rising 30 year rates like we are seeing now are never optimum for a strong equity advance. So I wouldn’t be very interest in the T’s prospects as long as rates continue to rise. It is true that if long rates begin a steep decline in the weeks ahead then the market trend can perk up significantly but I don’t expect the Fed to suddenly stop raising rates so I will believe declining rates only when I see them.
My best simple solution to the new T’s ambiguous status is still the ultimate resolution of the triangle pattern in the QQQQ index presented last week. The triangle is the normal way a price T is generated once over head resistance blocks the advance (making the Cash Build Up) while the rising bottoms pattern suggests accumulation is taking place on weakness. It is unlikely now that an upside break out can occur since the market is technically overbought. Big money accumulation usually takes place on pull backs to oversold conditions. This only requires the QQQQ index to pull back to the rising bottoms that defines the triangle. So a simpler confirmation that the bull market is resuming is possible as the market progresses through the relatively long Volume T.
I will follow up on this next week with some new Advance-Decline Oscillator plots that I usually use to find accumulation under correction conditions. This I think is the better way to go for the future since the advance decline oscillator is a necessary tool to refine the big Advance-Decline T and it should be able to identify any accumulation low closer to year end where the broader market trends could become stronger. See hi res chart below.
Terry Laundry
November 17 2005
Next Update scheduled for Monday morning November 21(Short Range T) and Thursday noon November 24 2005 (Weekly Charts).
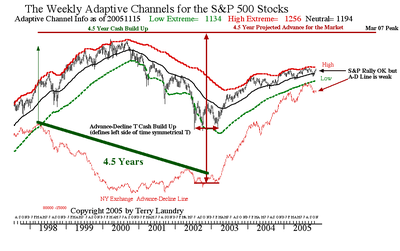
The market’s odd divergent behavior between the strong upside volume trend we saw in last week’s Short Term plot and the very weak Advance Decline Line can be seen below in the weekly Advance-Decline T chart as noted by the two arrows. The high resolution PDF chart follows below.
There are a number of odd behaviors that I need to address as part of my business and I am anxious to start resolving the unusual pattern that seems to be evolving between the S&P, A-D Line, Gold, the US Dollar, Rate Ts etc.
First let us look at the S&P vs A-D Line divergent behavior. Historically this is termed a negative divergence because the up trend in the S&P may not be adequately supported by enough stocks. This can cause erratic or weak behavior along the way as we move to the Short Range T’s projection of a final March date or perhaps worse unexpected behavior looking into the bigger T’s March 2007 peak.
The second unusual development is the recent surge in Gold prices which is underway now, but is still of unknown duration and strength. I had forecast this on general T Theory principles but it must be remembered that if the new Gold up trend reaches to much higher levels, say $500 or higher, the Federal Reserve will likely see this as a sign that the tame inflation trends we are now seeing, will erupt later, perhaps as we move through the current Short Range T. If so, rates may rise further than the market now expects.
The third unusual development of the very strong Dollar at the expense of the Euro. This is particularly unusual given that a strong dollar is often inconsistent with a gold rise, unless foreigners are generally worried and seek a more secure haven. Their haven could be Gold, the US Dollar or US Securities, Bonds, etc.
These three very unusual developments suggest that something radical is going on and I am engaged in trying to understand what it might be. Contrary to what most market watchers think, the big changes that might come about as these new characteristic begin influencing future trends, don’t generally allow existing investors portfolios to remain viable for the changed future environment.
My main task will be to ascertain what’s going on. I will get into the details next Thursday but will update the short term chart on Monday morning. See PDF file below.
Terry Laundry
T Theory Outlook November 21 2005
Next Update delayed until after Thanksgiving, probably December 1
Due to the holiday period I am combining two topics in today’s posting.
The weekly QQQQT chart below courtesy of StockCharts.com provides the full T Theory perspective via T “A” out into mid 2006 and refines the picture via the smaller Ts, labeled B and C closer in. With these three projections all that will be necessary for the next 8 months will be a technical update via the short range T chart that follows.

The key to making returns over this long period will be unraveling the odd combination of characteristics; High volume strength vs weaker breadth, Strong US Dollar along with Strong Gold, as well as the unusual combination of low Mutual fund cash offset by very high corporate cash positions. The new combination of fundamentals is reflected in T Theory by the presence of a large new T which implies the new trends into mid 2006 won’t simply be extensions of the last 7 months trends.
The bonus of the is new T is that it actually consists of three nested Ts, each defined by separated cash build ups using the RSI oscillator at the top of the chart. In order they are:
The A to A’ T basically says the last 7 months consolidation has been a sort of resting phase for the Big A-D T noted in last weeks update, but now a new and probably different T is rejuvenating the trend, presumably for the QQQQ kinds of stocks, into mid 2006. Presumably this is the last peak before a drop into the next 4 year low. As you probably know the market has been making important lows at about 4 year intervals since 1949. The last two occurrences were in late 1998 and late 2002 and presumably in late 2006 to complete the sequence for this big A-D T. After a brief rally out of that low, which will be refined by a big rate T, the market should rally sharply to the A-D T’s projected March 2007 peak then fall sharply for about a year, I think.
The B to B’ mid sized T is basically a re-confirmation of the current short range T in the daily chart that follows. It is possible that the weekly charts will be some help later, so the daily chart is not a complete replacement and I plan to keep following the QQQQ Ts.
The C to C’ is the most interesting T for the remainder of this year. I believe it is estimating the period of time that the market will stay overbought and not fall back to the 55 day MA in the daily chart that follows.

The daily chart will mainly be helpful in defining the envelopes that will contain the up trend. The new odd combination for this initial phase can be seen by the two arrowed notes. It is unusual and yet very bullish that the volume oscillator could return to the initial peak without any real correction. This implies the whole Center Post to C’ period will be strong. Yet the red arrow above the upper envelope is an Arms (trading) sell signal that implies a top is forming. The probably out come is that traders will try to sell the breakouts above the envelope red dashed line but investors, probably foreigners or corporations will by any or 3 day dip, then the drive the market higher right into the C’ peak.
After that peak the S&P will fall to the 55 Day MA where support will come in. But by then, the 55 Day MA will be much higher so the correction in todays perspective will be modest from an investment standpoint. Thats about all we need to know for the next few weeks. How the breadth acts by then will provide the next bit of information.
In the mean time enjoy Thanksgiving.
Terry Laundry
****************************************************************************************
All Rights Reserved By The T Theory® Foundation ©
Order the T Theory® Encyclopedia
For a complete understanding of the T Theory® and how to successfully use Terry’s unique methods, order the Encyclopedia from Paula at the above link. There is additional material in the encyclopedia not covered here. Paula will be more than happy to answer your questions too.
Many thanks to Paula Burke for her permission to re-post Terry’s old T Theory® explanations. The period re-blogged on these pages are some of Terry Laundry’s best work and was published here from public domain.
****************************************************************************************
I claim no credit for the material found under T Theory® on this blog. All of this material is the creation of Terry Laundry and was downloaded from Terry’s free blog site (TypePad). I have created a mirror of Terry’s original material and now there is a second site containing Terry’s T Theory®. One or both of these websites hopefully will survive through time as Terry’s material is too important to be lost to the ravages of time. This site is simply a memorial to his lifetime work.
The page content re-blogged here is exactly as Terry created on his original webpages (saved on my computer with ScrapBook)). Nothing has been left out from the period Dec 2003 to June 2011. From Terry’s site, I made a lot of formatting changes, creating a more easily readable webpage appearance. The PDF chart duplicates of the JPEGs have been omitted for ease and speed of recreating Terry’s pages. References to PDF charts should be ignored (but no chart was left out).
After June 2011, Terry created a paid subscription website. None of that material is found here.
There were many many, many hours spent on this project; downloading Terry’s individual charts & audio files, followed by the uploading of Terry’s charts and audio to my WordPress blog library, after which I had to insert the uploaded material into my new T Theory® webpages (hopefully in the correct places). This was a dull and arduous project and I hope you enjoy it. I don’t believe there remains any more of Terry’s material in free domain, so my T Theory® project is probably finished. If I’ve missed something, you can leave me a comment.
If you find an uploaded reference error (chart or audio in the wrong place), please note the month and year of the webpage, plus the exact name of the referenced error file. Include any other info that will help me locate the problem file and where it occurs on the webpage. Leave a comment for me with the info and I’ll fix it.
Terry’s material is very long and will take many weeks for you to finish. Don’t hurry, it’s not a marathon and you will absorb more if you go through it at a reasonable rate. This is especially true for those who don’t invest in the T Theory® reference encyclopedia. The encyclopedia is a written reference for T Theory® and includes everything of importance for Terry’s T Theory®. Without the reference encyclopedia you must depend on your memory and Terry’s method carries some rules that you could easily violate. The encyclopedia also includes new information never seen on his website.
You are welcome to save any or all of my blog material to your computer. You also have my permission to re-blog my information, but you must (1) credit me and my blog in an obvious manner and (2) don’t change my material.
FYI – I find the best way to save a webpage is using “ScrapBook” (it’s an add-on for the FireFox browser). ScrapBook saves a webpage to your computer EXACTLY as it appears on the day you saved it. You can’t tell the difference between the internet webpage and your ScrapBook saved webpage. The saved pages are not pictures. Instead the pages consist of HTML and page functionality remains identical on your computer. There is also a second method for using ScrapBook, where you can save all of the webpages down to a defined link depth. This optional method means all links will function on your computer to the link depth specified (meaning you can click on links on your saved webpages and tunnel down into pages within pages). Saving the normal way will only save the top webpage but the links that exist could continue to function by taking you to the website on the internet instead of on your computer. But sometimes the linked website doesn’t exist anymore. I’ve had this happen on some very good webpages with unique information (they just disappear into the internet void). That’s a bummer when you lost some really good info and thus rose my need for ScrapBook. You can also filter the pages saved using the optional ScrapBook method, which can exclude all pages not coming directly from the specified website (filtering is recommended using this method otherwise you wind up with a LOT of useless stuff).
.
Explore posts in the same categories: . . . T Theory®
Leave A Reply