August 2005 – T Theory® Update

August 4 2005 Comment
Next regular update scheduled for August 11th
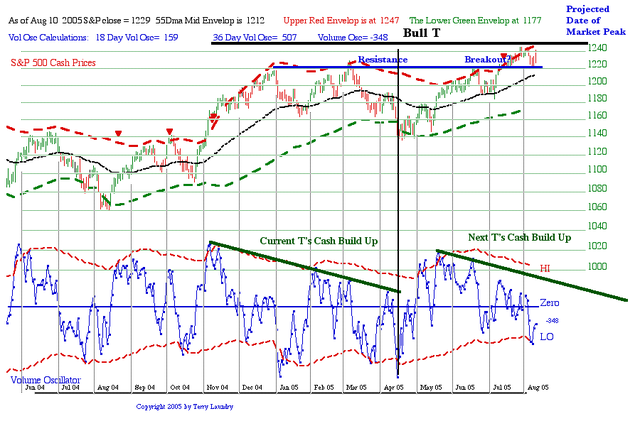
The S&P continues to consolidate in preparation for the current Bull T’s final rally into its projected peak at the right end date of the T. See last week chart for data.
The unusual feature of the volume oscillator has been a continued accumulation pattern as noted in last week’s chart. I discovered these patterns early in my study of T Theory and they are normally quite bullish as they represent persistent buying of market pullbacks. What is different here is that the S&P is trapped at price defined upper envelope which is normally powerful upside resistance. So the eventual outcome will be interesting since two opposing concepts are involved. It is possible that the market will pullback one more time towards the 55 day MA (1204) but it is not necessary since the T is the primary driving force at this point in time and the 55 day MA was already tested earlier.
In any case any pullback should only be very short term in nature (5 days?) and would be a buying opportunity if it occurs.
Terry Laundry
August 11 2005 Update
August 18 2005 Indicators Update
Next regular chart update scheduled for Thursday August 25th
The market is still absorbing the big oil price rise in a negative way. Currently the volume oscillator is oversold and I am awaiting a bottom pattern which should set the stage for the current T’s final rally into September. Once this rally is complete the market should correct into the center post of the next T (in the Fall) using the new cash build up noted in my last week’s chart. Lightening up on the next rally would make sense depending on what we see for the final rally.
In the last week a number of comments have been posted on indicator calculations. I have added a link at the lower left (McClellan Data) that I think will answer the needs of most people who aren’t up to speed on exponential moving averages.
As a historical point I would summarize the calculation history as follows: In the early 1970’s an aerospace engineer, by the name of P.N. Harlan, published a booklet describing exponential moving averages and how they could be applied to investment trends. This was new to the investment world who had never seen the exponential moving average which came out of missile guidance technology. My interest in his work was the 5% and 10 % exponential moving averages as applied to Advance-Decline (breadth) data for accumulation patterns and the on balance (up minus down) volume data for the purpose of defining the Ts.
Independently in the 1970’s, Sherman McClellan, saw the advantages of exponential moving averages as an over bought/oversold indicator and promoted this view as now can be seen at their web site reference below (http://www.mcoscillator.com/Data.html). To add perspective to this short term oscillator, Maclellan invented the summation index which is described at the site.
I on the other hand moved into two new directions. The Advance-Decline data evolved into the A-D Ts which currently call for a predicted early 2007 peak. Based on my experience I saw that what was really needed for investment judgment was projections of price highs and price lows, not oscillator highs vs oscillator lows. This lesson was taught to me by Marty Schwartz who traded S&P 500 contracts heavily and learned to live or die on the market’s price changes, not the oscillator momentum levels.
My response was to develop the Adaptive Price Envelopes that are illustrated in the daily and weekly charts. These are very complicated to compute and remain proprietary. However they don’t change very fast and my regular chart updates should keep you up to date.
The main problem for most people seems to be the basic calculation of the blue volume oscillator. Except for a scale factor it is the same as the McClellan Volume (not A-D) Oscillator. If you go to the McClellan site noted in my web links you will see each day’s data and calculations listed. Their volume oscillator divided by 100 = my volume oscillator.
Finally for those that want to see the calculations listed over a long time and have an Excel compatible spreadsheet, go to the bottom of the page and click on the oscillator data link. This will bring you a very comprehensive historical listing of the daily indicators.
Terry Laundry
Chart Update August 25 2005
Next comments and responses to recent questions scheduled for Thursday September 1
The S&P is weakening more than I would like to see but we are at the 55 Day MA per the chart below and this is normal support. The projected peak for the Bull T is at the end of the quarter, maybe very early October, but I would caution on taking this too literally.
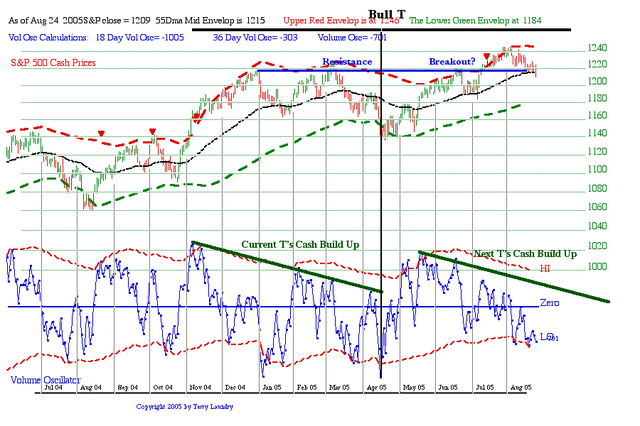
One is always better off watching the envelopes for signals, along with any accumulation patterns, but it is particularly true now because a new T may be creeping up on us come early October. Note the New T’s Cash Build Up phase, the second green line in the oscillator, is already quite long and come early October would be the same duration as for the current T.
The net effect is that we may be ready to start a new T as the old T is running out. This will be very confusing without reference to the oscillators overbought and oversold considerations and the equivalent for the price envelopes.
More in my later updates.
Terry Laundry
****************************************************************************************
All Rights Reserved By The T Theory® Foundation ©
Order the T Theory® Encyclopedia
For a complete understanding of the T Theory® and how to successfully use Terry’s unique methods, order the Encyclopedia from Paula at the above link. There is additional material in the encyclopedia not covered here. Paula will be more than happy to answer your questions too.
Many thanks to Paula Burke for her permission to re-post Terry’s old T Theory® explanations. The period re-blogged on these pages are some of Terry Laundry’s best work and was published here from public domain.
****************************************************************************************
I claim no credit for the material found under T Theory® on this blog. All of this material is the creation of Terry Laundry and was downloaded from Terry’s free blog site (TypePad). I have created a mirror of Terry’s original material and now there is a second site containing Terry’s T Theory®. One or both of these websites hopefully will survive through time as Terry’s material is too important to be lost to the ravages of time. This site is simply a memorial to his lifetime work.
The page content re-blogged here is exactly as Terry created on his original webpages (saved on my computer with ScrapBook)). Nothing has been left out from the period Dec 2003 to June 2011. From Terry’s site, I made a lot of formatting changes, creating a more easily readable webpage appearance. The PDF chart duplicates of the JPEGs have been omitted for ease and speed of recreating Terry’s pages. References to PDF charts should be ignored (but no chart was left out).
After June 2011, Terry created a paid subscription website. None of that material is found here.
There were many many, many hours spent on this project; downloading Terry’s individual charts & audio files, followed by the uploading of Terry’s charts and audio to my WordPress blog library, after which I had to insert the uploaded material into my new T Theory® webpages (hopefully in the correct places). This was a dull and arduous project and I hope you enjoy it. I don’t believe there remains any more of Terry’s material in free domain, so my T Theory® project is probably finished. If I’ve missed something, you can leave me a comment.
If you find an uploaded reference error (chart or audio in the wrong place), please note the month and year of the webpage, plus the exact name of the referenced error file. Include any other info that will help me locate the problem file and where it occurs on the webpage. Leave a comment for me with the info and I’ll fix it.
Terry’s material is very long and will take many weeks for you to finish. Don’t hurry, it’s not a marathon and you will absorb more if you go through it at a reasonable rate. This is especially true for those who don’t invest in the T Theory® reference encyclopedia. The encyclopedia is a written reference for T Theory® and includes everything of importance for Terry’s T Theory®. Without the reference encyclopedia you must depend on your memory and Terry’s method carries some rules that you could easily violate. The encyclopedia also includes new information never seen on his website.
You are welcome to save any or all of my blog material to your computer. You also have my permission to re-blog my information, but you must (1) credit me and my blog in an obvious manner and (2) don’t change my material.
FYI – I find the best way to save a webpage is using “ScrapBook” (it’s an add-on for the FireFox browser). ScrapBook saves a webpage to your computer EXACTLY as it appears on the day you saved it. You can’t tell the difference between the internet webpage and your ScrapBook saved webpage. The saved pages are not pictures. Instead the pages consist of HTML and page functionality remains identical on your computer. There is also a second method for using ScrapBook, where you can save all of the webpages down to a defined link depth. This optional method means all links will function on your computer to the link depth specified (meaning you can click on links on your saved webpages and tunnel down into pages within pages). Saving the normal way will only save the top webpage but the links that exist could continue to function by taking you to the website on the internet instead of on your computer. But sometimes the linked website doesn’t exist anymore. I’ve had this happen on some very good webpages with unique information (they just disappear into the internet void). That’s a bummer when you lost some really good info and thus rose my need for ScrapBook. You can also filter the pages saved using the optional ScrapBook method, which can exclude all pages not coming directly from the specified website (filtering is recommended using this method otherwise you wind up with a LOT of useless stuff).
.
Explore posts in the same categories: . . . T Theory®
Leave A Reply