July 2005 – T Theory® Update

Update July 14 2005
My 1999 Rate Ts Study
I will comment on this interest rate study used to project future market lows in my July 21 audio update. Note the last T might be projecting the May 2000 low after the bubble break in March 2000. I will post parts 1 and 2 later. Terry Laundry
—- This study was posted at my old site in 1999. ——-
Rate Study Part III
by Terrence H. Laundry
In Parts I and II of my Rate T Study we saw the remarkable ability of monthly momentum Oscillators, based only on the fluctuating yields of the Long Term Treasury bond to project the date of key market lows. This behavior was very acceptable during the period from 1945 to 1982 when long term rates were generally rising as inflation grew steadily stronger after the second world war. This was also a unique period of history where Ts acted normally, that is, there always was a strong rally in the right side of the successive Ts, lifting rates steadily higher to an eventual projected peak. Because rising rates eventually hurt stocks, a market decline set in at some stage of the rate advance, and once begun, generally pushed stock prices lower until rates finally peak, then fell, often as the result of a business slowdown. As I am sure you know falling long term rates are nearly always bullish for both stocks and the economy for a wide variety of good reasons. So as long as rates were rising in the right side of a Rate T, and made a satisfactorily peak near the T’s projected top date, we could expect a market low to appear at the Rate T’s projected peak date. This very important, of course, because the Rate T’s projected top date is known in advance and thus gives advance warning of the impending market low. And our Rate Study concluded we could generally be satisfied with the monthly rate T projections for this long period of rising inflation.
However after 1982, as the 8th Mega-T got under way, fueled in large part by declining inflation, long rates began a steady decline and the T concept used in this study had problems coping with projected rises in rates within the right side of big Ts, probably because they were very muted or non existent. My first attempt to solve this problem was to switch to daily long term rate data which finally became available in 1978. Then I added a shorter term oscillator design to handle the momentum measurements for what were clearly much shorter, and generally very temporary rallies in rates. My first oscillator designs were too short term in nature and we did not provide reliable projections. Then I noticed in November 1998 that very simple Ts, like the ones constructed in the daily chart below, were capable of giving some accurate market low projections. Also in some cases we were seeing rates peak as they should at the right end date of these simple Ts. All this suggested that a new oscillator design concept might restore the concepts usefulness in this new era of declining inflation.
The results, as we can see above, look promising because there are enough T examples here to illustrate accurate projections of market lows. Also any T that looks constructible does point to a market low which is encouraging for the future. For this reason I am moving on to a refinement of this 5 year history so it can be investigated on a more expanded time scale. We will see if the construction rules for more accurate T projections can be undiscovered. It is also possible that these constructions will reveal a simply momentum oscillator design that will help us make practical use of this tool. The real advantage of this concept, if more back pan out, is that the ability to project market lows with any degree of accuracy at all is extremely valuable, in fact more valuable than conventional T projections for market tops. For example, the last big T in the chart looks important and calls for a market low somewhere in the early part of the year 2000 as best I can determine.
As I mentioned in my Jan 19th discussion, I am especially interested in finding new Tools that can find new opportunities. New buying opportunities like the ones that these kinds of Ts might be able to find are potentially more important than some of our big stocks market Ts. You will remember from earlier studies we saw that corrections of major advances we often just 50% corrections of prior run ups over the long term. This suggests that peaks are only 50% as important as major lows. In other words it is likely that bottom opportunities are twice as important to know about as potential tops. Hopefully the full study of this indicator will shed more light on these questions and potential opportunities. Next week I will have expanded this history and we can look at these Ts in more detail.
end of 1999 study Terry Laundry
July 21 2005 Update
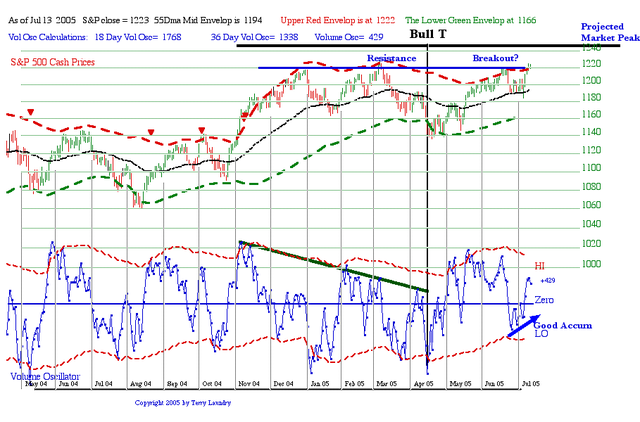
The Short Range Bull T for the S&P 500 is doing fine. The uptrend has almost 2 months to go in its bullish projection and the S&P has broken above the old tops resistance level.
In response to John’s Long term Bond question I have posted my 1999 study below which pretty much explains the picture. I will comment further in my next update. The 30 year rates, symbol TYX, can be extended by going to bigcharts.com and entering TYX for a plot. New Ts will become apparent for the period after this study with new market lows predicted. I will update the program and make future low projections from these bond Ts a part of my regular comments starting this Fall.
As far as T Theory is concerned this Rate T study implies;
Equity market peaks can be projected by Advance-Decline Ts (and other Ts) but the T center post low point of any T is unpredictable and needs to be evaluated in real time by other concepts.
Market lows may be predictable in advance but only by coming at the market picture via Ts in interest rates as shown in the study. Essentially the task for future studies will be to show if rate manipulation by Rate Ts in order to influnce future market lows is analogous to rate maipulation by the Federal Reserve for the purpose of influencing economic trends.
Finally, the last big T in the study is responsible to breaking the dot com bubble in the year 2000 from the mid March peak to the May low. This suggests that normal T behavior applies to Rate Ts. That is, the longer spanning Ts are more influencial than the shorter spanning Ts. In other words, big rate Ts probably cause big damage, small Rate Ts probably produce less important corrections.
Terry Laundry
Update July 28 2005
Click on the chart below for a larger image and drag to desktop if you want a printed copy. Next regular update scheduled for August 9th with a short note or any special projects on August 2.
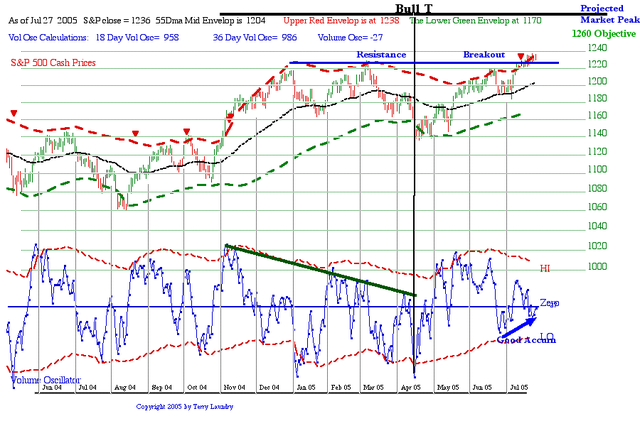
As the trend runs into the current Bull T’s projected peak in about 6 weeks it is a good idea to plan for the eventual topping, a correction into early Fall then the development of a new short range T to supply the traditional rally into year end and on to the new year.As noted S&P 1260 is a reasonable upside objective but it could do better.
The key to interpreting the potential for these new T trends is the nature of the S&P 500 trend relative to the old resistance level around the 1220 level that had capped the longer term Advance-Decline T’s projection of a bull trend into March 2007 despite the expected 4 year cycle low historically due late next year.
Since it is not really possible gauge the net effect of these two opposing forces the levels of the S&P provide the best reference point for us to see which force is winning the battle. The 39 week MA needs to hold any future weakness promoted by the 4 year cycles normal weakening in 2006. The old resistance level 1220 needs to hold the correction in Sept/Oct during the regeneration of a new T.
So confirmation of a continuing bullish trend into 2007 should show the recent break out above the 1220 resistance level has now become a floor for any corrections going into the end of the year. This is a simple way to demonstrate the ongoing influence of the big A-D T based on past T Theory trends.
Terry Laundry
****************************************************************************************
All Rights Reserved By The T Theory® Foundation ©
Order the T Theory® Encyclopedia
For a complete understanding of the T Theory® and how to successfully use Terry’s unique methods, order the Encyclopedia from Paula at the above link. There is additional material in the encyclopedia not covered here. Paula will be more than happy to answer your questions too.
Many thanks to Paula Burke for her permission to re-post Terry’s old T Theory® explanations. The period re-blogged on these pages are some of Terry Laundry’s best work and was published here from public domain.
****************************************************************************************
I claim no credit for the material found under T Theory® on this blog. All of this material is the creation of Terry Laundry and was downloaded from Terry’s free blog site (TypePad). I have created a mirror of Terry’s original material and now there is a second site containing Terry’s T Theory®. One or both of these websites hopefully will survive through time as Terry’s material is too important to be lost to the ravages of time. This site is simply a memorial to his lifetime work.
The page content re-blogged here is exactly as Terry created on his original webpages (saved on my computer with ScrapBook)). Nothing has been left out from the period Dec 2003 to June 2011. From Terry’s site, I made a lot of formatting changes, creating a more easily readable webpage appearance. The PDF chart duplicates of the JPEGs have been omitted for ease and speed of recreating Terry’s pages. References to PDF charts should be ignored (but no chart was left out).
After June 2011, Terry created a paid subscription website. None of that material is found here.
There were many many, many hours spent on this project; downloading Terry’s individual charts & audio files, followed by the uploading of Terry’s charts and audio to my WordPress blog library, after which I had to insert the uploaded material into my new T Theory® webpages (hopefully in the correct places). This was a dull and arduous project and I hope you enjoy it. I don’t believe there remains any more of Terry’s material in free domain, so my T Theory® project is probably finished. If I’ve missed something, you can leave me a comment.
If you find an uploaded reference error (chart or audio in the wrong place), please note the month and year of the webpage, plus the exact name of the referenced error file. Include any other info that will help me locate the problem file and where it occurs on the webpage. Leave a comment for me with the info and I’ll fix it.
Terry’s material is very long and will take many weeks for you to finish. Don’t hurry, it’s not a marathon and you will absorb more if you go through it at a reasonable rate. This is especially true for those who don’t invest in the T Theory® reference encyclopedia. The encyclopedia is a written reference for T Theory® and includes everything of importance for Terry’s T Theory®. Without the reference encyclopedia you must depend on your memory and Terry’s method carries some rules that you could easily violate. The encyclopedia also includes new information never seen on his website.
You are welcome to save any or all of my blog material to your computer. You also have my permission to re-blog my information, but you must (1) credit me and my blog in an obvious manner and (2) don’t change my material.
FYI – I find the best way to save a webpage is using “ScrapBook” (it’s an add-on for the FireFox browser). ScrapBook saves a webpage to your computer EXACTLY as it appears on the day you saved it. You can’t tell the difference between the internet webpage and your ScrapBook saved webpage. The saved pages are not pictures. Instead the pages consist of HTML and page functionality remains identical on your computer. There is also a second method for using ScrapBook, where you can save all of the webpages down to a defined link depth. This optional method means all links will function on your computer to the link depth specified (meaning you can click on links on your saved webpages and tunnel down into pages within pages). Saving the normal way will only save the top webpage but the links that exist could continue to function by taking you to the website on the internet instead of on your computer. But sometimes the linked website doesn’t exist anymore. I’ve had this happen on some very good webpages with unique information (they just disappear into the internet void). That’s a bummer when you lost some really good info and thus rose my need for ScrapBook. You can also filter the pages saved using the optional ScrapBook method, which can exclude all pages not coming directly from the specified website (filtering is recommended using this method otherwise you wind up with a LOT of useless stuff).
.
Explore posts in the same categories: . . . T Theory®
Leave A Reply