June 2005 – T Theory® Update

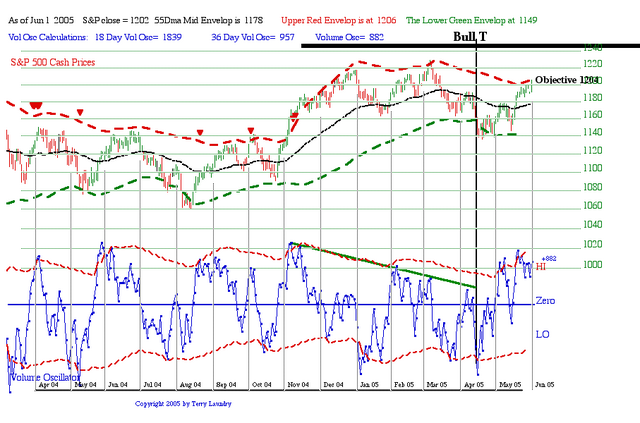
Update June 2 2005
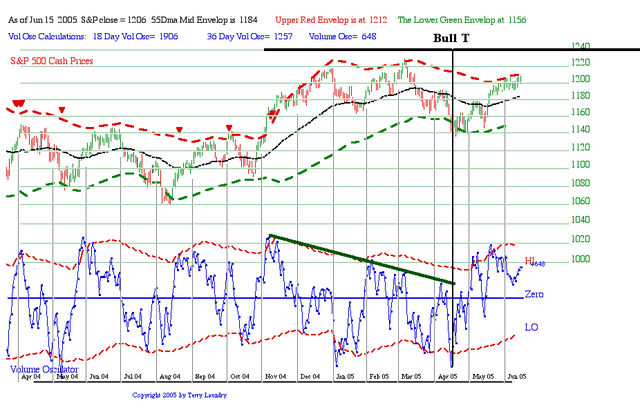
Update June 9 2005

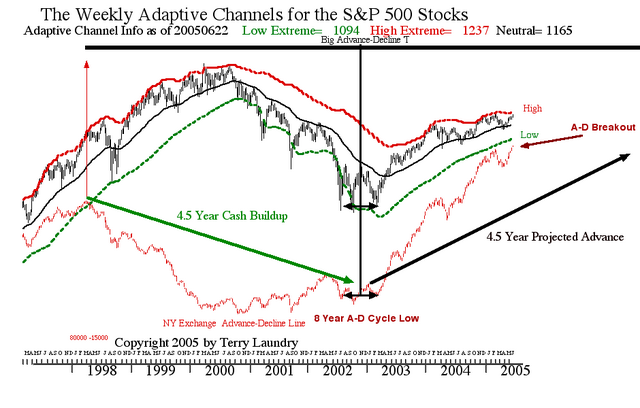
Historical A-D T Study
This is a summary of my basic Advance-Decline T History original published in 1998.
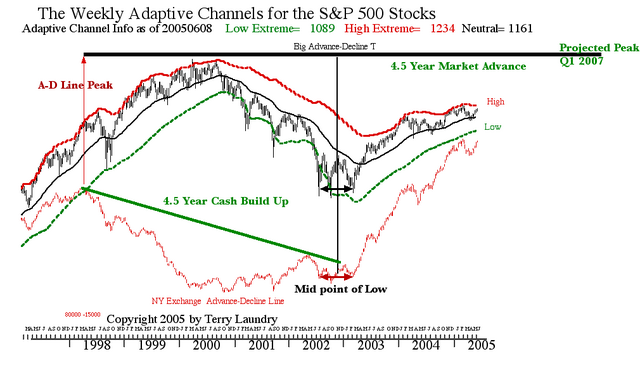
The chart above is from my 1990’s studies. It illustrates the reliability of the A-D T projections of market peaks in the NY Index using the green cash build up periods in the A-D plot at the bottom of the chart. As usual, the green decline time in the A-D Line defines the left side of the T and the equal time projection for the NY Index rally phase generally does a good job of projecting the time of the next peak. Note T#2 projects a very long (6 years) rise in the market and is correct in identifying the 1980 peak. Also note the suggestion of a 8 year cycle in the raw Advance-Decline Line.
The Ts were confirmed in 2001 as reliable going back into the 1930’s using web published charts of the NY Index and A-D Line. This summer I will take a new clean database that starts in 1926 and re build the above chart in one continuous 80 year run. From this very long term perspective I can then do a wide variety of studies that better present the Ts reliability, confirmation of lows at the center post of any T as well as the validity of the suggested 8 year cycle, etc.
Terry Laundry
Update Jun 16 2005
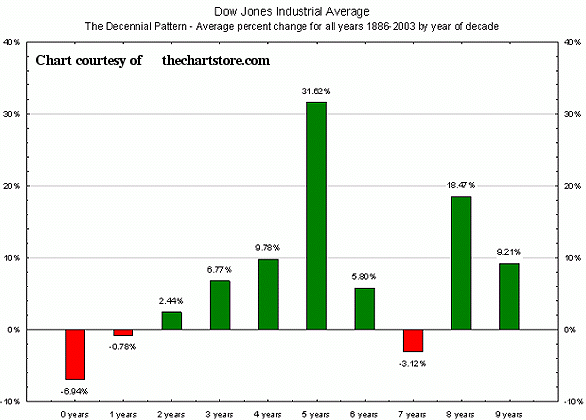
Decennial Pattern
In response to Peggy’s June 17th question on the prospects for an 8 cycle cycle low in the A-D Line next year plus my own attempt to move on to more sophisticated cycle concepts that harmonize with my own T Theory, I am posting here a summary of the so-called Decennial Pattern for stocks I will integrate its suggestions in my next regular update scheduled for Thursday June 23.
This decennial (10 year) pattern concept is frequently at odds with the simpler 4 year cyclical interpretation and often points to unexpected shifts that catch most investors off guard. Amongst old pros the decennial pattern is valued for its independent and generally reliable leanings as to whether any new year within the decade pattern might be good or bad. The pattern was discovered by Edward Dewey, a pioneer in cycle theory and founder of the Foundation for the Study of Cycles, but is somewhat mystical in its claims that stock market patterns of good years, bad years, etc. is dependent on the rather arbitrary last digit in the year. That is, best performing years are those who end in the year “5” while bad years for stocks are likely in years that end in “0” based on statistics from 1895. Thus 2000 was a bad year because it ended in the number zero while this year, 2005 has historically the best upside potential.
The following chart summarize its basic historical statistics for the period after 1885. The aggregate year’s performance is summarized only by the final digit in the year. That is 1885, 1895, 1905, 1915,1925,1935, 1945, 1955, …1995 have the best profitability as suggested by the 5 years average gain of 31%. The worst years are those ending in zero (like 2000) with an average loss of some 6% and years ending in 7 (like 2007). The bad year 2007 is likely to arrive from my big A-D T’s projected early 2007 peak. However note that if the market falls to a very oversold condition during the year 2007 then a sharp recovery would be expected the next year because the second most profitable year within the decade pattern is for the year ending in 8 (like 2008).
There is no plausible reason for the 10 year pattern, but most of us who have been around for some decades know it and use it to steer us away from unexpected modifications to normal market trends. In my regular report I will show how the Advance-Decline T, the 4 market cycle, the 8 year A-D cycle and this complex 10 year pattern can lay out a general market forecast for the remainder of this decade.
For the years ending in 5 (which apply to the current year) their are two unexpected parts to the pattern. First the year overall is generally quite strong but surprisingly, the corrections tend to be concentrated in the first 3 to 6 months, with very strong action unfolding later as the year progresses. Let us hope that is true for this year as well. Terry Laundry
Update June 23 2005

Update June 30 2005
****************************************************************************************
All Rights Reserved By The T Theory® Foundation ©
Order the T Theory® Encyclopedia
For a complete understanding of the T Theory® and how to successfully use Terry’s unique methods, order the Encyclopedia from Paula at the above link. There is additional material in the encyclopedia not covered here. Paula will be more than happy to answer your questions too.
Many thanks to Paula Burke for her permission to re-post Terry’s old T Theory® explanations. The period re-blogged on these pages are some of Terry Laundry’s best work and was published here from public domain.
****************************************************************************************
I claim no credit for the material found under T Theory® on this blog. All of this material is the creation of Terry Laundry and was downloaded from Terry’s free blog site (TypePad). I have created a mirror of Terry’s original material and now there is a second site containing Terry’s T Theory®. One or both of these websites hopefully will survive through time as Terry’s material is too important to be lost to the ravages of time. This site is simply a memorial to his lifetime work.
The page content re-blogged here is exactly as Terry created on his original webpages (saved on my computer with ScrapBook)). Nothing has been left out from the period Dec 2003 to June 2011. From Terry’s site, I made a lot of formatting changes, creating a more easily readable webpage appearance. The PDF chart duplicates of the JPEGs have been omitted for ease and speed of recreating Terry’s pages. References to PDF charts should be ignored (but no chart was left out).
After June 2011, Terry created a paid subscription website. None of that material is found here.
There were many many, many hours spent on this project; downloading Terry’s individual charts & audio files, followed by the uploading of Terry’s charts and audio to my WordPress blog library, after which I had to insert the uploaded material into my new T Theory® webpages (hopefully in the correct places). This was a dull and arduous project and I hope you enjoy it. I don’t believe there remains any more of Terry’s material in free domain, so my T Theory® project is probably finished. If I’ve missed something, you can leave me a comment.
If you find an uploaded reference error (chart or audio in the wrong place), please note the month and year of the webpage, plus the exact name of the referenced error file. Include any other info that will help me locate the problem file and where it occurs on the webpage. Leave a comment for me with the info and I’ll fix it.
Terry’s material is very long and will take many weeks for you to finish. Don’t hurry, it’s not a marathon and you will absorb more if you go through it at a reasonable rate. This is especially true for those who don’t invest in the T Theory® reference encyclopedia. The encyclopedia is a written reference for T Theory® and includes everything of importance for Terry’s T Theory®. Without the reference encyclopedia you must depend on your memory and Terry’s method carries some rules that you could easily violate. The encyclopedia also includes new information never seen on his website.
You are welcome to save any or all of my blog material to your computer. You also have my permission to re-blog my information, but you must (1) credit me and my blog in an obvious manner and (2) don’t change my material.
FYI – I find the best way to save a webpage is using “ScrapBook” (it’s an add-on for the FireFox browser). ScrapBook saves a webpage to your computer EXACTLY as it appears on the day you saved it. You can’t tell the difference between the internet webpage and your ScrapBook saved webpage. The saved pages are not pictures. Instead the pages consist of HTML and page functionality remains identical on your computer. There is also a second method for using ScrapBook, where you can save all of the webpages down to a defined link depth. This optional method means all links will function on your computer to the link depth specified (meaning you can click on links on your saved webpages and tunnel down into pages within pages). Saving the normal way will only save the top webpage but the links that exist could continue to function by taking you to the website on the internet instead of on your computer. But sometimes the linked website doesn’t exist anymore. I’ve had this happen on some very good webpages with unique information (they just disappear into the internet void). That’s a bummer when you lost some really good info and thus rose my need for ScrapBook. You can also filter the pages saved using the optional ScrapBook method, which can exclude all pages not coming directly from the specified website (filtering is recommended using this method otherwise you wind up with a LOT of useless stuff).
.
Explore posts in the same categories: . . . T Theory®
Leave A Reply