March 2006 – T Theory® Update

March 9 2006 Update
My next posting at this site is scheduled for Thursday March 23 2006.
For this report I am posting my daily chart image directly in PDF format within the text to save space. I hope it doesn’t cause problems. Drag the image to your desktop for a copy.
Turning to the equity market as measured by the S&P, we are now passing out of the right side of the “Old Expiring T” with its center-post low in October 2005. Remember this last Fall key oversold condition was a Rate T induced low and we will be seeing other such Rate induced lows this coming Fall as well. Currently the market is caught up in the normal overbought correction phase. There is little to do but await the next important low that will become the center-post low of the “New Upcoming T”.
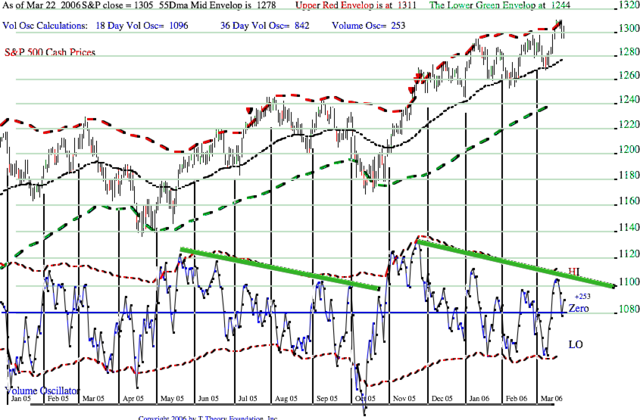
One interesting point of this T, to note before we say goodbye to it, is that its projected peak date is today, March 9. For reasons that have to do with market liquidity, the projected peak date for many short range Ts is often not precise, so I have added the envelopes to the trend of the S&P to help identify highs or lows based on S&P level rather than time alone. To summarize its theory and the T construction as I have noted in the chart, it can be seen that the T’s Cash Build Up phase, defined by the descending tops in the blue volume oscillator, lasted 101 daily data points from the May 19 peak to the October 12 low. According to the time symmetry property I discovered in the early 1970’s, this period of time can be taken to represent a period of Cash Build Up as investors slowly began to build up buying power. This buying power would be maximum at the October low which ends the cash build up phase. Once this buying power returns to equities, the theory expects it to fuel a market rally represented here by the S&P upper plot, and that rally will last the same number of trading days that originally generated the new buying power. We represent this by the time symmetrical graphic T and history shows this is the way that market fluctuations are regenerated as trends unfold.
In my last report I showed you a wonderful sequence of Ts in the high liquidity 1990’s situation which demonstrated the time symmetry can be nearly exact, and the sequence of Ts can refine an up-trend. Unfortunately, after the 2000 speculative peak, investors had good reason to be suspicious of equities and turned to real estate as their preferred investment. This left equities in a somewhat neglected state. So when I sketch a T, as I have done here, it is a good guess that as the equity trend moves out from the October low to the projected right end date of this T, their are reasons to believe that the amount of buying power needed to fill out the time symmetry on an exact basis might not be present. My solution to this problem was to devise an envelope theory which basically states that as one approaches a projected peak date, one should do any selling as the trend rises up to the red dashed line because the trend is becoming exhausted and an S&P overbought level might be the better signal to sell.
The other observation I wanted to make is that it is fairly obvious that one really wants to know the approximate location of a T’s center-post low since that point in time will find the maximum buying power available and equity prices should be at an attractive short term low. Since the early 1970’s and up to 1998 I had sought to find, without success, a rational way to estimate the low point from which each new T begins its advance. Looking at long history it is easy to see the T’s location in time is fairly random from one T to the next, but at any low the time symmetry of and one Ts is pretty accurate. For the current situation this means their is no way to estimate the next T’s center-post since it is presumed that fundamental factors (rising rates, Iran etc) are currently influencing investor decisions. However under the best liquidity conditions, a few weeks of market correction after the projected peak date (March 9) would be expected, based on the 1990’s history shown in my last report. Since their is no good reason to believe we are in a fundamentally better set of circumstances it is my judgement that any new center post for the next T must lied a few weeks later than the March 9th date. Late March might be typical, but I am just guessing, as the actual location will be dictated by market events as yet unknown.
Relative to the recent comment that the current modest oversold oversold condition in the blue volume oscillator might be taken as a buying opportunity, my response is that Ts don’t usually work that way. It is true the volume oscillator is relatively oversold and a small rally could result. However the normal, best case, is that the S&P will have to get oversold enough to attract buyers and that probably means under the 55 day MA that has thus far acted as a floor within the T’s right side. Note the volume oscillator is more likely to drop to an extreme low, nearer the bottom of the chart, as per much longer term history.
I would guess that the 55 day MA (S&P 1270-ish) is going to fail based on was I see so far, and that if it does, the eventual low will be near the 200 day MA around S&P 1230. This is roughly at the green dashed line in the envelopes (1238) and it is a reasonable downside objective.
Another way to approach this sort of “guessing game” is to look for a very short spanning Rate T market low time projection. Just before the October 2005 low it was noted in a September posting that a small rate T seemed to be pointing to an end of October market low and that observation proved correct. So perhaps we should take a look at the 30 year treasury bond yield chart to see if a small rate T might be pointing to a near term date that could be the low of the next T. If you are inclined to do the research and post your finding, please do so. I will attempt to make a projection in my next report but it would be nice to see some independent calculations.
Otherwise please read my major Rate T Study now posted at http://www.ttheoryfoundation, if you haven’t already done so.
Terry Laundry
Volume Oscillator at Critical Stage
As of the March 14 close, the volume oscillator that defines the left side of my short range Ts has come up to its declining tops trend line as can be seen in my daily spreadsheet chart below. This is a handy way to track the volume oscillator that anyone can set up and it makes it easy to see the potential breakout of the cash build up lines.

Should the March 15th and beyond daily volume trends push the volume oscillator well above the declining cash build up line then a new T will be confirmed with upside potential that is well above average. If the market doesn’t follow with strength, then an other pullback will be needed, but the next retry should work OK.
Gold funds are holding up well and look strong going into May/ June.
Terry Laundry
Short range T Update March 23 2006
The inline graphic and the PDF file that follows illustrate the new Ts cash build up period under the green line along with the comparable one for the old expired Ts as of yesterday. It is likely that the recent cash build up has started a new T but I wouldn’t be ready to conclude that right away as there are serious non confirmations in the tech area that usually amount to a valid negative.
However I do have a few important observations:
First, not all T rally’s take the buying power developed in the Cash Build Up Period (under the green line) and punch it quickly into the initial rally such as we saw coming out of the last October low. Sometimes under over-bought conditions the rally starts slowly and selectively, but gains breadth and strength as time carries the market towards the right end of the T. If that is the case here, we will see a jerky selective start, but as we move into April and later May strength will grow and by mid year the results will be satisfactory.
Second, my intermediate T perspective sees the rally that started last October as having it logical upside end point somewhere around mid year. On that basis I stated I wouldn’t be looking to sell everything on the first Ts projected March peak since a new T should develop naturally carrying the market higher in line with the big Advance-Decline T projection of an ongoing bull market into March-ish 2007.
There are still reasons to be concerned about the Rate T lows likely in July any October as noted at my T Theory Foundation site, but that is for later. The best intermediate T, and the one I will rely on, is for the HUI (gold bugs equity index) and I will detail that after we get more confirmation. I think it will prove to be the more reliable target date for a general high before the Rate Ts start their negative influence going into the Fall.
Nevertheless it is still necessary to confirm the new T buy noting a break out of the relatively shallowly declining Cash Build Up line as sketched in my daily chart. Note for the first cash build, up a steeper down trend line would have triggered a false breakout just before the sharp decline into the October low. Knowing that a Rate T Low was due around then was the new T Theory tool that holds promise for avoiding this kind of sensitivity to the construction of a typical Cash Build Up line.
For the second Cash Build Up I just copied the first line’s slope and moved it into the later period. As of now, no clear upside breakout has occurred to definitely confirm the T. However, it is still possible that the initial rally is just slow to get started. If so the pullbacks in the volume oscillator will only last a day or two and on a subsequent rally, the oscillator will break above the normal slope, thereby confirming a new Short Range T is present. The next few days should settle this issue.
I agree that using the criteria of the upside breakout isn’t very satisfactory, but looking ahead there aren’t many ways the general T forecast can change looking out to late 2007. We can be sure we will make a new Short T here, and mid year will see an important peak. The market will fall into the July-ish Rate T low, try to come out but then be pulled into the Major Rate T low for October-ish.
Since this will also be the normal spot for a 4 year (mid-Election cycle) low it is possible Fall will see the most oversold condition of 2006. It should mark the best trading point low or best re-investment low.
The rise out of this Fall low will likely do very well going into 2007 but in March 2007 it will run into the Big Advance-Decline T main projected peak. In the past this has proven fatal for bull markets so we should then see a long term correction get under way thereafter.
Terry Laundry
T Theory Graphics
I am now expanding this site to more sections in order to be able to post a greater diversity of topics that interest me and I am sure will interest you as well. Please follow the new paths as noted below.
First, I have posted a new site that deals only in T Theory Graphics. It is at
http://ttheory.typepad.com/t_theory_graphics/.
My Web Links at the lower left provides a clickable link for your convenience. Please bookmark it in your favorites.
This site contains many of my graphics from studies long since completed but which are important from a historical perspective. They will be the basis for new studies that move beyond their initial historical demonstrations.
Note this “My Web Links” topic is sinking down the page as I add more material, but it will always provide navigation instruction, as more links are added. I would suggest you capture all these links into a single group within your browser so as to keep track of the multiple postings. I am now posting to these multiple sites and you will need to check them all out on your own for new stuff.
To greatly simplify the process of replying to comments at these multiple sites I will require that in the future all comments questions etc be posted at the Terry’s Reply to Comments section:
http://ttheory.typepad.com/terrys_reply_to_comments/
I won’t respond to frivolous comments, but I will reply to any novice questions that need initial direction as well as more complex questions that require more serious study and response. But please keep in mind I will only respond from this central comment site going forward.
In time I will close the possibility of making any comments at all other weblogs and simply direct that any comments be posted at this one central location. So move along with the new program for future posts.
This bring me to the next important topic. The T Theory Foundation is up and running and looking for original work that might help to advance T Theory. Original contributions will be supported financially at my discretion. My first contribution to be sponsored is by Chris.
Chris who wishes to remain anonymous, because he pre-occupied with family, has sent to me an important new way to use the volume oscillator for refinement of timing strategies. I will post his ideas and my reply to his suggestions later this week at the ” Terry’s Reply to Comments” site.
****************************************************************************************
All Rights Reserved By The T Theory® Foundation ©
Order the T Theory® Encyclopedia
For a complete understanding of the T Theory® and how to successfully use Terry’s unique methods, order the Encyclopedia from Paula at the above link. There is additional material in the encyclopedia not covered here. Paula will be more than happy to answer your questions too.
Many thanks to Paula Burke for her permission to re-post Terry’s old T Theory® explanations. The period re-blogged on these pages are some of Terry Laundry’s best work and was published here from public domain.
****************************************************************************************
I claim no credit for the material found under T Theory® on this blog. All of this material is the creation of Terry Laundry and was downloaded from Terry’s free blog site (TypePad). I have created a mirror of Terry’s original material and now there is a second site containing Terry’s T Theory®. One or both of these websites hopefully will survive through time as Terry’s material is too important to be lost to the ravages of time. This site is simply a memorial to his lifetime work.
The page content re-blogged here is exactly as Terry created on his original webpages (saved on my computer with ScrapBook)). Nothing has been left out from the period Dec 2003 to June 2011. From Terry’s site, I made a lot of formatting changes, creating a more easily readable webpage appearance. The PDF chart duplicates of the JPEGs have been omitted for ease and speed of recreating Terry’s pages. References to PDF charts should be ignored (but no chart was left out).
After June 2011, Terry created a paid subscription website. None of that material is found here.
There were many many, many hours spent on this project; downloading Terry’s individual charts & audio files, followed by the uploading of Terry’s charts and audio to my WordPress blog library, after which I had to insert the uploaded material into my new T Theory® webpages (hopefully in the correct places). This was a dull and arduous project and I hope you enjoy it. I don’t believe there remains any more of Terry’s material in free domain, so my T Theory® project is probably finished. If I’ve missed something, you can leave me a comment.
If you find an uploaded reference error (chart or audio in the wrong place), please note the month and year of the webpage, plus the exact name of the referenced error file. Include any other info that will help me locate the problem file and where it occurs on the webpage. Leave a comment for me with the info and I’ll fix it.
Terry’s material is very long and will take many weeks for you to finish. Don’t hurry, it’s not a marathon and you will absorb more if you go through it at a reasonable rate. This is especially true for those who don’t invest in the T Theory® reference encyclopedia. The encyclopedia is a written reference for T Theory® and includes everything of importance for Terry’s T Theory®. Without the reference encyclopedia you must depend on your memory and Terry’s method carries some rules that you could easily violate. The encyclopedia also includes new information never seen on his website.
You are welcome to save any or all of my blog material to your computer. You also have my permission to re-blog my information, but you must (1) credit me and my blog in an obvious manner and (2) don’t change my material.
FYI – I find the best way to save a webpage is using “ScrapBook” (it’s an add-on for the FireFox browser). ScrapBook saves a webpage to your computer EXACTLY as it appears on the day you saved it. You can’t tell the difference between the internet webpage and your ScrapBook saved webpage. The saved pages are not pictures. Instead the pages consist of HTML and page functionality remains identical on your computer. There is also a second method for using ScrapBook, where you can save all of the webpages down to a defined link depth. This optional method means all links will function on your computer to the link depth specified (meaning you can click on links on your saved webpages and tunnel down into pages within pages). Saving the normal way will only save the top webpage but the links that exist could continue to function by taking you to the website on the internet instead of on your computer. But sometimes the linked website doesn’t exist anymore. I’ve had this happen on some very good webpages with unique information (they just disappear into the internet void). That’s a bummer when you lost some really good info and thus rose my need for ScrapBook. You can also filter the pages saved using the optional ScrapBook method, which can exclude all pages not coming directly from the specified website (filtering is recommended using this method otherwise you wind up with a LOT of useless stuff).
.
Explore posts in the same categories: . . . T Theory®
Leave A Reply