April 2006 – T Theory® Update

Gold Stock T
The Current HUI Gold T Construction
The Chart below shows the Gold Bugs Index of mining stocks that is a representative index for most of the good Gold Mining funds such as Tocqueville Gold which I own and which was discussed in an earlier update. At that time I made a rough sketch of the intermediate T interpretation of the bullish trend coming out of the May 05 low and concluded that the Gold Funds, stocks and metal plus probably and natural resource oriented investment would climb fairly steadily into mid year 06.

With the new chart of the HUI I want to spend some time refining the construction of these two historic Ts for the key Gold Mining Index and establish some specific dates for the T Theory time projection. The early T coming out of a Feb 2003 low is completed so we can establish one completed projection. The second T is sustaining itself well but we need to make a more precise calculation of its projected peak date. Most Ts show actually tops as double tops and are likely to top a bit early so the usual objective is to sell what you want before the computed date arrives.
To aid in the computation I have provided a link to the daily ^HUI data at Yahoo below. Anyone can compute the time in days for the left side cash build up and then move out an equal number of days for an accurate projection. The first T is easily done, but the second T will require a calendar to extend the time symmetry out beyond the data. The data is located at
http://finance.yahoo.com/q/hp?s=%5EHUI&a=00&b=4&c=2002&d=03&e=11&f=2006&g=d&z=66&y=0
My preliminary results are posted in the chart. I did not want to put the left end of the second T back to the first of what was a double peak (end of ’03 /early ’04) so I have computed an Oct 2 2006 peak for the second T. The chart assumes a 7 day week not the actual trading days. If you have a date to share, post it here in a comment and we will compare notes. Terry Laundry
Chris Kemp Buy Criteria
The Short Range T Picture & the Chris Kemp Buy Criteria
In this update of the Short Range T picture we see potentially the right conditions for the formation of a T as per my chart below.
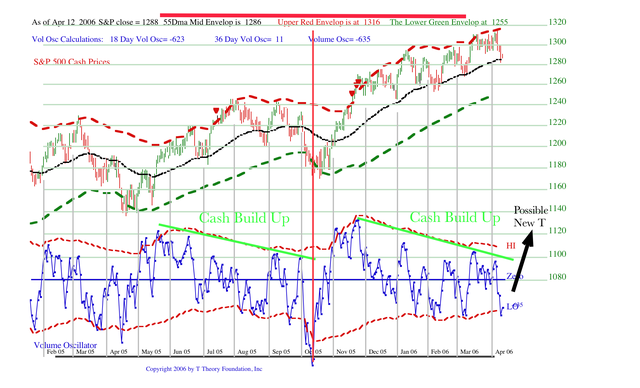
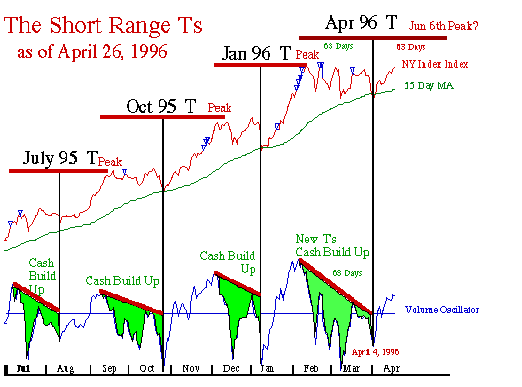
If the trend is a continuing bullish one then the history in the second chart shows the center-post low of a new Short range T is possible from any low sitting on the 55 Day Moving Average of the S&P. We are at that juncture now. Any real strength near term could therefore start a new T as long as the 55 Day MA is not breached downward to any great extent near term and the Oscillator eventually breaks above the green Cash Build Up line sketched in my current chart.
Now let’s move on the Chris Kemp’s thoughts on finding the center post of a new T from his original perspective. As summarized in his note to me:
“Subject: Possible better way to judge the beginning of a new T
Terry, I really have learned and profited from your work. As I understand one of the challenges is determining the breakout of the declining tops, I have possibly come up with a way to better help judge if the new T is beginning. In the attached excel file you will note in the tab marked current chart, I have put a 10 period sma on the T chart. I only have data back to 2002 but the vast majority of valid lows that start a new T come from a level that allows the SMA to get at a minimum below the -50 level. Additionally, as the new T begins to lift the market, each subsequent pullback to the 89 EMA in the index typically will correspond with a turn back up in the 10 period SMA. I would like to test this over a longer period of time to check the validity, but over the last few years it has made me a tremendous amount of money.
It would seem the current T has yet to begin and that the market is not nearly oversold to the level that brings the SMA to below -50. Please let me know where I can get the historical volume data and I will try to look at past dates.”
I thought his concept was original and worthwhile, so I am moving to expand on it as the two of us research it back well before 2002. He has my data and will report later.
In the meantime, I can get started on a few points needed to introduce the philosophy. His starting point was the book Pit Bull in which Marty Schwartz described his success in using the Volume Oscillator to trade S&P futures. He down loaded the McClellan Oscillator Data, using the link at the left, and developed his own Excel spreadsheet to research his own ideas. The Kemp PDF file of his volume oscillator with a slow moving average of the Volume Oscillator is provided below.
One complicating factor is that the McClellan data has its volume calculations scaled to one tenth of mine. So his criteria of first seeing an oversold condition in which a ten day moving average of his Volume Oscillator is down to a minimum of -50 corresponds to a 10 Day MA minimum of -500 in my chart. As the McClellan data is likely to be used by readers and its 4 year record is updated daily, I will make it easy for everyone by dividing my volume data by 10 so the plotted values would match anyone’s calculations derived from the link.
I regard this requirement of a minimum oversold condition as an important first requirement for aggressive traders who are speculating, particularly if they are leveraged. I believe his success results in part by not fooling around with marginal situations. We are both considering a study of the much longer history going back some decades to see what the trade off is for an aggressive trader with regards to a minimum oversold condition. I will address this aspect in a few weeks with a historical study to be posted at the T Theory Foundation site.
The second aspect of the Kemp criteria is to use a separate moving average of the volume oscillator to track its recovery from a suitable deep oversold condition. The Kemp PDF file shows the addition to his volume oscillator plot. There are no date labels on the horizontal axis but the chart shows the rise out of the October low and you can easily compare it to my first chart. Confirmation of a turn is given by the slower moving average when it changes from a decline to an upward slope. Pullbacks, to or slightly below this moving average, if it is headed up, are now interpreted as reasonable buying opportunities. Only when all these criteria are met, is is very likely a powerful new T is underway with good upside price potential.
Much historical work needs to be made and presented before any definite conclusions will be reached. But it seems clear that the opportunities available by the natural succession of Short Range Ts, will have to be divided into categories. The better risk reward ratio for establishing new positions will require a new T in a suitable deep oversold condition. If the current situation does not see a break down below the 55 Day MA then no real oversold condition can be present.
Only if the Volume Oscillator is very deeply oversold will it provide early indications of a turn, so this is an important pre-condition. However as I have mentioned, if you translate the equations from days to hours or minutes then you could then find a comparable concept that would be useful for much shorter trends.
Finally I should mention that this criteria doesn’t really apply to investors who take the longer view. In T Theory, the Advance-Decline Ts provide the better long term outlook. The Advance-Decline line continues to maintain its up-trend so there is no reason to become bearish at this point, as a new T could produce additional gains ahead. However one may not want to add new positions until a solid buying opportunity presents itself in a more oversold condition. Anyway, that is the way I see the concept developing.
We are working on this interpretation and expect to post more research later this month.
Terry Laundry
****************************************************************************************
All Rights Reserved By The T Theory® Foundation ©
Order the T Theory® Encyclopedia
For a complete understanding of the T Theory® and how to successfully use Terry’s unique methods, order the Encyclopedia from Paula at the above link. There is additional material in the encyclopedia not covered here. Paula will be more than happy to answer your questions too.
Many thanks to Paula Burke for her permission to re-post Terry’s old T Theory® explanations. The period re-blogged on these pages are some of Terry Laundry’s best work and was published here from public domain.
****************************************************************************************
I claim no credit for the material found under T Theory® on this blog. All of this material is the creation of Terry Laundry and was downloaded from Terry’s free blog site (TypePad). I have created a mirror of Terry’s original material and now there is a second site containing Terry’s T Theory®. One or both of these websites hopefully will survive through time as Terry’s material is too important to be lost to the ravages of time. This site is simply a memorial to his lifetime work.
The page content re-blogged here is exactly as Terry created on his original webpages (saved on my computer with ScrapBook)). Nothing has been left out from the period Dec 2003 to June 2011. From Terry’s site, I made a lot of formatting changes, creating a more easily readable webpage appearance. The PDF chart duplicates of the JPEGs have been omitted for ease and speed of recreating Terry’s pages. References to PDF charts should be ignored (but no chart was left out).
After June 2011, Terry created a paid subscription website. None of that material is found here.
There were many many, many hours spent on this project; downloading Terry’s individual charts & audio files, followed by the uploading of Terry’s charts and audio to my WordPress blog library, after which I had to insert the uploaded material into my new T Theory® webpages (hopefully in the correct places). This was a dull and arduous project and I hope you enjoy it. I don’t believe there remains any more of Terry’s material in free domain, so my T Theory® project is probably finished. If I’ve missed something, you can leave me a comment.
If you find an uploaded reference error (chart or audio in the wrong place), please note the month and year of the webpage, plus the exact name of the referenced error file. Include any other info that will help me locate the problem file and where it occurs on the webpage. Leave a comment for me with the info and I’ll fix it.
Terry’s material is very long and will take many weeks for you to finish. Don’t hurry, it’s not a marathon and you will absorb more if you go through it at a reasonable rate. This is especially true for those who don’t invest in the T Theory® reference encyclopedia. The encyclopedia is a written reference for T Theory® and includes everything of importance for Terry’s T Theory®. Without the reference encyclopedia you must depend on your memory and Terry’s method carries some rules that you could easily violate. The encyclopedia also includes new information never seen on his website.
You are welcome to save any or all of my blog material to your computer. You also have my permission to re-blog my information, but you must (1) credit me and my blog in an obvious manner and (2) don’t change my material.
FYI – I find the best way to save a webpage is using “ScrapBook” (it’s an add-on for the FireFox browser). ScrapBook saves a webpage to your computer EXACTLY as it appears on the day you saved it. You can’t tell the difference between the internet webpage and your ScrapBook saved webpage. The saved pages are not pictures. Instead the pages consist of HTML and page functionality remains identical on your computer. There is also a second method for using ScrapBook, where you can save all of the webpages down to a defined link depth. This optional method means all links will function on your computer to the link depth specified (meaning you can click on links on your saved webpages and tunnel down into pages within pages). Saving the normal way will only save the top webpage but the links that exist could continue to function by taking you to the website on the internet instead of on your computer. But sometimes the linked website doesn’t exist anymore. I’ve had this happen on some very good webpages with unique information (they just disappear into the internet void). That’s a bummer when you lost some really good info and thus rose my need for ScrapBook. You can also filter the pages saved using the optional ScrapBook method, which can exclude all pages not coming directly from the specified website (filtering is recommended using this method otherwise you wind up with a LOT of useless stuff).
.
Explore posts in the same categories: . . . T Theory®
Leave A Reply