January 2006 – T Theory® Update

T Theory Topics January 5 2006
My next update is expected on January 26 2006 but I will briefly note any important junctures as they occur.
In this update I have a number of interesting topics to discuss that mostly deal with the 2006 forecast as developed by the big Advance-Decline T below and refined by my new Rate T summary chart that follows. Also we will look at the ongoing saga of the the current short range T chart . Finally I will take a look at Gold which has broken out of a two year sideways trading range within the biggest long range price T making it a good bet for non traditional upside 2006 potential plus the related $XOI (Oil) breakout that still looks to be developing.
Some time ago (see Archives) I reviewed the details of the current big A-D T’s construction and compared it to the comparable A-D T coming out of the 1932 bottom to illustrate the basic time symmetry concept. In that analysis I showed that the multiple bottoms in late 2002/early 2003 should be taken as an overall bottom formation and the center of the T should split this bottom range. The left end of these Ts is always at the prior A-D line peak which is very obvious in the chart. Thus the left side of this T is well defined by a cash build up period of about 4.5 years. Assuming inherent time symmetry, which is the fundamental basis of all Ts, then the market advance in stock prices (the S&P) should persist within the right side of the T for an identical time period; that is from the ’03 low to the projected market peak, computed to be near March 2007.
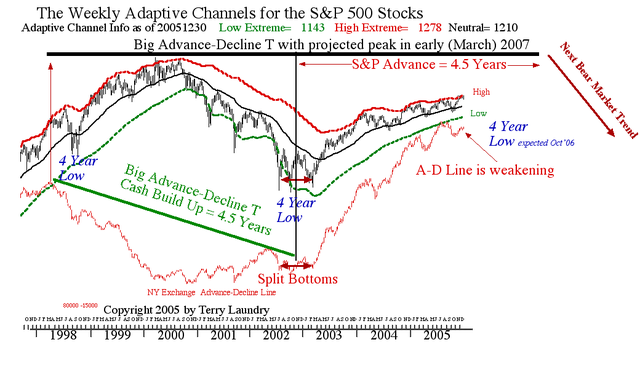
There are no new conclusions here. But we do have another year of history and see the modest pullback to the 200 day or 39 week MA once again as the normal correction low in an ongoing T rally. The new element in this intermediate term forecast is the sequence of Rate Ts that I have been working on as the basis for a more complete study. It is very preliminary in the next chart and will take about another month to get into shape for serious work. But even now I can work on the errors and get a handle on the next rate T projection of a early November 2006 low. Like the low scheduled for early November 2005, this is a traditional Fall low, however for the new year, this is also the most widely respected cyclical low (commonly attributed to the election cycle) since this cycle averages about 4 years from its 1949 starting point. I did a study on this cycle some 7 years ago and will post it here when time permits.
In any case the conclusion is that in this unique circumstance the cycle will be blunted on its normal downside, probably still holding the 39 week MA and once the low is completed, probably in October, the market will rally sharply into the March 2007 peak then collapse as occurred in the 1930’s example thereby proving it is the T rather than the cycle that is key. My study suggests that the post March 2007 decline could be very steep, as per the late 1930’s example or the 1987 plunge. Why is not yet apparent, but it could have something to do which a final speculative run up into early 2007 that lifts the Dow to all time new highs. It could be that the Asian markets will have become too popular or perhaps that the Fed will have tightened too much and may have already triggered a new economic slowdown. But as far as my general T forecast for the next 2 years is concerned, the big threat is the post March 2007 T peak period, not this Fall’s expected 4 year cycle low. The weakness in the A-D Line was noted earlier as a potential negative for this year and is now more apparent. However this negative can be overcome by simply following the bigger (Japan, Natural Resource) Ts or emerging market’s as per my last update. I will focus on this aspect in my January 26th Update with country or regional Ts.
Now let us move on to my preliminary Rate T chart. The objective here was to write a program that would display the precise location of Ts in an S&P vs 30 Year Interest Rate chart of my own construction. The current Ts placement is crude because I don’t have an oscillator to define momentum highs (T’s left end peak) and lows ( T’s center post low) which I am assuming tends to shift the Ts to the right. I am delaying any refinements in this area for now because I have an additional period of time 1978 to 1994 to explore for new Ts and especial any very large Ts. Very long Rate Ts from the pre 1994 period might allow me to estimate the location of the post March 2007 peak’s eventual low, just as the biggest T in this chart did for the 2002 momentum low.
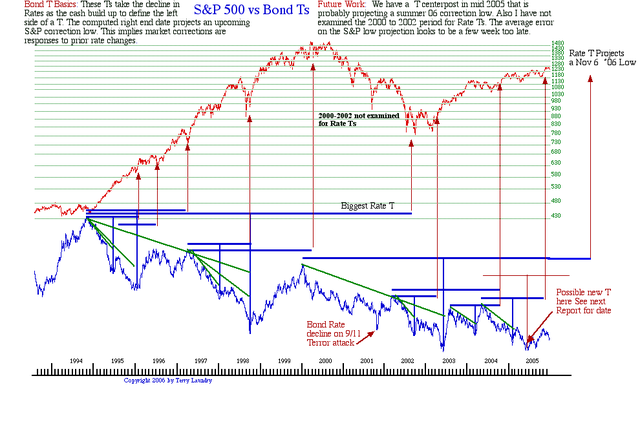
In the mean time, there is a simple procedure I can work out over the next few weeks to reduce the systematic error that is likely in this chart. I will simply estimate the actual lows center period for each Rate T and compare it with the projected date to compute the error for each T. The average of these errors can be taken as the systemic error which may be reduced after the oscillators are developed. The fluctuations around this average error can be considered the random one we can never anticipate. These random errors have to be accounted for by estimating the standard statistic range of the uncertainty. When done I will simple take the current Rate Ts projection of a Nov 6 2006 low and subtract the systemic error which will probably bring the estimate back into October 2006. I can then supply the standard deviation for the random errors. This will then provide a more correct estimate for the next Rate T target low date along with a plus or minus range that will more adequately describe the likely next low date range of possibilities.
The question remains as to when the market might peak before the drop into the projected low. It looks like a six weeks lead time might be a reasonable estimate but I can also calculate the lead time for all Ts and post a similar summary to make a statistical estimate. However there are better ways to do this which I will discuss in my next report. Note there is a “not computed” T in the mid 2005 low that looks to be calling for a Summer time correction. This probably is the decline off of the next Short Range T that follows the current T’s expiration below but is unknown at this time.
Moving on to the next chart of the Short Range T we see what appears to a high level consolidation in the S&P that may be over. The index fell close to the 55 day MA support and the blue volume oscillator came close to the red envelop low. I have no idea whether a completed low has been seen but would give the strong action so far the benefit of the doubt and not look for any decline below the sideways base noted in the chart. The interesting aspect of this environment that is clear and worth noting is the divergence between the strong volume trend here vs the weak A-D breadth performance in the first Intermediate chart.
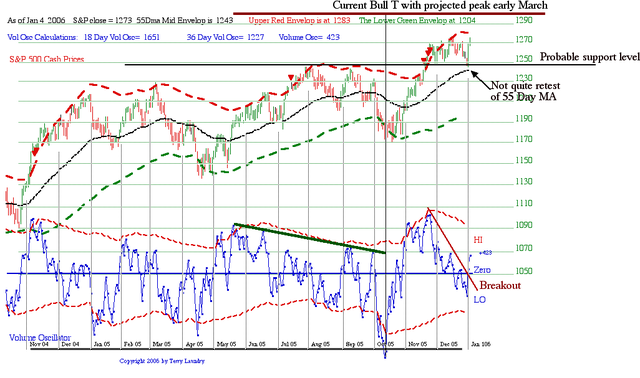
The natural assumption is that we are seeing increasing amounts of money being pored into few stocks. This is likely to be sign of increased speculation and signs that aggressive traders or investors (hedge funds etc) are becoming momentum investors. This favors the strong stocks as money simply chases more money. It is generally negative for small cap stocks because they tend to follow the A-D Line which is essentially an un-weighted index that favors the more numerous small companies.
Now turning to the week $XOI Index that plots Oil related companies, I want to follow up on my last update and comment on the practical use of the Rate Ts. In this longer term weekly chart I have sketched in some Rest vs Run periods just to illustrate that in a long term up trend like we have had for Oil it is perfectly normal for the rising trend to rest or consolidate for a while, then make a strong run for a comparable period, before resting again. It is technically interesting that sometime these evolving trends can be interpreted by the Ts but I have not sketched any here. These T are almost never useful for trading purposes because in a long term trend it is a waste of time and energy to trade because catching the next T’s center post low is problematic at best.
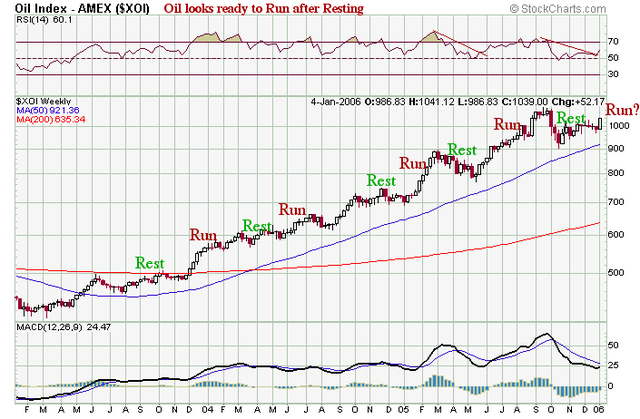
There are however special times when knowledge of the pattern might be useful. If one were looking to buy for the first time, its clear that the breakout from a consolidation would be a good focal point to get started. Also one would want to avoid buying if a T appears to be ending. The other useful application is in larger Ts where any projected peak info might be useful. For example in my last report I showed the Japan market breaking out of a sideways consolidation that may be currently operating on a time limitation related to the length of this prior consolidation. Looking at Japan fund charts I think I see a projection of a roughly mid 2006 peak. I will work on this for my next report. But I have concluded that there is no important peak coming at the end of the current short Range T projected for early March and perhaps the next Short Range T will project a more important peak.
The other point that I would make is that most of us need not worry about good positions just because short term considerations might calling for correction or consolidations because we now have the very powerful Rate T chart to help guide us. The exciting aspect of the Rate T chart isn’t in the accuracy of the projections but rather the following important observations. It appears from the 1994 to present period that all rate T projections do cause important corrections that might very well be of interest to longer term investors.
Looking over the Rate T history, and setting aside the errors on projected low dates, the key point for the longer term investors, at least using the 1994 to present history, is that all rate Ts eventually project some sort of important correction, at least back to the 39 week MA, I think. More importantly is also appears from this history that no important corrections have occurred unless the rate T construction has previously warned of a future correction some months in advance. If that is all true, then the fact that there is are only two Rate T low corrections possible might imply that the early part of the year will be quite strong. As a minimum, it suggests that investors need not be overly concerned over serious corrections near term or at the early March projected peak for the current Short Range T.
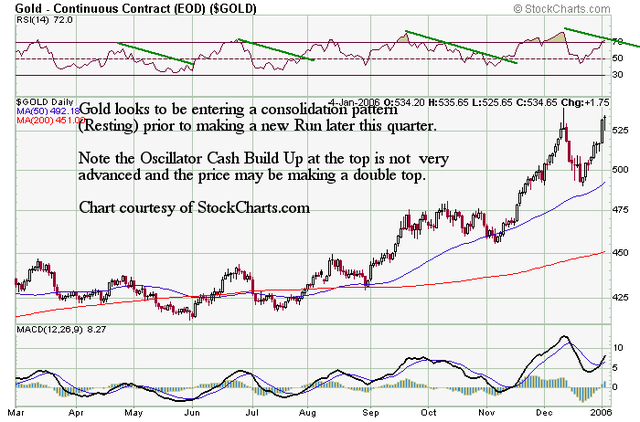
The final chart shows the daily Cash Build Ups I think might be useful to follow Gold. The last cash build up produced a big rally but topped early. The subsequent recovery back to the old highs is impressive but no cash build up of normal size is yet evident. In time I expect a new T to be confirmed but it may take additional time for a longer declining tops pattern to develop in the RSI oscillator, as I have sketched. You can follow the chart development on your own but I continue to be bullish and will buy any dips.
Update January 23 2006
My next update is expected on Thursday February 9th 2006 but I will probably post a Bond T Study at my T Theory Foundation site (www.ttheoryfoundation.org) in a week or so.
I am publishing my scheduled January 26th update early because the market fell quite sharply on last Friday and is approaching the S&P 1255 55 Day MA support level that should see bottoming action near term generally around S&P 1255. Once a bottom is confirmed we should see resumption of the current T’s rise to a projected peak probably closer to the end of February than my prior estimate of early March.
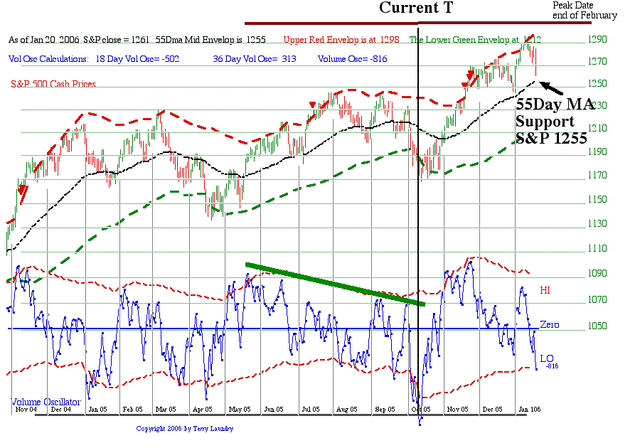
See the Daily Chart above for the latest plots. Click on the visible chart to enlarge it or down load the PDF versions using the link below. The 55 Day MA is the normal support for a bullish trend and should mark the maximum downside but a slight brief penetration is OK.
Terry Laundry
****************************************************************************************
All Rights Reserved By The T Theory® Foundation ©
Order the T Theory® Encyclopedia
For a complete understanding of the T Theory® and how to successfully use Terry’s unique methods, order the Encyclopedia from Paula at the above link. There is additional material in the encyclopedia not covered here. Paula will be more than happy to answer your questions too.
Many thanks to Paula Burke for her permission to re-post Terry’s old T Theory® explanations. The period re-blogged on these pages are some of Terry Laundry’s best work and was published here from public domain.
****************************************************************************************
I claim no credit for the material found under T Theory® on this blog. All of this material is the creation of Terry Laundry and was downloaded from Terry’s free blog site (TypePad). I have created a mirror of Terry’s original material and now there is a second site containing Terry’s T Theory®. One or both of these websites hopefully will survive through time as Terry’s material is too important to be lost to the ravages of time. This site is simply a memorial to his lifetime work.
The page content re-blogged here is exactly as Terry created on his original webpages (saved on my computer with ScrapBook)). Nothing has been left out from the period Dec 2003 to June 2011. From Terry’s site, I made a lot of formatting changes, creating a more easily readable webpage appearance. The PDF chart duplicates of the JPEGs have been omitted for ease and speed of recreating Terry’s pages. References to PDF charts should be ignored (but no chart was left out).
After June 2011, Terry created a paid subscription website. None of that material is found here.
There were many many, many hours spent on this project; downloading Terry’s individual charts & audio files, followed by the uploading of Terry’s charts and audio to my WordPress blog library, after which I had to insert the uploaded material into my new T Theory® webpages (hopefully in the correct places). This was a dull and arduous project and I hope you enjoy it. I don’t believe there remains any more of Terry’s material in free domain, so my T Theory® project is probably finished. If I’ve missed something, you can leave me a comment.
If you find an uploaded reference error (chart or audio in the wrong place), please note the month and year of the webpage, plus the exact name of the referenced error file. Include any other info that will help me locate the problem file and where it occurs on the webpage. Leave a comment for me with the info and I’ll fix it.
Terry’s material is very long and will take many weeks for you to finish. Don’t hurry, it’s not a marathon and you will absorb more if you go through it at a reasonable rate. This is especially true for those who don’t invest in the T Theory® reference encyclopedia. The encyclopedia is a written reference for T Theory® and includes everything of importance for Terry’s T Theory®. Without the reference encyclopedia you must depend on your memory and Terry’s method carries some rules that you could easily violate. The encyclopedia also includes new information never seen on his website.
You are welcome to save any or all of my blog material to your computer. You also have my permission to re-blog my information, but you must (1) credit me and my blog in an obvious manner and (2) don’t change my material.
FYI – I find the best way to save a webpage is using “ScrapBook” (it’s an add-on for the FireFox browser). ScrapBook saves a webpage to your computer EXACTLY as it appears on the day you saved it. You can’t tell the difference between the internet webpage and your ScrapBook saved webpage. The saved pages are not pictures. Instead the pages consist of HTML and page functionality remains identical on your computer. There is also a second method for using ScrapBook, where you can save all of the webpages down to a defined link depth. This optional method means all links will function on your computer to the link depth specified (meaning you can click on links on your saved webpages and tunnel down into pages within pages). Saving the normal way will only save the top webpage but the links that exist could continue to function by taking you to the website on the internet instead of on your computer. But sometimes the linked website doesn’t exist anymore. I’ve had this happen on some very good webpages with unique information (they just disappear into the internet void). That’s a bummer when you lost some really good info and thus rose my need for ScrapBook. You can also filter the pages saved using the optional ScrapBook method, which can exclude all pages not coming directly from the specified website (filtering is recommended using this method otherwise you wind up with a LOT of useless stuff).
.
Explore posts in the same categories: . . . T Theory®
Leave A Reply