02/14/13 – Oil Independence??

MARKET MESSAGES
2/14/13
A subject dear to my heart, oil independence. You gotta dig to find the truth to oil independence because the mainstream media isn’t going to carry the boring details of our oil production problems.
This cartoon symbolizes the problems with U.S. oil consumption/production in the USA.

The illustration above is from “Through the Looking-Glass”. At the top of the hill, the Red Queen begins to run, faster and faster. Alice runs after the Red Queen, but is further perplexed to find that neither one seems to be moving. When they stop running, they are in exactly the same place. Alice remarks on this, to which the Red Queen responds: “Now, here, you see, it takes all the running you can do to keep in the same place”.
Today there are a couple of reports on oil production in America written from different industry aspects, financial and geological.
For reference, the U.S. consumes a BILLION BARRELS of oil in 52 days.
So a 10 billion barrel reserve is less than 1.5 years of American’s oil consumption. You gotta keep that in perspective when you read about oil independence. In other words, for oil independence we need reserves in the trillions and trillions of barrels, not billions and billions.
Thankfully we are headed in a better direction and in a couple of decades (hopefully sooner), we will have completely broken our addiction to oil.
The first report is taken from CNBC, written by Citigroup’s Edward Morse regarding oil independence. It provides a more glowing outlook towards energy independence. I believe this report could be true with more co-operation from Congress (translated – MONEY). But that ain’t gonna happen, not with our budget problems.
…………………………………………………………………………………………………………………………………………
U.S. Is on Fast-Track to Energy Independence: Study
U.S. oil and gas production is evolving so rapidly—and demand is dropping so quickly—that in just five years the U.S. could no longer need to buy oil from any source but Canada, according to Citigroup’s global head of commodities research.
Citigroup’s Edward Morse, in a new report, projects a dramatic reshaping of the global energy industry, where the U.S., in a matter of years, becomes an exporter of energy, instead of one of the biggest importers.
The shift could sharply reduce the price of oil, and therefore limit the revenues of the producing nations of OPEC, as well as Russia and West Africa. Those nations face new challenges: not only are the U.S. and Canada increasing output, but Iraq increasingly is realizing its potential as an oil producer, adding 600,000 barrels a day of production annually for the next several years.
“OPEC will find it challenging to survive another 60 years, let alone another decade,” the report by Morse and other Citi analysts said. “But not all of the consequences are positive, for when it comes to the geopolitics of energy, the likely outcomes are asymmetric, with clear cut winner and losers.”
The U.S. is a winner in many ways. Its super power status could be prolonged because of this new growth in oil and shale gas production, made possible by “fracking” and other non-conventional drilling technologies.
Crude oil generated the largest single annual increase in liquids production in U.S. history last year, with an increase of 1.16 million barrels per day. Oil production is booming in places like Texas and North Dakota, which has the lowest unemployment in the country at just 3 percent last September, compared to the national rate of 7.8 percent then.
Citi analysts also foresee a new era of U.S. industrialization, fueled by cheaper power. They cite dozens of industrial projects across America that have already begun or are planned, in such industries as auto, chemicals and steel. (Read More: Winter Storm May Stall Gas Price Climb)
The oil producing nations of OPEC, and others, will have to adjust to a world of lower prices. Separately, OPEC, in its February report Tuesday, commented about the U.S., noting it is the fastest growing producer this year among the non-OPEC nations. But it noted there are risks associated with these supply forecasts, including weather and technical, environmental and price factors, as well as the heavy decline associated with shale drilling in the first year of production.
(Read more: OPEC Points to Risks in US Energy Forecast)
Citigroup’s report predicts a price decline in crude oil that will impact all producers -— and consumers. Brent crude, the international benchmark, could trade in a new lower range of $70 to $90 per barrel by the end of the decade, from its recent range of $90 to $120 per barrel, Citi projects. That would be below the break-even levels required by many producing countries. The price required by Saudi Arabia is $71, and Kuwait is $44 per barrel, but many other countries have break-even levels of $110 or greater.
“This is a momentous year for what’s happening, and we’re having almost two million barrels a day of pipeline capacity built out in the U.S.,” Morse said on “Fast Money.” “The U.S. is actually going to push out about 700,000 barrels a day of light sweet crude imports this year. We think as a result of that, plus production elsewhere, we think the price is going to average, by the time you get to December, $10 less than where it is right now.”
As the U.S. and Canada rise, some oil producing countries could face the threat of becoming “failed states” as their leadership grapples with greater pressure for economic and political reform while resource revenues decline, the report said. Others, especially China, could make up for some of the demand, but not all.
“Nigeria, the picture is fairly bleak. Venezuela is pretty bleak,” Morse said.
As for Russia, “If it is the case that what is now a $90 Brent floor price becomes a $90 Brent ceiling price, given the dominance of hydrocarbon exports in Russian revenue, there could be a three percent hit to GDP which is by no means insignificant over the next five years. because that’s how critical hydrocarbons are,” he said. “Here you have a country that requires, on its own public record, $117 per barrel Urals crude, on average, to balance their budget. If the price of oil collapses to only as low as $90 a barrel, it does have that order-of-magnitude effect.”
At the same time, Citi sees a big impact on the U.S. economy. The current account deficit is about 3.2 percent of GDP, and the oil import bill is 1.7 percent of GDP. Citi expects that energy self-sufficiency, combined with the impact of low natural gas prices, could cut the current account deficit by up to 2.4 percent of GDP, with an associated improvement in the dollar of 1.6 to 5.4 percent.
To realize this production boom, the energy industry’s near-term challenge is moving the U.S. and Canadian oil that is locked in the heart of the continent because of insufficient pipeline transportation. Citi expects that to improve but in the meantime, the railroad industry is helping pick up the slack, shipping U.S. crude across the continent, and creating big demand for rail tanker cars.
Interdependent North America
The Citi report, titled “Energy 2020: Independence Day,” also projects a larger and quicker decline in demand for oil in the U.S. over the next decade or two, due to efficiency and the shift to cheaper natural gas.
For instance, Citi expects 30 percent of the U.S. heavy duty truck fleet to turn to natural gas-based fuel by 2015, well above the 10 percent it previously forecast. That would reduce diesel demand by an estimated 600,000 barrels per day. It also expects new automotive efficiency standards to reduce U.S. oil production by two million barrels per day, up from the one million forecast last year.
“Starting this year, North American output, as we indicate in this report, should start to have tangible impacts both on global prices and trading patterns, and will eventually turn the global geopolitics of energy on its head,” the report said.
Morse surprised markets a year ago with a report that envisioned the U.S. as part of an energy independent North America. Since then, the view has become mainstream. The International Energy Agency forecast last fall that the U.S. will overtake Saudi Arabia and Russia as the top oil producer by 2017. The IEA also forecast that North America could become a net oil exporter by around 2030 and the U.S. could become nearly self-sufficient by 2035.
Morse’s latest report, released Tuesday, has an even more aggressive view of the U.S. move to dominance as an energy producer.
If crude oil and field condensates, natural gas liquids, renewable fuels and refinery processing gains are counted, the report put U.S. production at 11.2 million barrels per day at the end of 2012, making the U.S. the biggest oil producer already last year.
Canadian production is expected to increase to 6.5 million barrels per day, and even Mexico is now expected to join the North America energy renaissance under a new government interested in exploiting its resources.
In the past six years, oil imports into the United States have been cut in half, after peaking in 2006.
“The numbers are striking. The month of peak was 12.6 million barrels a day in October 2006 and … now it’s under six, and by late 2012 totaled 6.8 million bpd,” Morse said in an interview.
Since 2006, U.S. oil field production of crude, plus natural gas liquids and bio-fuels has grown by three million barrels a day, about the same as the total output of Iran, Iraq, or Venezuela. In the same period, Canadian production has grown by 510,000 barrels a day.
“The impact of this extraordinary production growth is becoming increasingly apparent and even if the growth rate subsides in the years ahead the mushrooming impacts of this growth will have dramatic impacts,” the report said. “A half decade from now combined US and Canadian output will be in surplus of projected needs. Over the next five years, demand for natural gas in the US should catch up with supply, opening up unexpected opportunities in transportation and igniting a re-industrialization of the country.”
Morse, in an interview, said the U.S. could in theory need to import only from Canada within five years. “Our projection of U.S. supply growth and U.S. demand collapse is to levels where the U.S. will not need to import oil from any other country except for Canada,” he said.
He expects to see a fight for market share in the U.S. and the ultimate result will be that the U.S. could re-export some Canadian crude. “But technically there should be no room for anyone else’s crude,” he noted.
But this does not mean the U.S. will be immune to price spikes, even with its growing supply. “Disruptions actually affect the price of oil globally and the more integrated we are in the world oil economy, the more we’re going to be impacted by it. If there’s a price spike, we’re going to feel the price spike but the weight of our production is going to make that prices pike come from a much lower base in the future than it is now,” Morse said on “Fast Money.”
2013—Year of Change
U.S. oil has been landlocked in the Midwest, lacking a strong transportation system to bring supply to refining areas. A hodge podge of pipeline and rail transport has taken over, as the industry awaits further pipeline development, including the stalled Keystone pipeline.
But Citi points out that 2013 brings big change, what it calls “the most dramatic year of change ever in light sweet crude flows.” Pipeline capacity in the U.S. will expand by 1.7 million barrels a day, and up to 600,000 barrels of new rail capacity will be opened between the U.S. and Canada. The report said there is an expected near doubling of receiving capacity of rail-shipped oil from 2012 to 2013.
The industry has innovated where necessary. Lacking pipelines, over half the North Dakota crude production, of 480,000 barrels a day at the end of 2012, was estimated to have been moved by rail. Much of it went to St. James, La., and Port Arthur, Texas and Mobile, Ala. Bakken is also being railed to facilities in Albany, N.Y., and New Brunswick, Canada.
The report also points out the big backlog in rail cars, many of them tank and hopper railcars. Citi said American Railcar Industries last fall said backlog for rail-cars at the end of September was 61,400, and 75 percent were tank rail-cars. Tank rail-cars transport materials like crude, chemicals, propane ethanol and asphalt.
Independent North America
The report describes how shipments of oil from West Africa have been waning and as early as this summer, West African crude shipments into the U.S. Gulf Coast could be unnecessary. East Coast refiners could also decrease dependence on West African crude, replacing more imports with midcontinent oil, brought in by rail from Pennsylvania and Virginia to upstate New York and New Jersey. That would also have a likely impact on gasoline prices, currently at record highs for this time of year because of refining issues.
There is also pressure to move light sweet crude from the Gulf Coast to higher value locations. For instance, Morse expects to see light sweet crude move form the U.S. Gulf Coast to eastern Canada, displacing more West African imports to North America.
Citi expects that within in two years, there could be pressure for more exports to other destinations or for pipelines on the East Coast or to change laws that would allow shipping of crude from the Gulf Coast to the East Coast by non-U.S. flagged ships.
By the end of 2014, Citi expects that sour Canadian crude should make its way to the Gulf Coast by way of new pipelines and that should provide a challenge for other producers shipping to the Gulf Coast, including Saudi Arabia, Iraq, Kuwait , Venezuela and Mexico. Morse says they could be pushed out by Canadian crude, or these producers could preserve market share by cutting prices.
Canadian and U.S. crude should be delivered in greater quantities to the U.S. East Coast and Gulf Coast by mid-decade. A happenstance of poor transportation for all this energy wealth leaves Canadian crude locked in North America, but with exporting ability through the U.S. Gulf Coast until pipelines are approved and built in Canada. Morse said if that were to happen, Canada could see an export boom to the Pacific basin, turning Canadian crude into the benchmark for that region.
The report notes that even before Canada builds pipelines to the Pacific: “There should be exports of crude from the U.S. Gulf Coast – Canadian crude for sure and potentially U.S. crude if the U.S. succumbs to economic logic and lifts current multiple bans on exports,” the report said.
Asked how his report has been received so far, Morse said, with an ironic laugh, that he’s had some “push back but not as much as last year.”
…………………………………………………………………………………………………………………………………………
The following comments were taken from OilDrum.com and provide a differing viewpoint regarding U.S. oil independence. The articles on the OilDrum.com are written by geological professionals and provide the harsh realities of oil consumption and oil production. It’s probable that we are closer to reality with these outlooks instead of Citigroup’s report.
…………………………………………………………………………………………………………………………………………
Tech Talk – Future Bakken Production and Hydrofracking
Posted by Heading Out on February 11, 2013 – 4:10pm
Before there were refrigerators folks kept drinks cool by putting them into clay jars that had been soaked in water. The evaporation of the water from the clay cooled the container and its contents, which today includes wine bottles. On the other hand, for many years artisans have taken clay in a slightly different form, shaped it and baked it and provided the teacups which keep the liquid inside until we drink it.
Two different forms of the same basic geological material, with two different behaviors and uses. Why bring this up? Well, there is a growing series of articles which continue to laud the volumes of oil and natural gas that the world can expect from the artificial fracturing of the layers of shale in which these hydrocarbons have been trapped for the past few million years. It has been suggested that there is no difference between this “unconventional” oil and the “conventional” oil that has been produced over the past century to power the global economy. And yet, despite the scientific detail which some of these critics discuss other issues, they seem unable to grasp the relatively simple geologic and temporal facts that make the reserves in such locations as the Marcellus Shale of Pennsylvania and the Bakken of North Dakota both unconventional and temporally transient. Let me therefore try again to explain why, despite the fact that the oil itself may be relatively similar, the recovery and economics of that oil are quite different from those economics involved in extracting conventional deposits.
But before getting to that, let’s first look at the current situation in North Dakota, using the information from the Department of Mineral Resources (DMR). According to the January Director’s Cut the rig count in the state has varied from 188 in October, through 186 in November, and 184 in December, to 181 at the time of the report. Why is this number important? Well, as I will explain in more detail later, the decline rate of an individual well in the region is very high, and thus the industry has to continue to drill wells at a rapid rate, just to replace the decline. (This is the “Red Queen” scenario that Rune Likvern has explained so well.) The DMR recognize this by showing the effect of several different scenarios as the number of rigs changes.
For example, they project that 170 rigs will be able to drill around 2,000 wells a year. At that level, and with some assumptions about the productivity of individual wells that I am not going to address here, but which Rune discussed, I would suggest that it is irrational to expect that new wells will continue to sustain existing first year levels as the wells move away from formation sweet spots. Yet, accepting their assumptions for now, DMR project that the 170 rigs will generate the following production from the state:
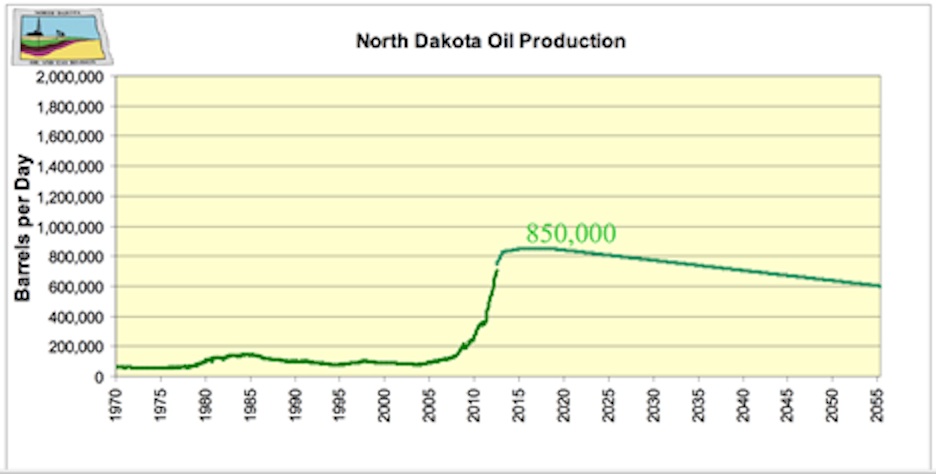
Figure 1. Achieved and projected North Dakota production when 170 rigs are used to continue to develop the field into the foreseeable future. (ND DMR).
The DMR plot also assumes that the wells are developed and brought into production in a timely manner. In October the state produced an average of 749 kbd of oil, which was through mid-January, the current peak level of production. Currently it is estimated to cost $2 million to frack a well, and in January there were 410 wells waiting on that service.
In order to reach a higher level of production (and bear in mind that OPEC has been projecting significant further increases in production to make their anticipated supply and demand levels balance) the DMR looked at estimates of production if there were 225-250 rigs, and contrasted that with what would happen if the rig count fell almost immediately to 60.
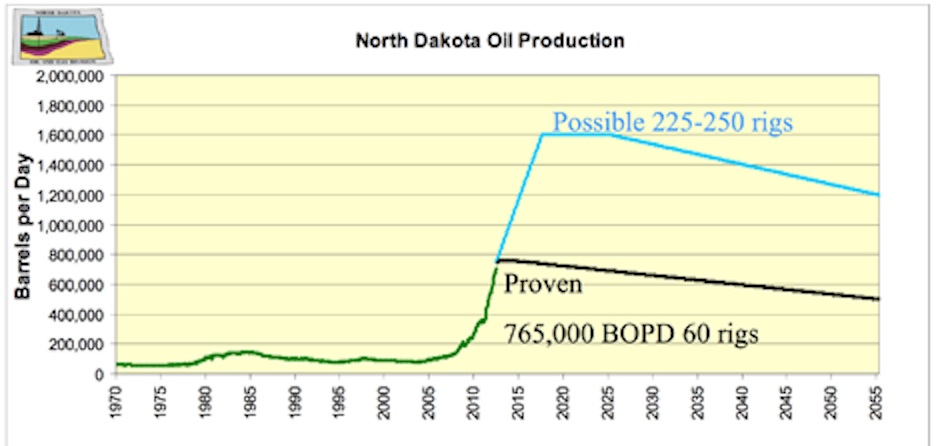
Figure 2. North Dakota oil production with either 225-250 rigs, or with 60. (ND DMR)
Note that at 60 rigs, the state production goes into an immediate decline. Somewhere in between those two extremes lies the likely future, but with the Director noting a December price of $77.09 that future may be at the lower, rather than higher end of the scale. (Though in January it popped back up to $87.25).
To illustrate the sensitivity of these numbers consider that if the rig count fell from 170 to 100, then production would decline to 800 kbd but would still fall into decline in 2020, while at 200 rigs the production would rise to a peak of 1 mbd, although the peak interval might only be four years from the 2,400 new wells added each year.
The ferocity of the decline rates of these wells is part of the reason that they are called unconventional, since they do not behave in the same manner as a conventional well, nor can they be developed in a similar way.
To return to the geology of the deposits (and shale is a consolidated clay) the middle Bakken formation is made up of a combination of layers of shale, sandstone, siltstone and limestone. These are, in general, rocks that have a very low permeability, and that property was explained in more detail in an earlier post. Simplistically it is a measure of how easy it is for fluid to flow through the rock, and for most of the Bakken rock it is not easy at all. If it were then there would be no need to put in the crack paths that the oil uses to reach the well. Let me repeat a figure from that post:

Figure 3. Block of sandstone with a crack in it (shown by the arrows).
I have been on a site where my hosts (a federal agency) had injected fluid that they were hoping would penetrate a layer of ground so that it would form an impermeable barrier. It had not, even though the ground was relatively easy for the fluid to penetrate. Instead it had all flowed into a crack no bigger than the one shown in the picture above, and the attempt was a failure.
Put that into reverse where you are trying to pull fluid out of the ground. There are two places where the fluid (oil or gas) is located, in the natural cracks and joints of the rock – which the hydrofrack is designed to cut across. And in the much lower permeability of the blocks of rock that are edged by these fractures, bedding planes and joints.
Figure 4. Representation of a horizontal well drilled in the Marcellus, shown against the natural fracture pattern (Source AAPG)
Over the millennia the oil/gas has migrated to those bedding planes and natural joints and fractures in the rock. When the well is first put in place, that fluid is more easily available to flow through the intersecting crack pattern to the well. But as those interstices empty out it is much more difficult to move the oil from the rock surrounding the natural cracks into that crack and thence to the well.
Most illustrations of hydraulic fracturing show a network of artificially induced cracks getting more numerous as they move away from the well. That actually is not the way it normally happens. The majority of the cracks that open are already there, and these are much easier to develop – as my unfortunate hosts learned – that it is to try and generate a multiplicity of new fractures, as I have previously explained here and here. The production, to go back to my initial metaphor, begins to move over that first year of production and then dramatically fall in yield, from relying on the permeability of the wine cooler part of the rock, to that of the teacup.
…………………………………………………………………………………………………………………………………………
Is Shale Oil Production from Bakken Headed for a Run with “The Red Queen”?
Posted by Rune Likvern on January 1, 2013 – 7:12am
In this post I present the results from an in-depth time series analysis from wells producing crude oil (and small volumes of natural gas) from the Bakken – Bakken, Sanish, Three Forks and Bakken/Three Forks Pools – formation in North Dakota. The analysis uses actual production data from the North Dakota Industrial Commission as of July 2012 from what was found to be a representative selection of wells from operating companies and areas.
The reference in the title to the Red Queen from “Through the Looking-Glass” by the English author Charles Lutwidge Dodgson (perhaps better known as his pseudonym Lewis Carroll) who was also a mathematician and logician, is deliberate to create associations with the Red Queen’s statement “It takes all the running you can do, to keep in the same place”.
After presenting, discussing and concluding the results from the study presented in this post, the reference to the Red Queen was found to be an apt analogy to describe why technology and/or price cannot overcome the inevitable fact that field size and well productivity declines in most plays, whether in shale or any other plays. Put in a different way: shale plays do not get a pass on the laws of physics or the history of play and basin developments.The potential and technology for extraction (production) of shale/tight oil has been around for several decades.
There is every reason to embrace the recent additions of shale oil (from Bakken, Eagle Ford and other plays). These additions will help ease the present tight global oil supply situation and thus slow down the growth in oil prices.
Alice running with The Red Queen
Figure 01: The illustration above is from “Through the Looking-Glass”. At the top of the hill, the Red Queen begins to run, faster and faster. Alice runs after the Red Queen, but is further perplexed to find that neither one seems to be moving. When they stop running, they are in exactly the same place. Alice remarks on this, to which the Red Queen responds: “Now, here, you see, it takes all the running you can do to keep in the same place”.
MAJOR FINDINGS FROM THE STUDY
All charts in this post are clickable for a larger version.
Findings from this in-depth study of time series for production from some individual wells:
- Presently the estimated breakeven price for the “average” well in the Bakken formation in North Dakota is $80 – $90/Bbl In plain language this means that presently the commercial profitability for new wells is barely positive.
- The “average” well now yields around 85 000 Bbls during the first 12 months of production and then experiences a year over year decline of 40% (+/-) 2%
- The recent trend for newer “average” wells is one of a perceptible decline in well productivity (lower yields)
- As of 2007 and also as of recent months, the total production of shale oil from Bakken, has shown exceptional growth and the (relatively high) specific average productivity (expressed as Bbls/day/well) has been sustained by starting up flow from an accelerating number of new wells
- Now and based upon present observed trends for principally well productivity and crude oil futures (WTI), it is challenging to find support for the idea that total production of shale oil from the Bakken formation will move much above present levels of 0.6 – 0.7 Mb/d on an annual basis.
Authoritative research companies (like Bernstein Research) and widely acknowledged specialists/institutions like USGS and SPE have recently and in general arrived at identical conclusions by applying different sets of methodologies and from studying other areas.I am of course in no position to rule out that the required breakeven price in the future could be lowered driven by technological innovations and improvements in well design and operations. However recently there have been a flow of reports that casts a reasonable doubt that this will become a given.
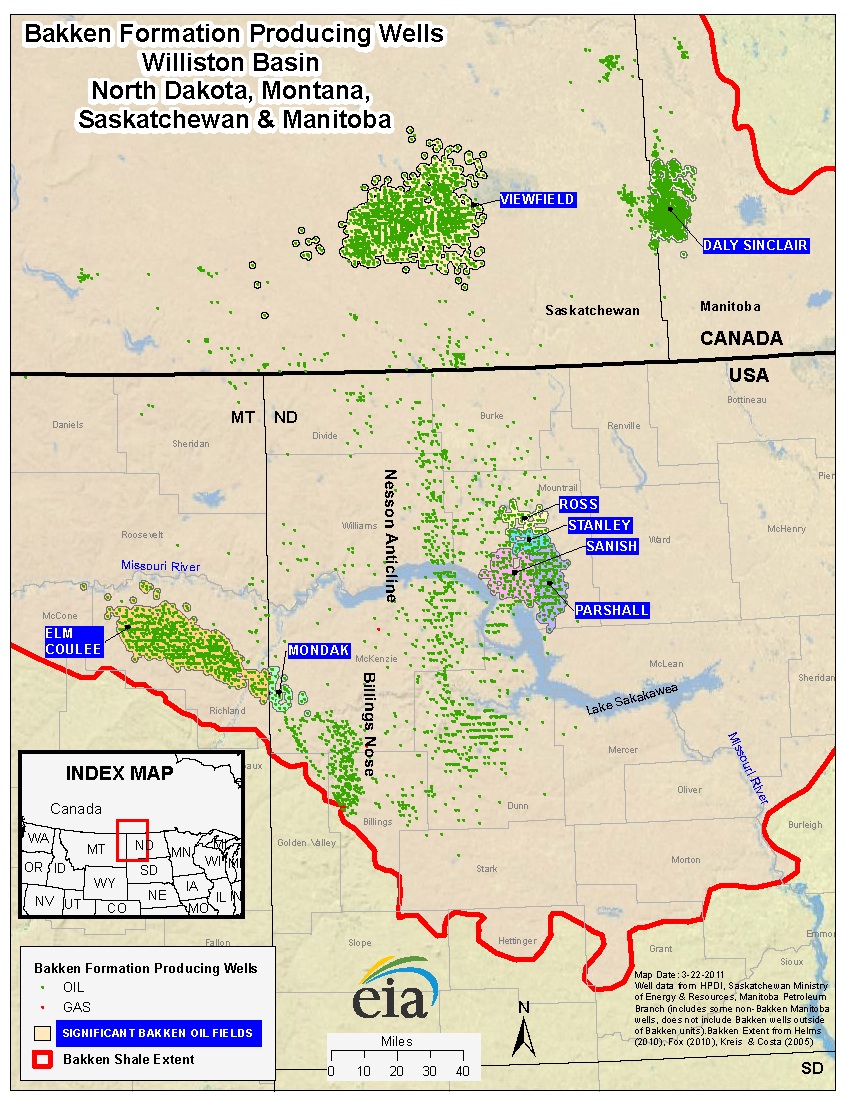
Figure 02: The map above from EIA (Energy Information Administration) shows the extent of the Bakken formation, areas with considerable activity and oil and natural gas wells. The most active areas are also the most productive ones (sweetest spots) and data now shows that these are well developed (saturated).
As of July 2012, data from the North Dakota Industrial Commission documented extraction (production) from 4 319 wells in the Bakken formation (which includes Bakken, Sanish, Three Forks and Bakken/Three Forks basins). Total reported production in July 2012 was around 610 000 Bbls/day with a specific average of 141 Bbls/day/well.
The production of shale oil/tight oil (which is not to be confused with oil shale; kerogen) is proclaimed by many to constitute a “revolution” and/or “game changer” for the global supplies of crude oil. Shale oil has unquestionably added valuable supplies during a period of tight global crude oil supplies.
SCOPE OF THE STUDY
The scope of the study incorporated companies/areas that had a specific average production (Bbls/day/well) above the average for the Bakken formation, see also figure 06. Further the study concentrated on newer wells where there were reported starts of production as from January 2010 and later. This was also to make sure that effects from those newer wells with “state of the art” technologies (technological innovations/improvements like horizontal wells also with laterals, multistaged hydraulic fracking, to name a few) were incorporated. This was done to document recent trends. Normally it takes somewhere between 5 to 6 months from start of drilling of a well until it starts flowing. Then add time for planning and approvals.
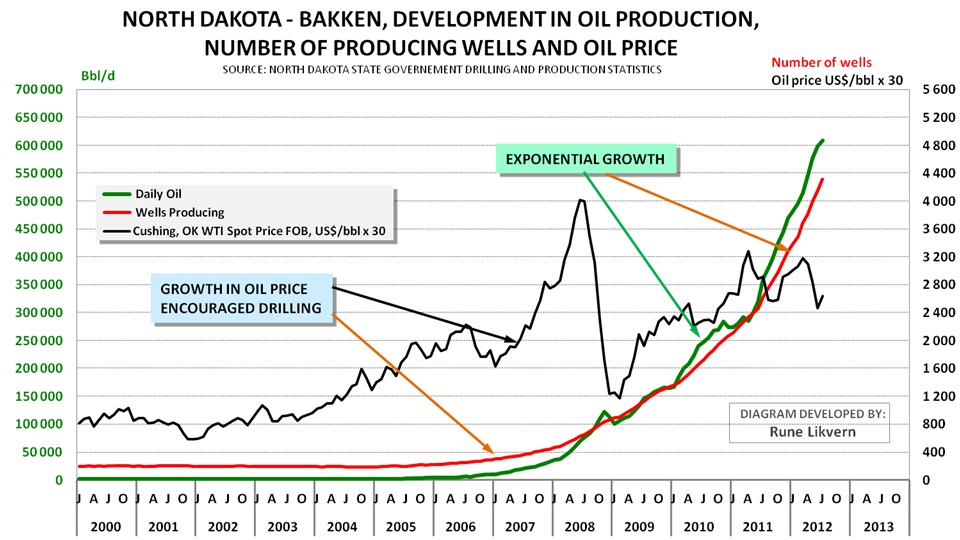
Figure 03: The chart above shows the development in the number of reported producing wells, oil production and the crude oil price (NOTE; to enable the inclusion of the oil price in the chart the actual price has been multiplied by 30. In other words actual prices are found by dividing the value in the chart by 30.). The chart shows that the growth in oil prices has been the dominant driver for acceleration of drilling and the resulting growth in oil production from the Bakken formation in North Dakota.
Figure 03 could also create the illusion that growth in shale oil production from the Bakken is still continuing at a rapid pace.However if the time series of actual production data are studied in further detail and are presented in an appropriate manner it becomes easier to document and spot the true underlying trend. From figure 03 it may also be seen that the collapse of the oil price during the fall of 2008 led to a slowdown of activities and lower total production. As illustrated in figure 03 it was primarily the growth in the oil price together with technological innovations in recent years that caused production of shale oil to make economic sense.
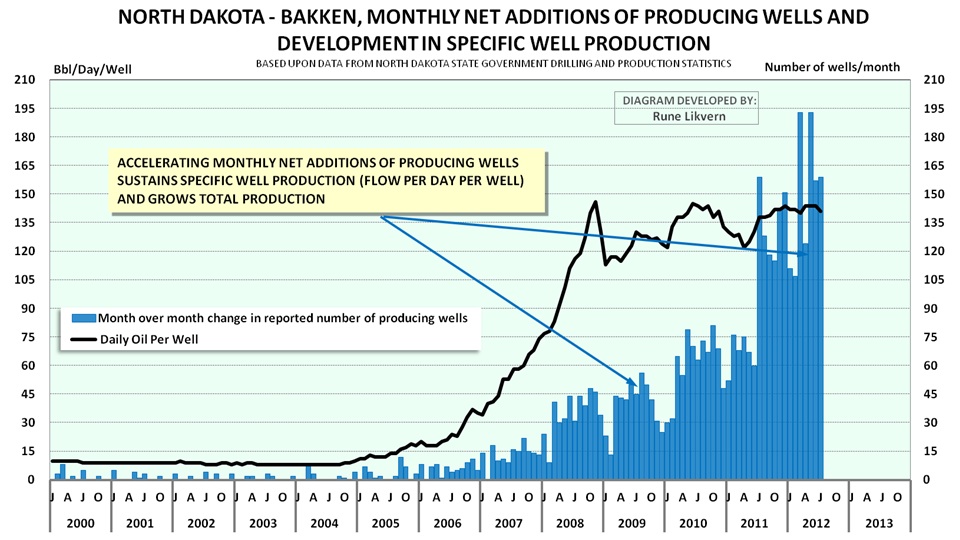
Figure 04: The chart above shows the development in the reported net total monthly start up of wells (blue columns) and the development in the specific productivity (Bbls/day/well; black line) for the Bakken formation from January 2001 and as of July 2012.
Figure 04 shows that the specific average production (Bbls/day/well) had strong growth as from 2006 to 2008 and has since been sustained at around 140 Bbls/day/well. Start up of new wells shows an accelerating trend as from 2006. It is this accelerating start up of new wells that have resulted in growth in total production. Extraction/production of oil and gas from shale formations has its own distinct physics governed by geology and comprised of steep decline rates and challenging dynamics that define the rules to create overall growth, sustain a plateau and/or declines.
There are also considerable variations in the productivity between plays within the same play and normally the areas with the best production potential (sweetest spots) become developed first (harvesting the lowest hanging fruit first etc.). The development of shale plays thus follows exactly the same pattern as developments of other petroleum basins.
THE WELLS, AREAS AND COMPANIES COVERED BY THE STUDY
What follows is a presentation of some selected wells from the study and the wells from the areas/companies covered by the study.
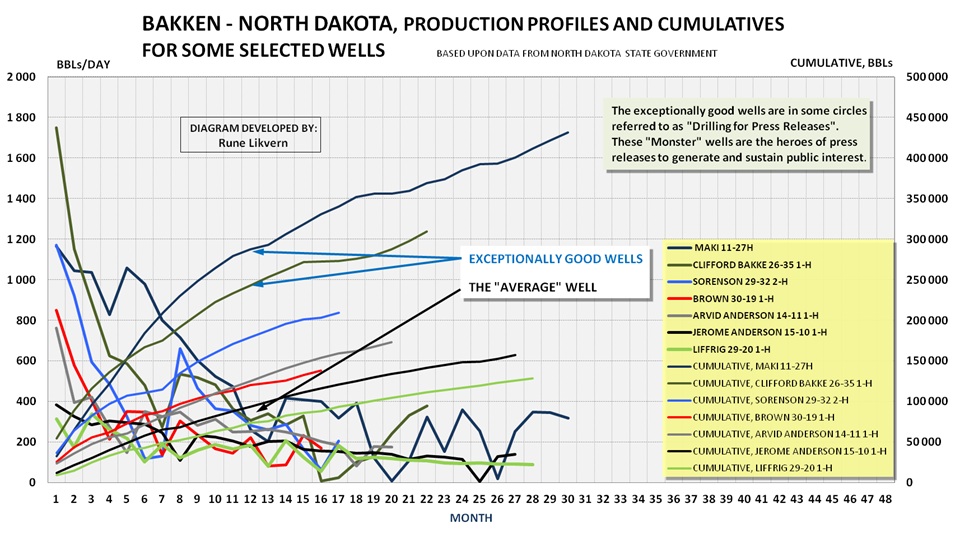
Figure 05: The chart above show the development in reported average daily production versus number of months in production for some selected wells (well identifications in the legend box) (left y-axis). Incorporated in the chart is the development of total production versus number of months in production (right y-axis).
The chart above illustrates that there is a huge spread in well productivity, cumulative and decline rates amongst individual wells. The well Sorenson 29-32 2-H (blue line) got attention from, amongst others, the Oil&Gas Financial Journal back in April 2011. Normally it is the exceptionally good wells that get the attention of media and its readers.
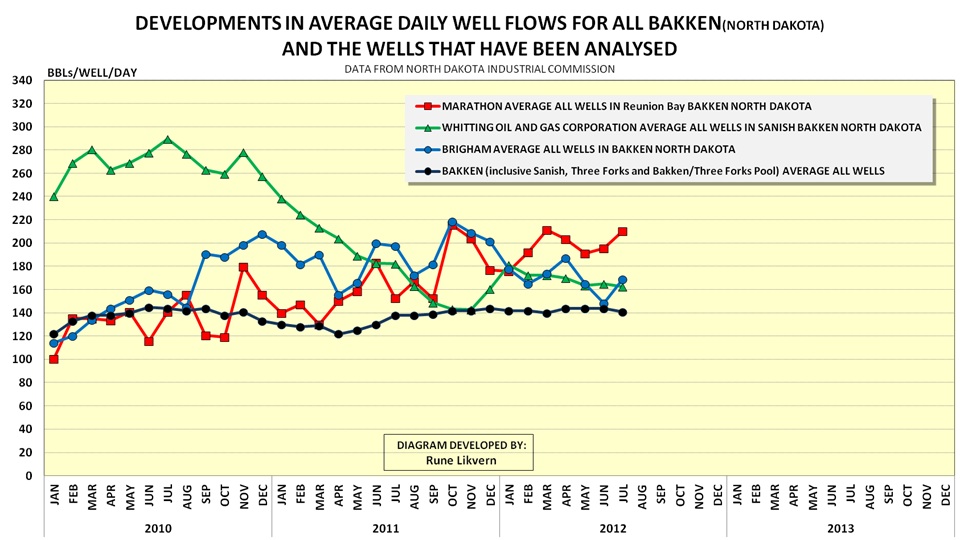
Figure 06: The chart above shows the development in specific average productivity (Bbls/day/well) for all Bakken in North Dakota (black circles connected by black line), Whitting Oil and Gas Corporation’s wells in Sanish (green triangles connected by green line), all of Brigham’s wells (blue circles connected by blue line) and Marathon’s wells in Reunion Bay (red squares connected by red line) from January 2010 and as of July 2012.
Figure 06 documents that the wells from the areas/companies that were subject to the in depth time series studies had productivity that was above the average for all reported wells in the Bakken play in North Dakota. Notice also the pronounced decline of more than 40% over 2 years in the average well productivity for the wells in Sanish.
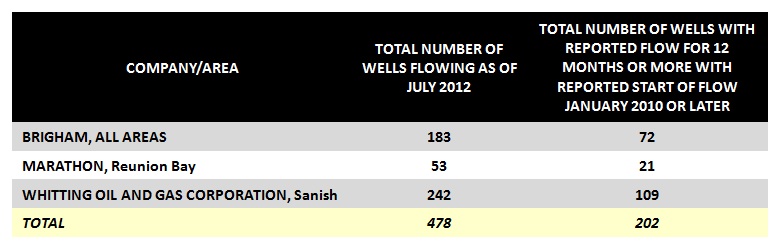
Table1: The table above lists the number of wells that were subject to the in depth time series studies, and what companies/areas these were reported.
The in-depth time series study was comprised of 478 wells (around 11%) of the 4 319 wells reporting production from the Bakken. These wells represent around 13% of the total production as of July 2012. The wells with reported start of production as of January 2010 and later and that had reported production for 12 months or more were subject to additional analysis which includes the wells with reported start of flow as of August 2011. In the period January 2010 and through August 2011 there was reported start of flow from a net addition of 1 417 wells of which 202 (or more than 14%) were subject to extensive statistical analysis. The statistical analysis formed the basis to define what is presently considered a pro forma well (or “average” well) for Bakken. The “average” (pro forma) well should not be expected to be static as it will continually change with time and presently the trend is one of declining productivity.
For this “average” (pro forma) well an economic analysis was performed which is presented further down.
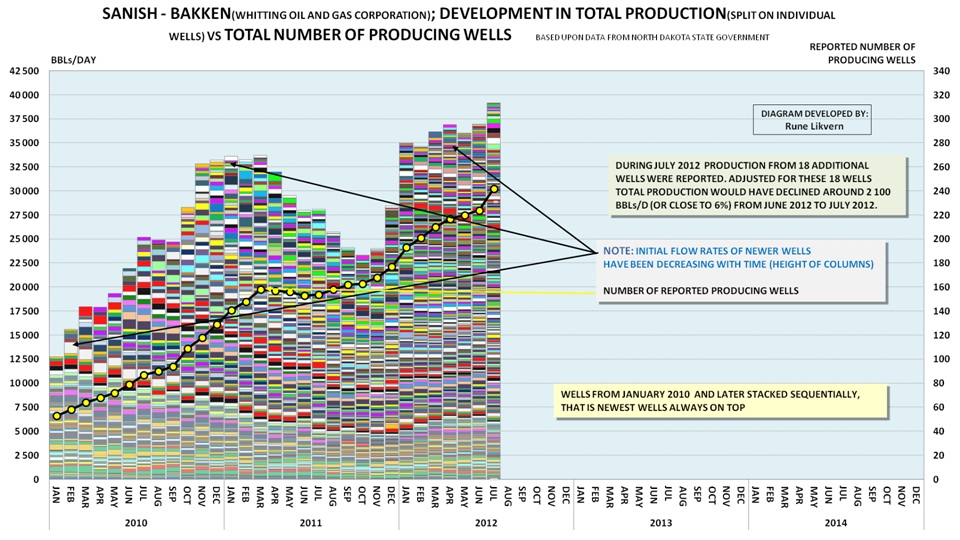
Figure 07: The chart above shows the monthly total number of wells, month of start up of reported production from added wells, production from the individual wells and total production from the 242 wells reported for Whitting Oil and Gas Corporation in Sanish – Bakken as of July 2012. The chart spans the period January 2010 through July 2012. The wells in the chart are stacked sequentially according to reported start up of production that is newest wells always on top.
Figure 07 is a suitable illustration of what is to be expected in developments of shale formations (or areas within shale formations) for both oil and natural gas. From the figure it should also be possible to perceive the development of well productivity with time.
- The wells normally have a high production at start up that rapidly enters into steep declines.
- To facilitate growth in total production an accelerating number of wells needs to be brought into production.
- To sustain a plateau requires a continual addition of a high number of producing wells.
- Note in figure 07 how total production declined between March 2011 and as of October 2011 while the reported number of total wells with production saw little change.
- Figure 07 also shows how well productivity (note the arrows and height of columns) has shown a general decline for newer wells.
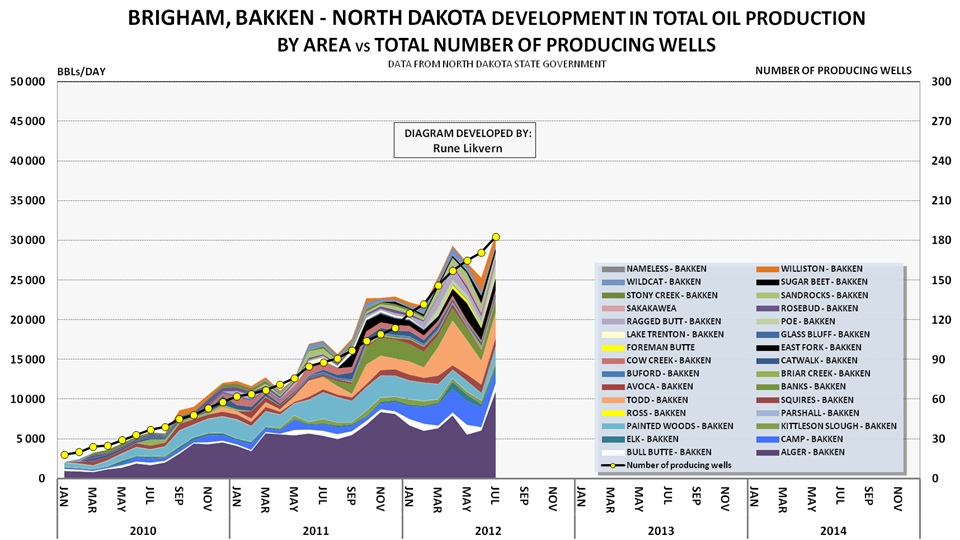
Figure 08: The chart above shows the development in reported total production by area for all the wells for Statoil/Brigham in the Bakken formation, North Dakota. The chart also shows the development of total number of wells. The chart spans January 2010 through July 2012.
The chart in figure 08 also illustrates how an accelerating number of additional producing wells are needed to create growth in total production. Brigham was acquired by Statoil December 1st 2011 for a price of US$4.4 Billion.
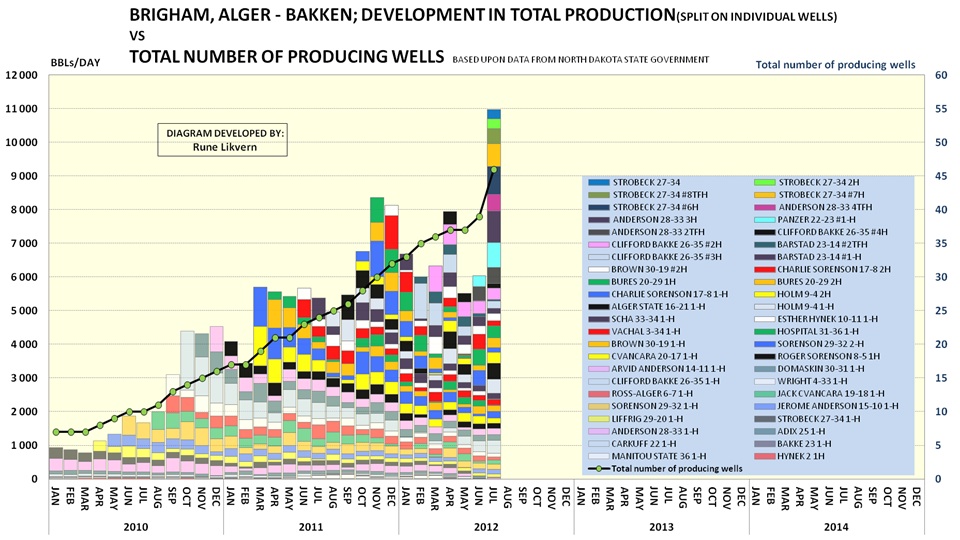
Figure 09: The chart above shows development in total production by individual wells (ref the legend) and total number of reported wells with production for all Statoil/Brigham wells in the Alger area of Bakken.
The wells in the chart are stacked sequentially according to reported start up of production, that is newest wells always on top. The chart may also serve as an illustration to what in some circles presently is referred to as “the Red Queen” effect. It is not a given that total production will grow by adding new producing wells.
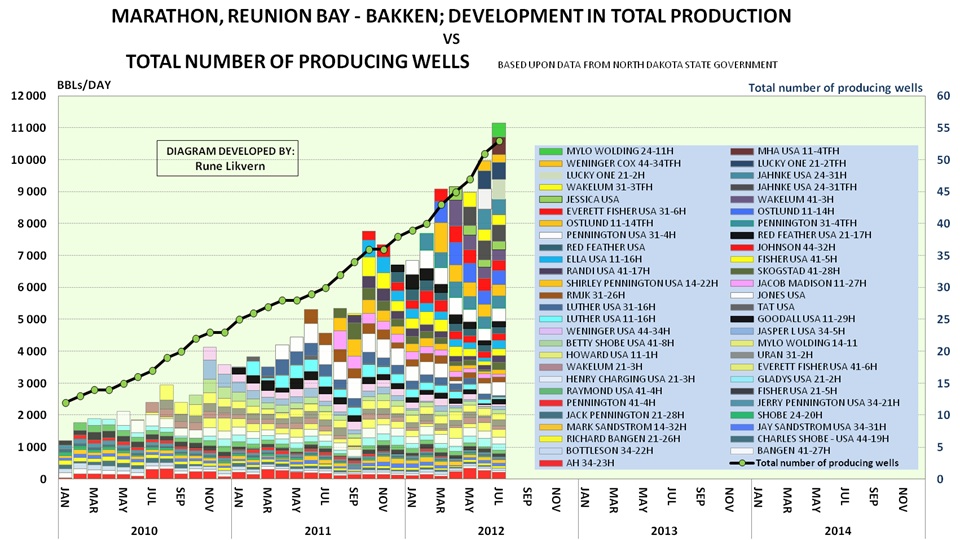
Figure 10: The chart above shows development in total production by individual wells (ref the legend) and total number of reported wells with production for all Marathon wells in the Reunion Bay area of Bakken.
The wells in the chart are stacked sequentially according to reported start up of production, that is newest wells always on top.
The chart above also illustrates that growth in total production requires accelerating additions of producing wells. The Marathon wells in the area above have recently seen some improvements in well productivity.
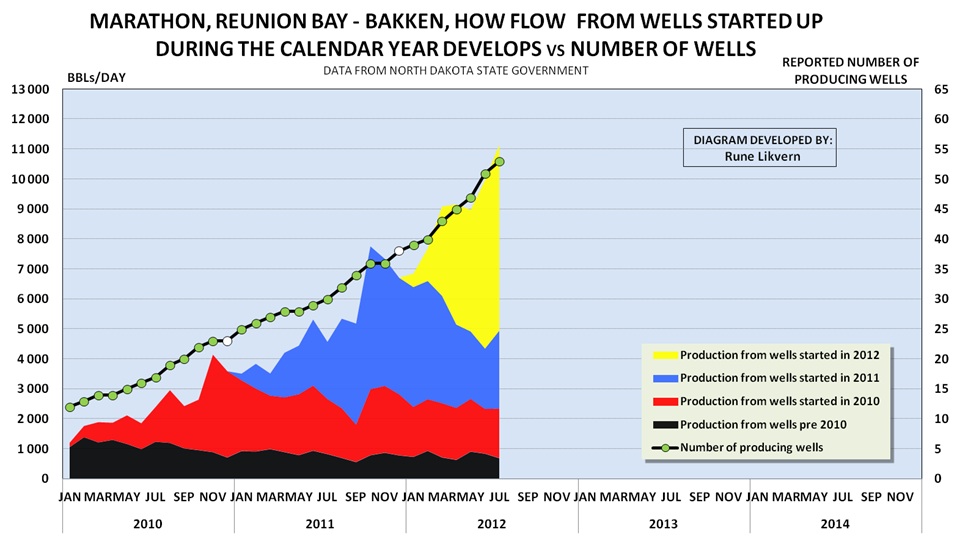
Figure 11: The chart shows development in total production from wells started within specified calendar years for Marathon’s wells in Reunion Bay – Bakken.
The purpose of including the chart above was to give a better feel of annual production declines from wells within an area.
THE STATISTICAL ANALYSIS
What follows are the results from the statistical analysis of the wells that were subject to the in depth time series analysis. If the trend described by the statistical analysis persists and the wells analyzed are representative for Bakken it should be expected that total production from the Bakken formation is about to experience what in some circles is referred to as “the Red Queen” effect.
In plain language this means that a high number of new wells needs to be brought to production to sustain total production.
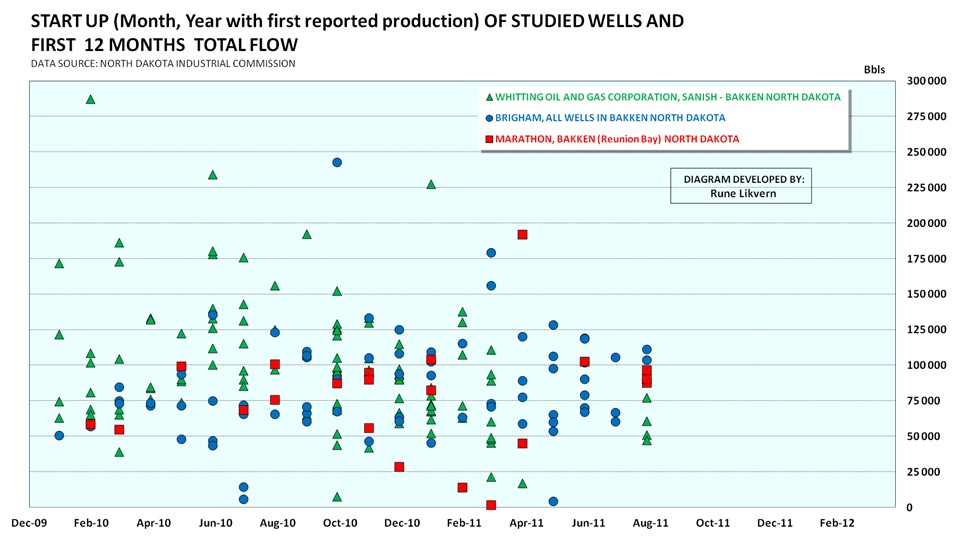
Figure 12: The scatter chart above may appear complex for those who are not familiar with this kind of chart. Based upon data from the North Dakota Industrial Commission it shows total reported produced crude oil for the 12 first months (y-axis) versus reported start of first production (x-axis). Wells that were started as of August 2011 or later had as of July 2012 not attained 12 months with reported production. This is the reason why there presently are no data points in the chart after August 2011.
The figure shows that there is a huge spread in the total production for the first 12 months amongst the wells. It may be challenging to perceive any trends for well productivity with time from the scatter chart, but as of now it appears as the spread in productivity has narrowed with time.
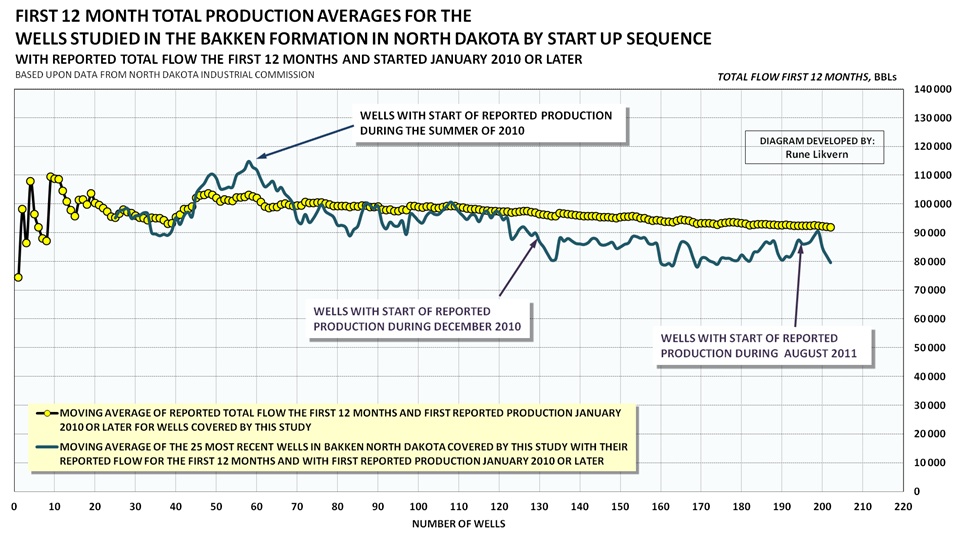
Figure 13: If the data on total reported production for the first 12 months on all the wells that were subject to in depth time series studies are organized sequentially according to when production were started and a moving average is used, the picture above emerges. The moving average is the total first 12 months production divided by total number of wells (yellow circles connected by black line). Described another way the first data points are for wells with reported production from January 2010 and the last data points in the chart are for wells with first reported production as of August 2011. This function is slow. To both speed up the function and improve visualizations a 25 moving average was added. The 25 moving average shows the average of the 25 most recent wells (aquamarine line, 25 moving average was chosen as a compromise to smooth out wild swings and achieve an acceptable speed).
Figure 13 shows a worrying development for newer wells in the Bakken formation. Productivity as expressed by total first 12 month production has shown steep declines for newer wells. The productivity was growing until the summer of 2010 where it reached a high. Since the summer of 2010 to the summer of 2011 average first year productivity for newer wells in Bakken declined around 25%!
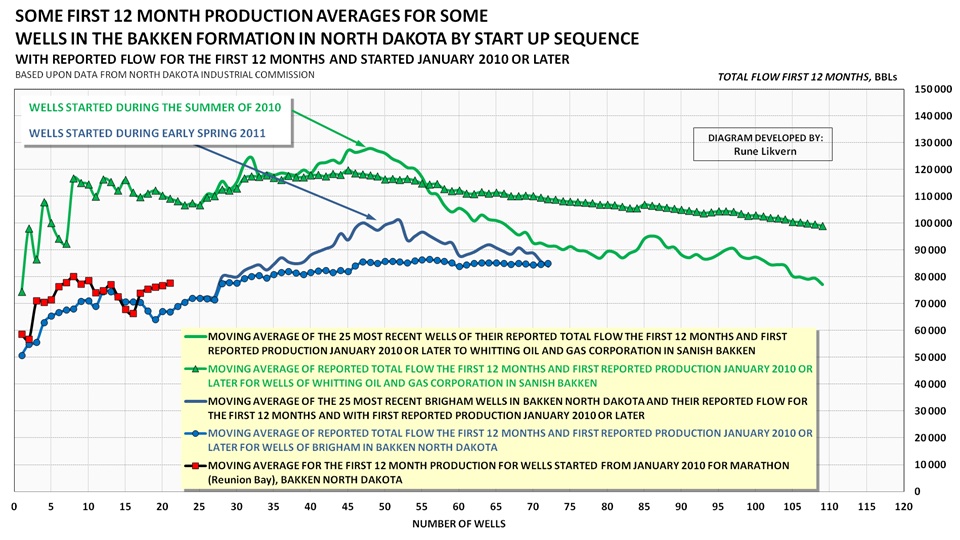
Figure 14: In the chart above the same methodology as used for figure 13 is shown for the companies/areas covered by this study. The green triangles connected by green line are the moving average for Whitting Oil and Gas Corporation’s wells in Sanish. The green line shows the 25 moving average. The blue circles connected with a blue line are for the wells of Statoil/Brigham. The dark blue line is the 25 moving average. The red squares connected by a black line are for Marathon’s wells in Reunion Bay.
On a long enough timeline, the highs in well productivities for the Sanish area and Statoil/Brigham will melt into a point. To repeat, the wells for the companies/areas subject to these in-depth studies had all a specific well productivity (as expressed by Bbls/day/well) that was above the average for the Bakken formation, see also figure 06. The Sanish area in the Bakken formation is/was considered being one of the best and during a year (from the summer of 2010 to the summer of 2011) the well productivity (as described by total reported production during the 12 first months) declined about 40%. For Statoil/Brigham the well productivity declined about 10% in one year.
Do the above create associations to the law of diminishing returns?
THE ECONOMICS FOR THE PRESENT PRO FORMA (“AVERAGE”) WELL IN BAKKEN
What follows is a little about the economics for what the analyzed data presently describes as the pro forma (“average”) well in the Bakken formation.
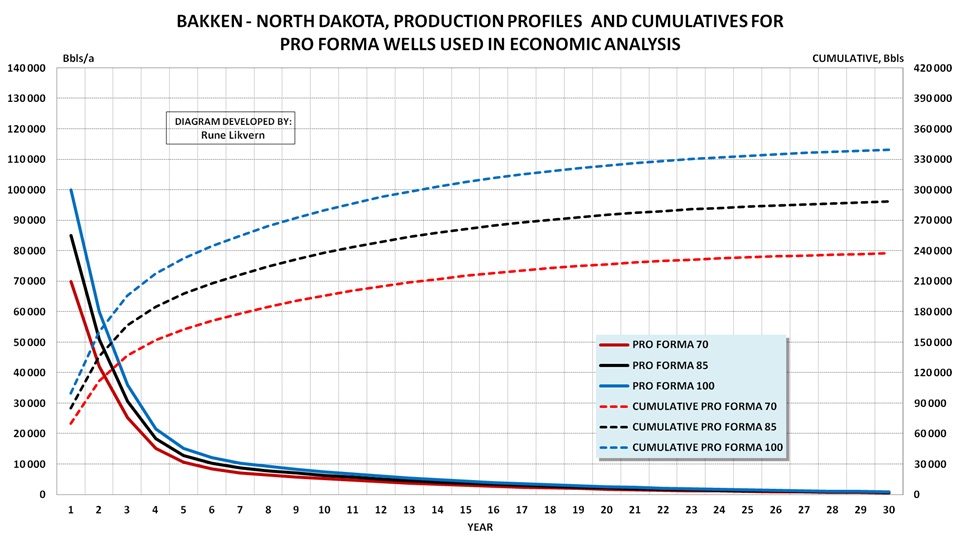
Figure 15: Based upon the data from the wells that were subject to in depth time series studies a pro forma well (an “average” well) was established. The future development for this was forecast by using data from the North Dakota state government and what is presently available of forecasts from several reputable sources with regard to declines, total recovery or EUR (EUR, Estimated Ultimate Recovery) for wells producing oil from shale. From this study it was found that the pro forma (“average”) well yielded around 85 000 barrels with crude oil during the first 12 months of production.
The chart shows production profiles for pro forma (“average”) wells with respectively 70 000 (red lines), 85 000 (black lines) and 100 000 Bbls (blue lines) for the first operational year, and how these are forecast to develop with time.
Presently the data documents that the production trend for the “average” well is in slight decline.
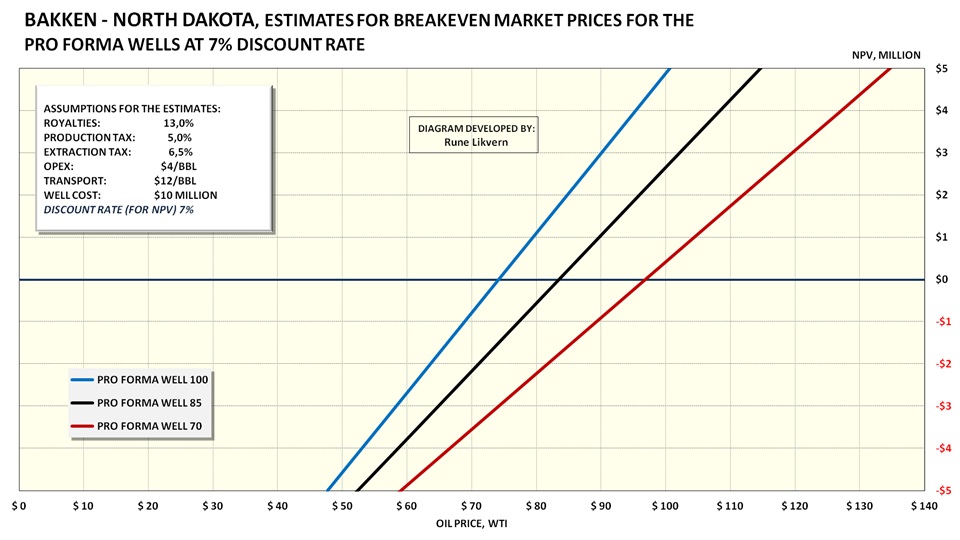
Figure 16: The pro forma (“average”) wells shown in figure 15 were subject to economic analysis. The assumptions used for the economic evaluations are shown in the box within the chart. (PRO FORMA WELL 100 = well with a total of 100 000 Bbls produced during the first year, etc.). The well costs include preparations of the well site (inclusive access), horizontal drilling, completion, multistage hydraulic fracking and hook up for processing, storage and transport. The well cost does NOT include full life cycle costs, financial costs, costs for mineral rights (acreage costs) and effects from potential changes to statutory regulations.
NOTE: The “average” well also produces 0.5 – 1.0 Mcf/Bbl with associated natural gas. The natural gas may be flared or sold if there is available infrastructure. Presently the natural gas price in USA (Henry Hub) is around $3/Mcf. In other words the potential contribution from natural gas is marginal and well within the uncertainties for the estimates.
The profitability analysis shows that the “average” well for Bakken now requires $80 – $90/Bbl to make commercial sense. A requirement for a higher rate of return (than the 7% used here, which is moderate) will raise the commercial threshold. If the trend with declining well productivity persists (all other things remaining equal) the threshold for profitability will move higher. During the planning of drilling campaigns several assumptions are made with regard to well productivity (performance), oil price, financing and an associated package of risk assessments. If these evaluations show high uncertainties (as in high risk) and a potential for no or at best uncertain profitability, the wells under consideration are most likely to not be drilled. The exception will be wells that the licensee is contractually obligated to drill within a specified deadline to maintain the rights for mineral extraction, so-called “drill it or lose it!”
Normally before wells within shale areas are put into production, it is close to impossible to issue any guarantees that it will make commercial sense. After six months or more of production, data will be available that may support the profitability expectations. For a well in a conventional reservoir information about whether it is worth completing will be available at the end of drilling. For wells in shale plays (both oil and natural gas) the companies (operators) commit themselves to produce these long before they know if the wells make commercial sense. If production from a completed well after some time shows that it will underperform (that is yield less than expected) then the oil company/operator will continue production from it as long it generates a positive cash flow. As with regard to total well costs given by oil companies/operators there are presently some spread in these. These spreads should be considered to be real and rooted in geological particulars like depth to and thickness of the organic zones, applied technologies, laterals, number of hydraulic fracking stages, topography, costs for hook up for processing, storage and transport to name a few.
Production of crude oil and natural gas from shale is also a lot about growing shareholder value. As long as shareholders do not suffer any losses it does not matter if production from shales makes little or no commercial sense. These dynamics led to the boom in drilling for shale gas. The recent collapse of natural gas prices in North America has resulted in huge balance sheet impairments for several oil and gas companies.
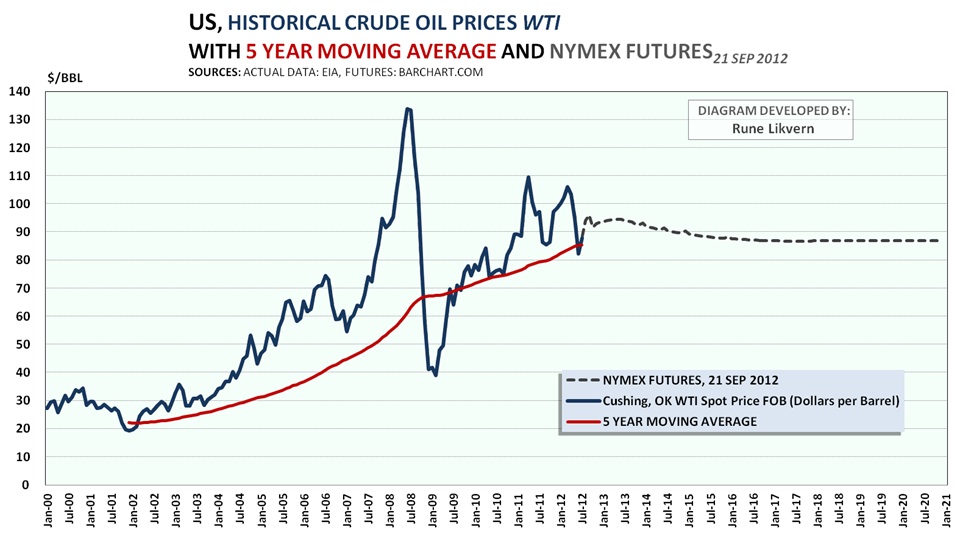
Figure 17: The chart above shows the development in the oil price, WTI, as from January 2000 and now. Further the NYMEX futures (WTI) as of 21 September 2012 through December 2020 have been added. FWIIW the 5 year moving average of the actual WTI has been added (red line).
In reality, it was the growth in the oil price to an apparent structurally higher level that secured commercial support for crude oil production from shales. In that respect it was the oil price that was the true game changer and unleashed the “shale/tight oil revolution”. There is a saying that goes like; “Do not listen to what they say. Look at what they are doing!”. This may as well go for the Bakken formation.
The oil service giant Baker Hughes recently expressed concerns about slowing activity levels in shale plays if oil prices moved below $80/Bbl. Further the oil companies Marathon and Occidental recently cut back on their activities in the Bakken formation. Oil and gas companies still care about the colors of the numbers at the bottom line for their projects.
Indicators to follow that may be a harbinger of emerging developments in activity levels in shale plays:
- Number of drilling rigs, uncertain as there has been improvements to drilling.
- Net added number of wells with reported start of production.
- Changes to total reported production.
SOME RECENT REPORTS
U.S. Geological Survey (USGS) recently published (recently as in a few days ago) the report: “Variability of Distributions of Well-Scale Estimated Ultimate Recovery for Continuous (Unconventional) Oil and Gas Resources in the United States”. USGS has revised their estimates for many U.S. shale plays (oil and natural gas) and their recent estimates ought to have a sobering effect.
For production (extraction) of shale oil in the Eagle Ford formation in Texas the study:”Eagle Ford Shale – An Early Look at Ultimate Recovery” (SPE 158207; SPE, Society for Petroleum Engineers) documented a trend of declining well productivity.
ROCKMAN is an experienced geologist and as close you get to an inexorable fountainhead for oil and gas field experiences on The Oil Drum.
ROCKMAN applied the same methodology as I did for Bakken on data from Texas Rail Road Commission (TRCC) for shale/tight oil in Eagle Ford and documented the same trend.
…………………………………………………………………………………………………………………………………………
Does the U.S. Really Have More Oil than Saudi Arabia?
The Difference Between Oil Shale and Oil-Bearing Shale
People are often confused about the overall extent of U.S. oil reserves. Some claim that the U.S. has hundreds of billions or even trillions of barrels of oil waiting to be produced if bureaucrats will simply stop blocking development. In fact, in a recent debate between Republican candidates contending for Gabrielle Giffords’ recently vacated House seat, one candidate declared “We have more oil in this country than in Saudi Arabia.” So, I thought it might be a good idea to elaborate a bit on U.S. oil resources.
Oil production has been increasing in the U.S. for the past few years, primarily driven by expanding production from the Bakken Shale Formation in North Dakota and the Eagle Ford Shale in Texas. The oil that is being produced from these shale formations is sometimes improperly referred to as shale oil. But when some people speak of hundreds of billions or trillions of barrels of U.S. oil, they are most likely talking about the oil shale in the Green River Formation in Colorado, Utah, and Wyoming. Since the shale in North Dakota and Texas is producing oil, some have assumed that the Green River Formation and its roughly 2 trillion barrels of oil resources will be developed next because they think it is a similar type of resource. But it is not.
Although the oil in the Bakken and Eagle Ford is being extracted from shale formations, the term shale oil has been used for over 100 years to describe a very different resource. This has led some to confusion over the differences between current production in North Dakota and potential production in Colorado. The oil in the Bakken and Eagle Ford formations actually exists as oil, but the shale does not allow the oil to flow very well. This oil is properly called “tight oil“, and advances in hydraulic fracturing (fracking) technology have allowed some of this oil to be economically produced. (For more details, I discuss resources, reserves, fracking, shale gas, and oil shale in some detail in my new book Power Plays: Energy Options in the Age of Peak Oil).
The estimated amount of oil in place (the resource) varies widely, with some suggesting that there could be 400 billion barrels of oil in the Bakken. Because of advances in fracking technology, some of the resource has now been classified as reserves (the amount that can be technically and economically produced). However, the reserve is a very low fraction of the resource at 2 to 4 billion barrels (although some industry estimates put the recoverable amount as high as 20 billion barrels or so). For reference, the U.S. consumes a billion barrels of oil in about 52 days, and the world consumes a billion barrels in about 11 days.
Like the Bakken, the Eagle Ford formation in Texas consists of oil (and natural gas) in tight formations that is being accessed via fracking. The amount of technically recoverable oil in the Eagle Ford is estimated by the U.S. Department of Energy to be 3.35 billion barrels of oil.
Without a doubt, these two formations are a major factor in the current resurgence of U.S. oil production. But the Green River formation is the source of talk of those enormous oil resources — larger than those of Saudi Arabia — and it is a very different prospect than the tight oil being produced in North Dakota and Texas. The oil shale in the Green River looks like rock. Unlike the hydrocarbons in the tight oil formations, the oil shale (kerogen) consists of very heavy hydrocarbons that are solid. In that way, oil shale more resembles coal than oil. Oil shale is essentially oil that Mother Nature did not finish cooking, and thus to convert it into oil, heat has to be added. The energy requirements — plus the fact that oil shale production requires a lot of water in a very dry environment — have kept oil shale commercialization out of reach for over 100 years.
Thus, while the U.S. might indeed have greater oil resources than Saudi Arabia, U.S. oil reserves (per the BP Statistical Review of World Energy) are only about 1/10th those of Saudi Arabia. The distinction is important.
Summarizing the Definitions
To summarize, let’s review the definitions for the important terms discussed here:
Oil resource — the total amount of oil in place, most of which typically can’t be recovered
Oil reserve — the amount of oil that can be recovered economically with existing technology
Oil shale — sedimentary rock that contains solid hydrocarbons called kerogen (e.g., Green River Formation)
Shale oil — the oil that can be obtained by cooking kerogen
Tight oil — liquid hydrocarbons that are obtained by hydraulic fracturing of shale formations (e.g., Bakken Formation and Eagle Ford Formation)
Conclusion: Resources are not Reserves, and Tight Oil isn’t Shale Oil
It is pretty clear that at current oil prices, developments in the tight oil formations will continue. It is not at all clear that even at $100 oil the shale in the Green River formation will be commercialized to produce oil, although a number of companies are working on it and will continue to do so. Oil shale is commercially produced in some countries like Estonia, but it is primarily just burned for power.
In order to commercially convert the oil shale into oil, a more energy efficient method of producing it must be found (or, one would have to have extremely cheap energy and abundant water supplies to drive the process). I have heard from multiple industry sources that the energy return for producing oil from oil shale is around 4 to 1 (lower than for oil sands production), and that is before refining the oil to finished products. At this sort of energy return, oil sands will continue to be a more economical heavy oil option.
Thus, my prediction is that despite having an oil shale resource that may indeed be far greater than the oil resources of Saudi Arabia (I don’t think I have seen an estimate of Saudi’s total oil resources), the reserve will continue to be close to zero for the foreseeable future because there are still many technical hurdles to overcome to realize a scalable, commercially viable process.
Finally, I would say that if a commercially viable process for shale oil production from the Green River formation is developed, the environmental blow-back will be enormous. The production of shale oil is more energy intensive (i.e., has higher carbon emissions) than for the oil sands, it has a high water requirement in a dry climate, and it is potentially a huge new source of carbon dioxide emissions. The environmental protests that would arise in response to a growing commercial shale oil operation would make the Keystone XL pipeline protests pale in comparison.
…………………………………………………………………………………………………………………………………………
- Click on any picture or chart to enlarge it
All Rights Reserved © ™
Explore posts in the same categories: IN DEPTH
Leave A Reply