02/12/13 – Where Are We Going?

MARKET MESSAGES
2/12/13
DAMN . . . POLITICS AGAIN!
We have a sequestration time bomb set to go off on March 1. It would be nice if the political parties play nice together, but it wouldn’t be surprising to see the time bomb detonate before a compromise takes place. This is exactly what happened with the January 1 deadline and a repeat of that scenario is certainly likely.
If the republicans feel they have more to lose than the democrats, a compromise might take place before the deadline. But it “appears” that the President is going to play hard-ball on spending cuts versus taxes. The reality is likely to be an agreement that both sides dislike and that’s called a compromise. A compromise was the ignition point in December 2012 and it would be nice to see a repeat of that. Seldom does the stock market have a duplicate response to a duplicate situation.
BUT . . . Duplicate situations and duplicate responses are illustrated by the Gulf War in 1991 and the Iraq invasion in 2003. War was quickly followed each time by a strong rally.
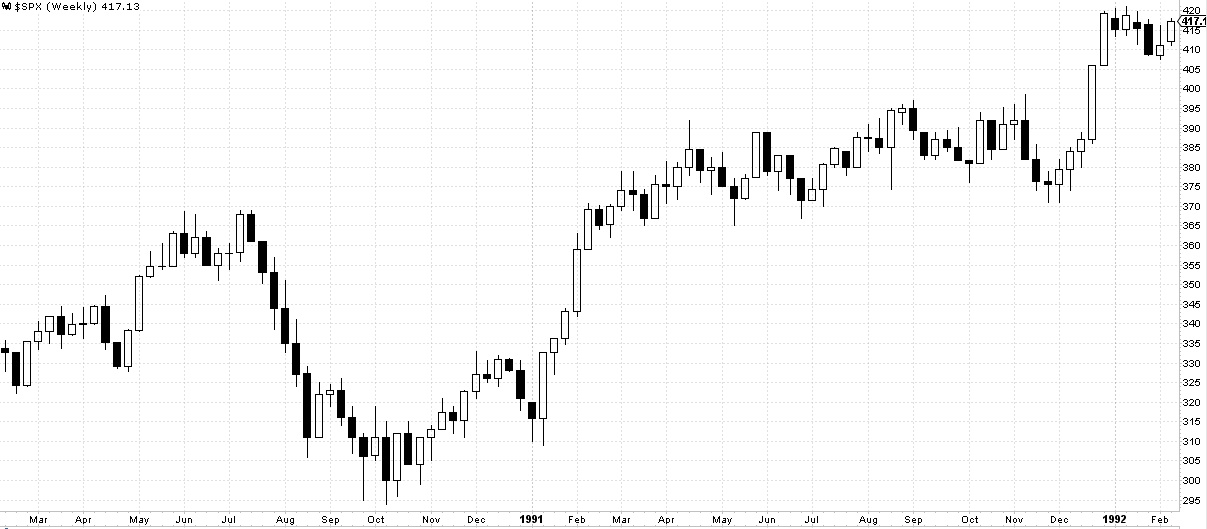
Gulf War – 8/2/1990 to 2/28/1991
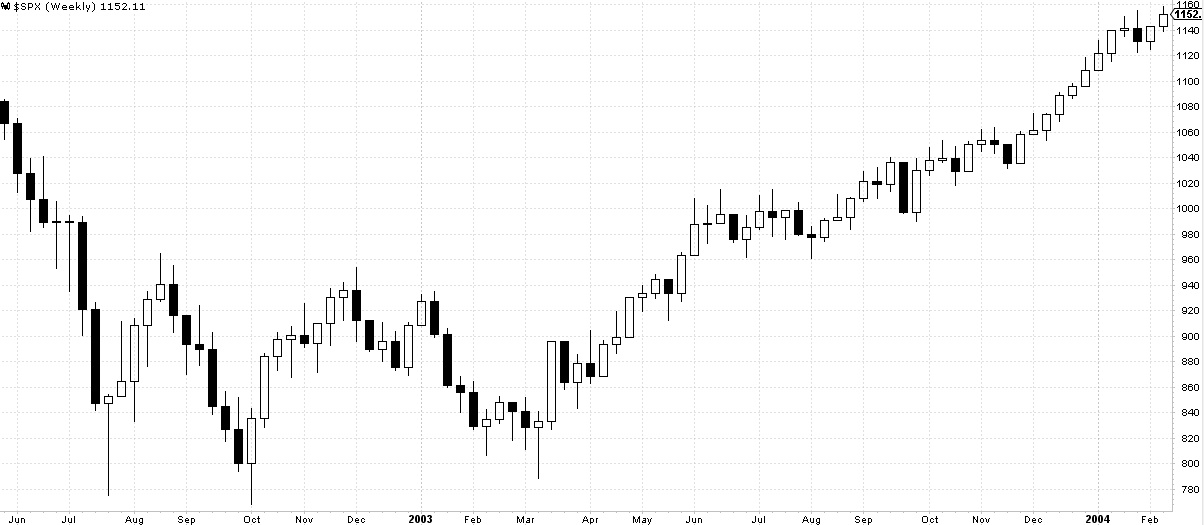
Iraq Invasion – 3/20/2003
Would a compromise on the sequestration cuts ignite the market again just like it did in December?
Joseph Granville said: “If it’s obvious, it’s obviously wrong.”
The wildcard against an obvious situation is that the two political parties don’t have to compromise and that removes the obvious. It’s possible that we could be stuck with the sequestration cuts, but Congress can’t be that stupid (???). It’s widely viewed that we have a dysfunctional Congress and a compromise is a step towards solving urgent problems that face the USA. Doing nothing has been the path that Congress has followed in the past and investors are looking forward to solving problems instead of letting them slide. Eventually time will run out on any solution and that could create significant problems for the dollar and Treasury debt.
It’s possible that red 3 could begin with a sequestration compromise, but it’s best to not try and connect news with the stock market. Sometimes it works and other times not.
BLOG QUESTION
I received the following question at my blog.
Hi Bob,
Hope all is well. What are your thoughts on this article?
http://www.marketoracle.co.uk/Article38931.html
Michael
The writer at the marketoracle does have some interesting points, several have already been addressed in my blog. It’s kinda funny how he disses Elliott Wave and then proceeds to illustrate the future with Elliott wave counts. I guess he only dislikes it some of the time. That’s kinda the way I feel about it. Sometimes it’s OK and the rest of the time, it’s crap. One thing we have in common is that the overall wave counts are similar (I count 3 while they count 5). My method is much more simplistic.
The writer of marketoracle cites the following in his statement regarding Elliot Wave Theory:
“Therefore despite EWT being a useful tool, I am ALWAYS on guard against being seduced by EWT as it is extremely easy to back fit onto what has already happened to imply something highly probable is about to take place when the complete opposite may be true. So yes, whilst it’s implications can get the adrenaline pumping and one eager to hit the TRADE button! I do have to take deep breaths and remember that there are NO short cuts! NO matter how enticing it appears, on its own EWT in the long-run WILL NOT be more accurate than COIN TOSS !
So, always keep in your mind that the EWT component Equates to a Coin Toss Over the Long-run and you won’t become seduced and end up missing whole bull markets as MANY so called MASTER ELLIOTTITIONS have proceed to do! Because they believe their own hype, much as Gannophiles have been seduced by the master price time squares that is yet again another example of coin flip analysis elevated to ‘holy grail’ high priesthood status so as to perpetuate myths along the same lines that religious myths of so called revelations are perpetuated to fit in hindsight any subsequent event! When in reality EWT’s true purpose should be to skew ones perception of the price action thus enabling an unbiased and always skeptical analysts to interpret price action from another perspective as part of a broader whole, even this will not guarantee success because analysis and trading boils down to probabilities and NOT certainties of outcome”
The author’s interpretation of the current Elliot wave count is similar to mine.
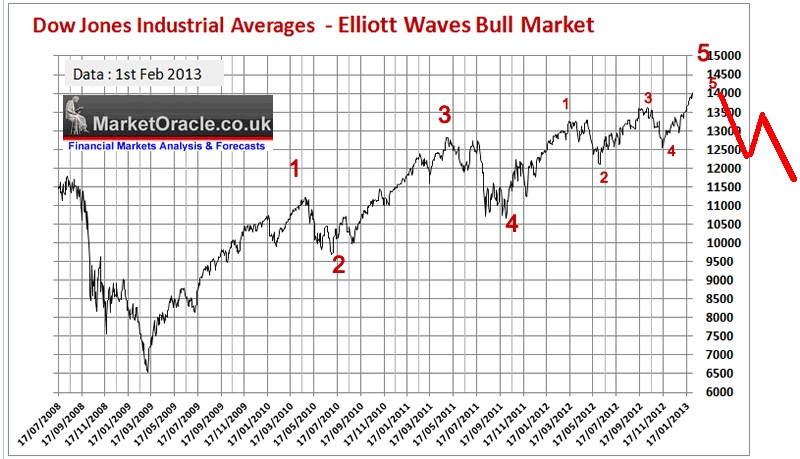
02-12-13 elliott-waves-bull-market
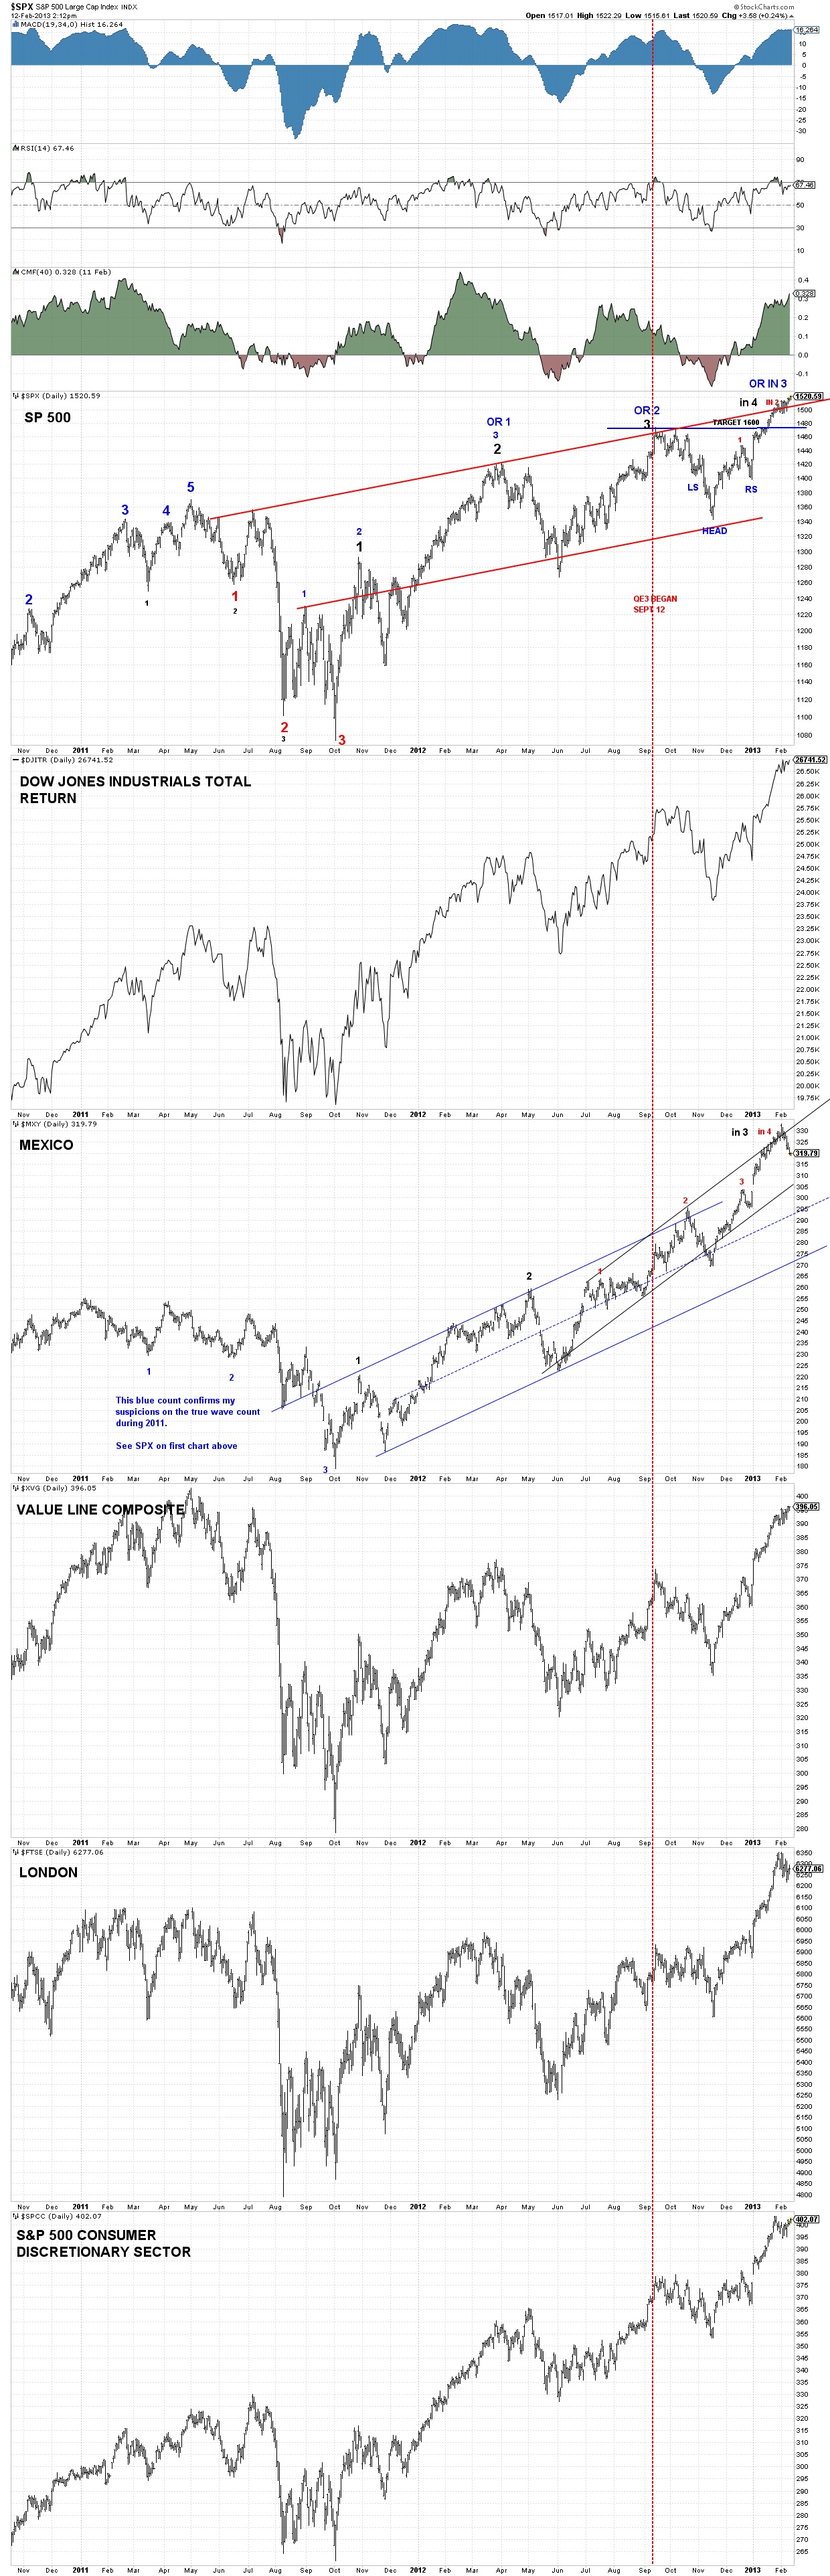
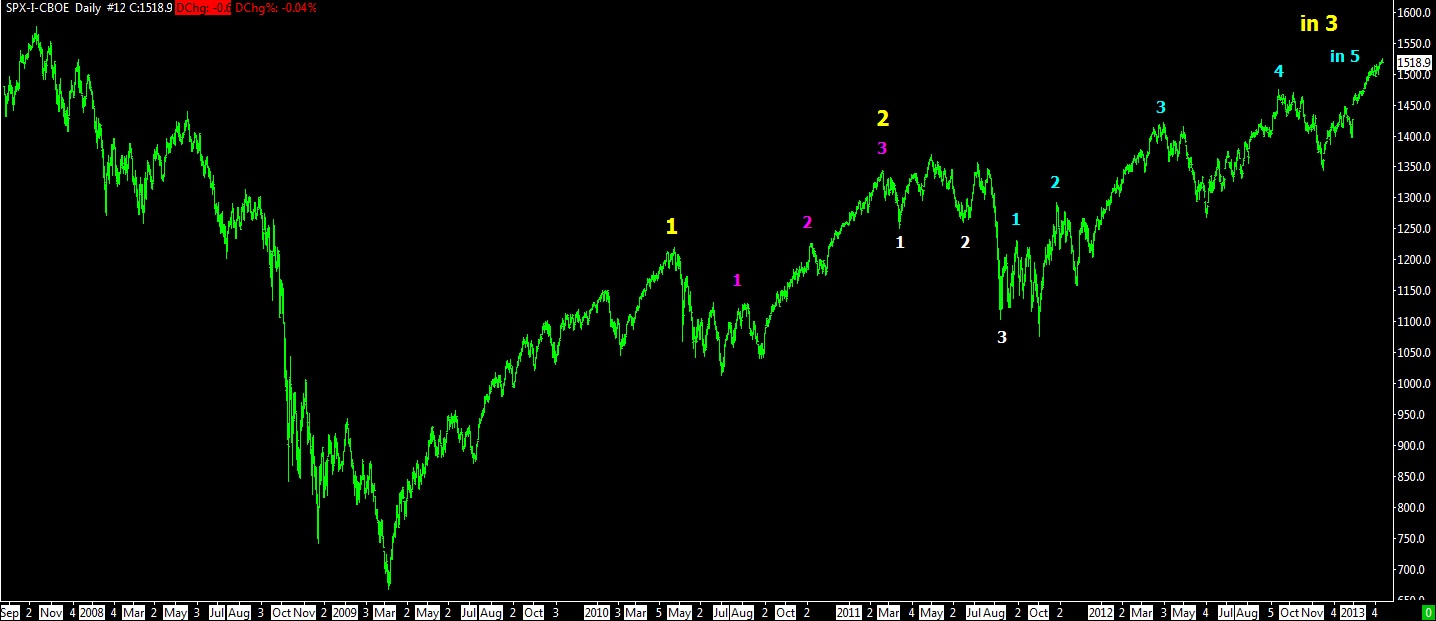
The following chart is my current wave count for SPX (1st chart). There are two possible wave counts in play at the moment.
Looking at the blue wave count implies that we must finish current red 2 and then red 3. This would finish blue 3, which “could” finish the bull market since 2009.
Looking at the black wave count, we need to finish red 2 and 3, which would mark the end of black 4. We would then have a correction, which would be followed by black 5. The end of black 5 “could” also signify the end of the bull market since 2009. Obviously the black wave count calls for a much longer time frame than the blue count. But perhaps something will extend the life of the blue wave count.
The final arbiter of the termination of a wave is a broken channel. Until that takes place, the channel remains in place. Gotta keep that in mind regardless of what I say here.
02-12-13 Daily Indexes
Here is another view of my wave count since March 2009.
02-12-13 SPX DAILY
Here is an interesting viewpoint of a Pitchfork.
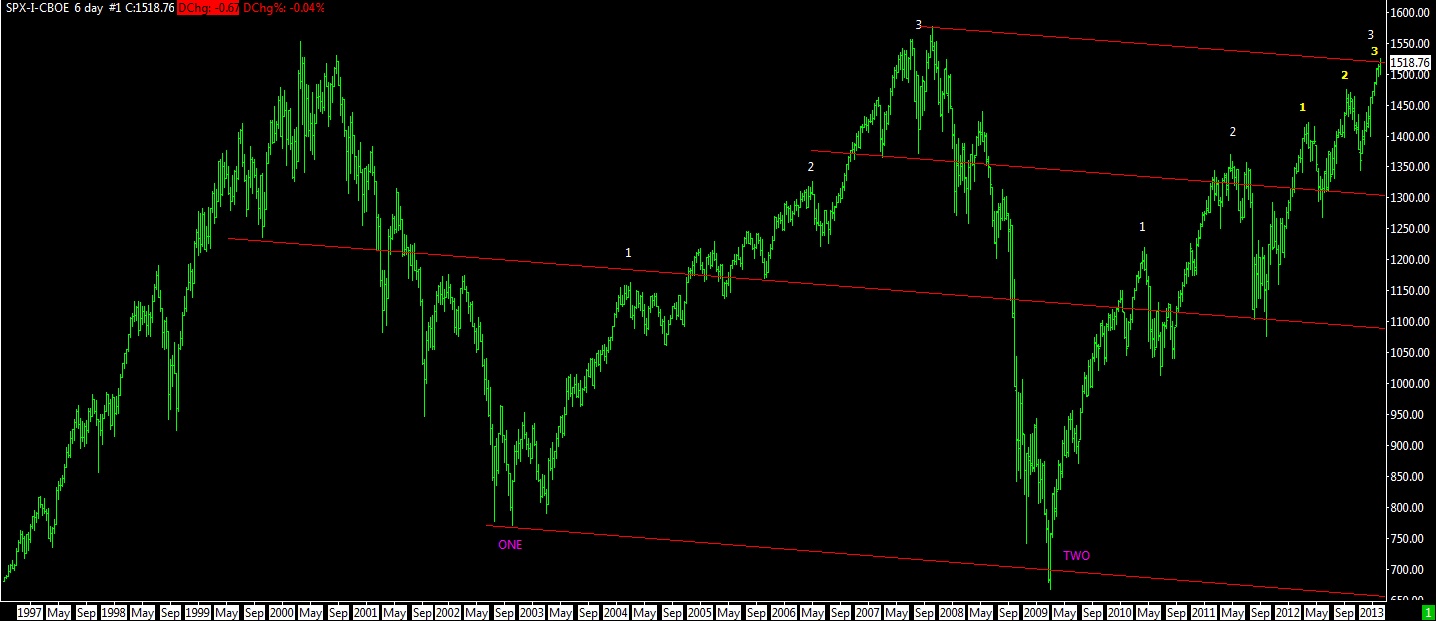
02-12-13 SPX DAILY SINCE 1997
Do I favor either of these wave counts? That requires another chart and that is the net high low chart.
The first chart is a short term look (1 year) of the 10 day EMA of net high low for the NYSE.

02-12-13 Chart #30.5 – NYSE 10 DAY EMA NET NEW HIGHS
The second chart is a long term look (20 years) of the 10 day EMA of net high low for the NYSE.
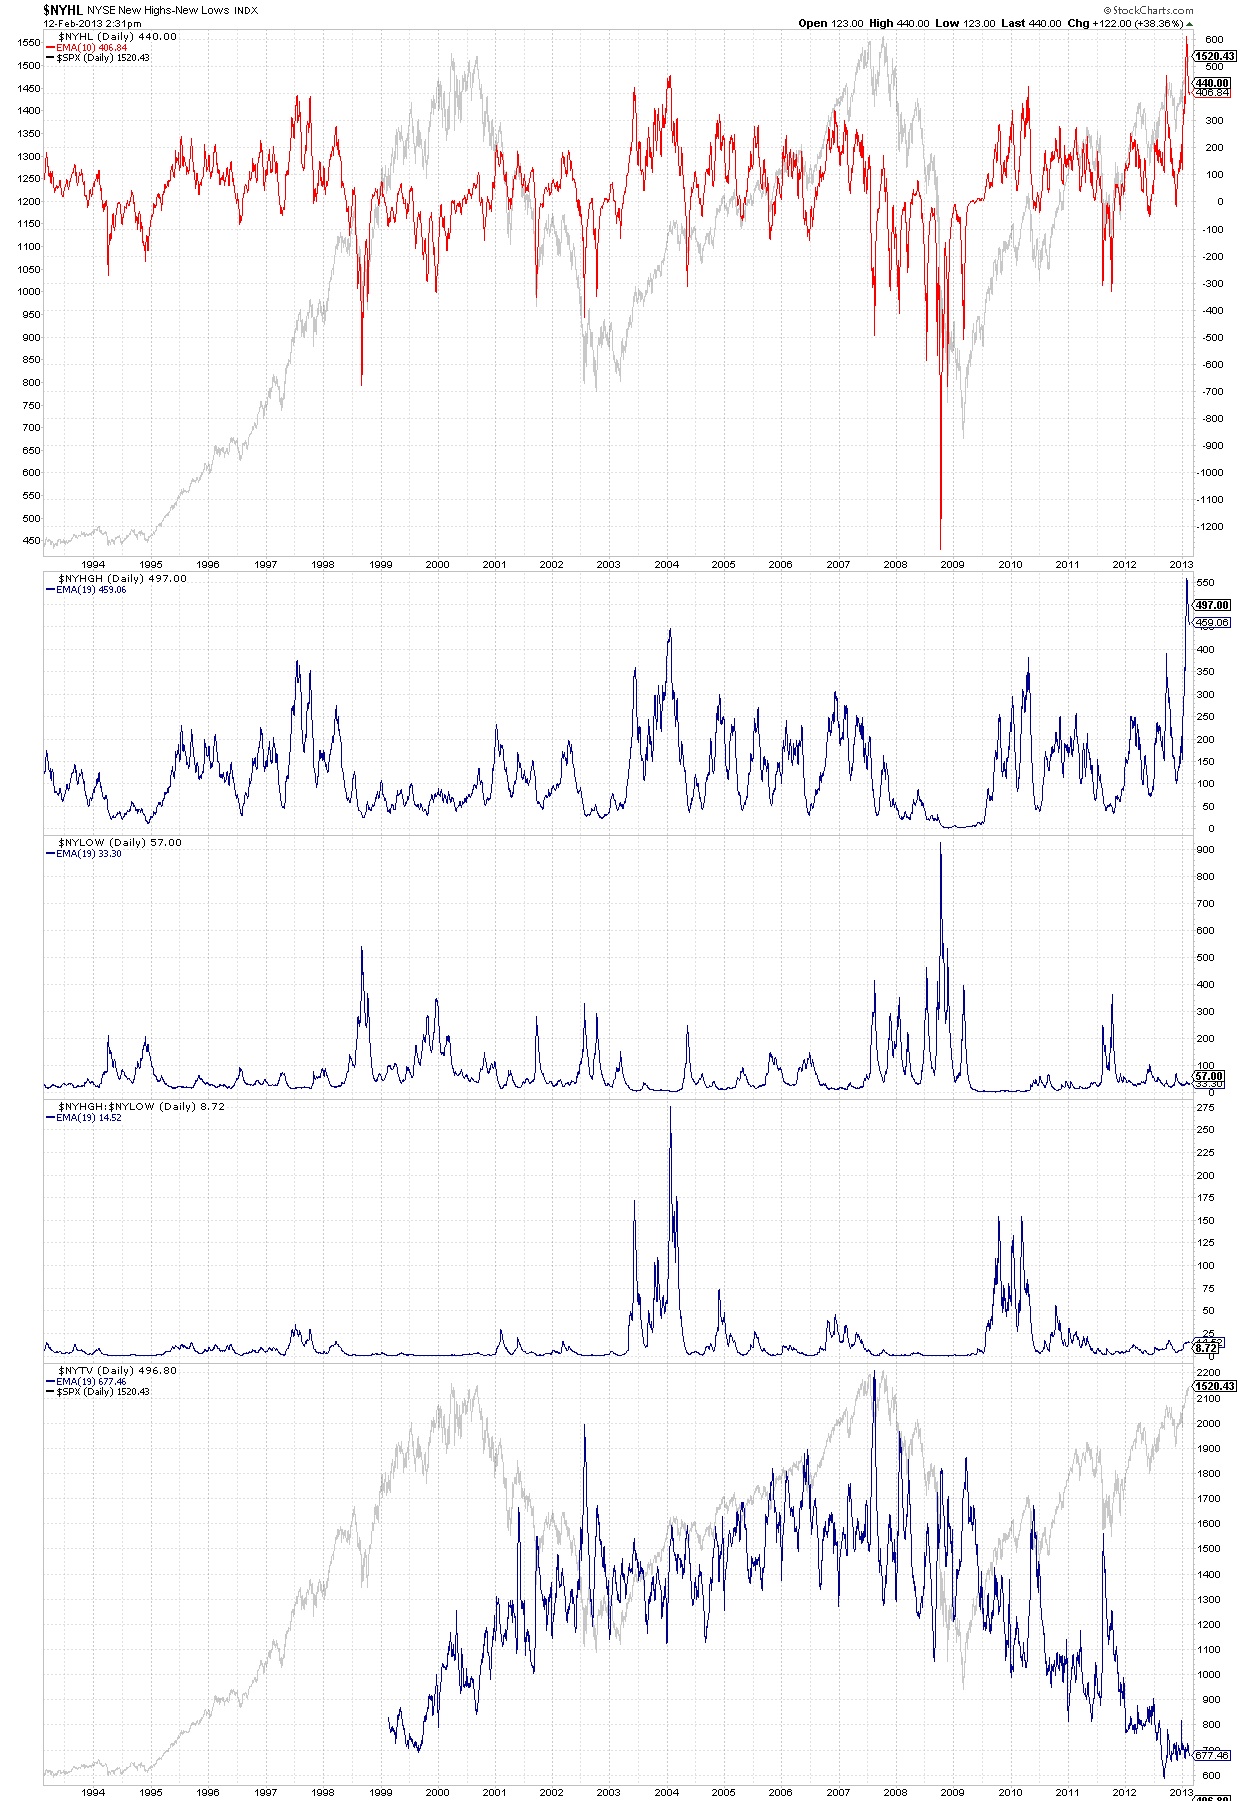
02-12-13 Chart #50.5 – NYSE NET NEW HIGHS
What you are supposed to take away from the long term chart is that bull markets don’t end with a large plurality of new highs. Disregarding the initial burst of new highs that occur following the end of the bear market, the highest 10 day EMA will occur many months before the bull market price peak. After the highest 10 day EMA, we will have several lower 10 day EMA highs as the market moves towards its price peak and terminus. Looking at the long term chart above, you can see that the current 10 day EMA is the highest in the last 20 years. That “should” mean that the termination of this bull market will occur in the future (not soon).
That doesn’t mean the market is going straight up for many, many months. Far from it. It does mean the eventual price high is in the future and not the present. The market always zig-zags its way higher (or lower) over time. Currently we need to end the current red 2 step, correct and then finish off with red 3. At that point we should have a decent correction. What happens after red 3 is going to be very interesting and will decide how much higher and longer this bull market will last.
With net high low plurality thoughts in mind, I would favor the black wave count because it takes longer to complete and has plenty of wave structure to accommodate a falling 10 day EMA net high low chart. The blue wave count doesn’t seem to have the remaining wave structure to create a failing 10 day EMA (but things happen, so lets not discount this until its over).
The black wave count calls for the end or red 2 and red 3 (occurring anytime in the next 9 months). This will be followed by a significant correction. After this correction, we would begin black 5, which should see lower figures for the 10 day EMA. At the conclusion of black 5, we could see a very significant correction, the largest since 2009. This correction could see a resumption of the 2000-2021 (or 2018??) bear market. This would be large step 3 down (step 1 was 2000-2003, step 2 was 2007-2009).
Regarding the blue wave count: It could do something unexpected to extend its life cycle. What??? I don’t know but I’ll probably comment on it when it takes place.
Of the two wave counts, blue and black, I think blue has a better look to it.
There is also a very large bull market possibility mentioned at marketoracle.
The following chart shows this possibility.
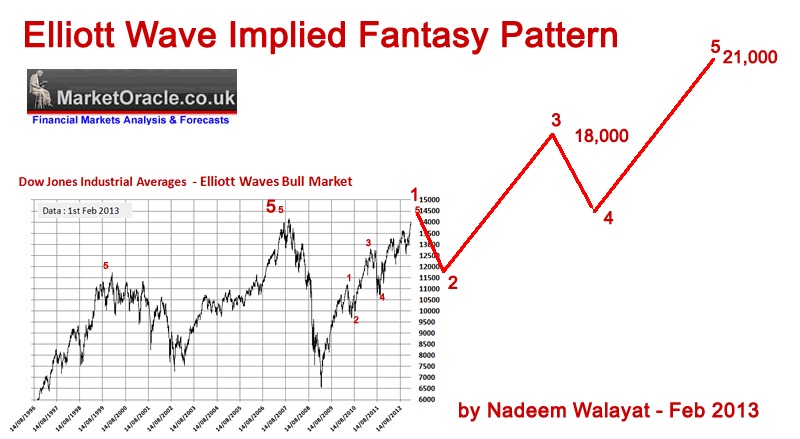
02-12-13 elliott-wave-fantasy-pattern
I have already written about this possibility and at this time, I don’t have a clue if it will take place. It’s just an idea that I kick around occasionally. One idea in its favor is that the opposition thrust after step 2 (March 2009) is normally more complex than the opposition move following step 1 (March 2003). BUT a complex correction after step 2 didn’t take place in the megaphone formation of 1966 to 1974, so that possibility doesn’t really mean much.
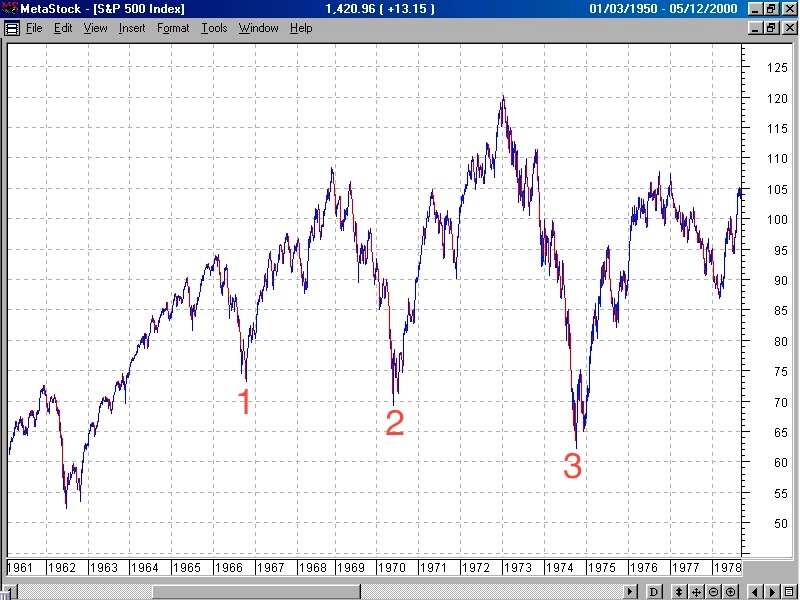
1966-1974 (02-12-13)
I have a couple of problems with the chart labeled “02-12-13 elliott-wave-fantasy-pattern”. One is the position of red 2 and the overall “look” of this chart kills the prospect of the megaphone formation. I’m not married to the prospect of step 3 or the megaphone formation but until I see otherwise, it’s my best guess.
The positioning of red 2 in the chart labeled “02-12-13 elliott-wave-fantasy-pattern” doesn’t seem to be low enough. I have previously stated that I expect such a move to either penetrate the October 2011 low or end slightly above that level. October 2011 is where you can find the small red 4 in “02-12-13 elliott-wave-fantasy-pattern”. I say this because after a step/wave is completed, you must break the “look” of the previous wave. Stopping where the current red 2 is positioned doesn’t appear to break the “look” of the uptrend since March 2009. This is a significant tenet of my wave counting method. It is breaking the “look” that made me question several Elliott Wave interpretations that the bull move was finished in the 3rd quarter of 2003. Some were looking for a resumption of the bear market. I had stated that the rally to that point had not broken the “look” of the previous bear market (2000-2003) and I believed the bull move couldn’t be over. I did have some spirited discussions with several Elliot followers during that time period.
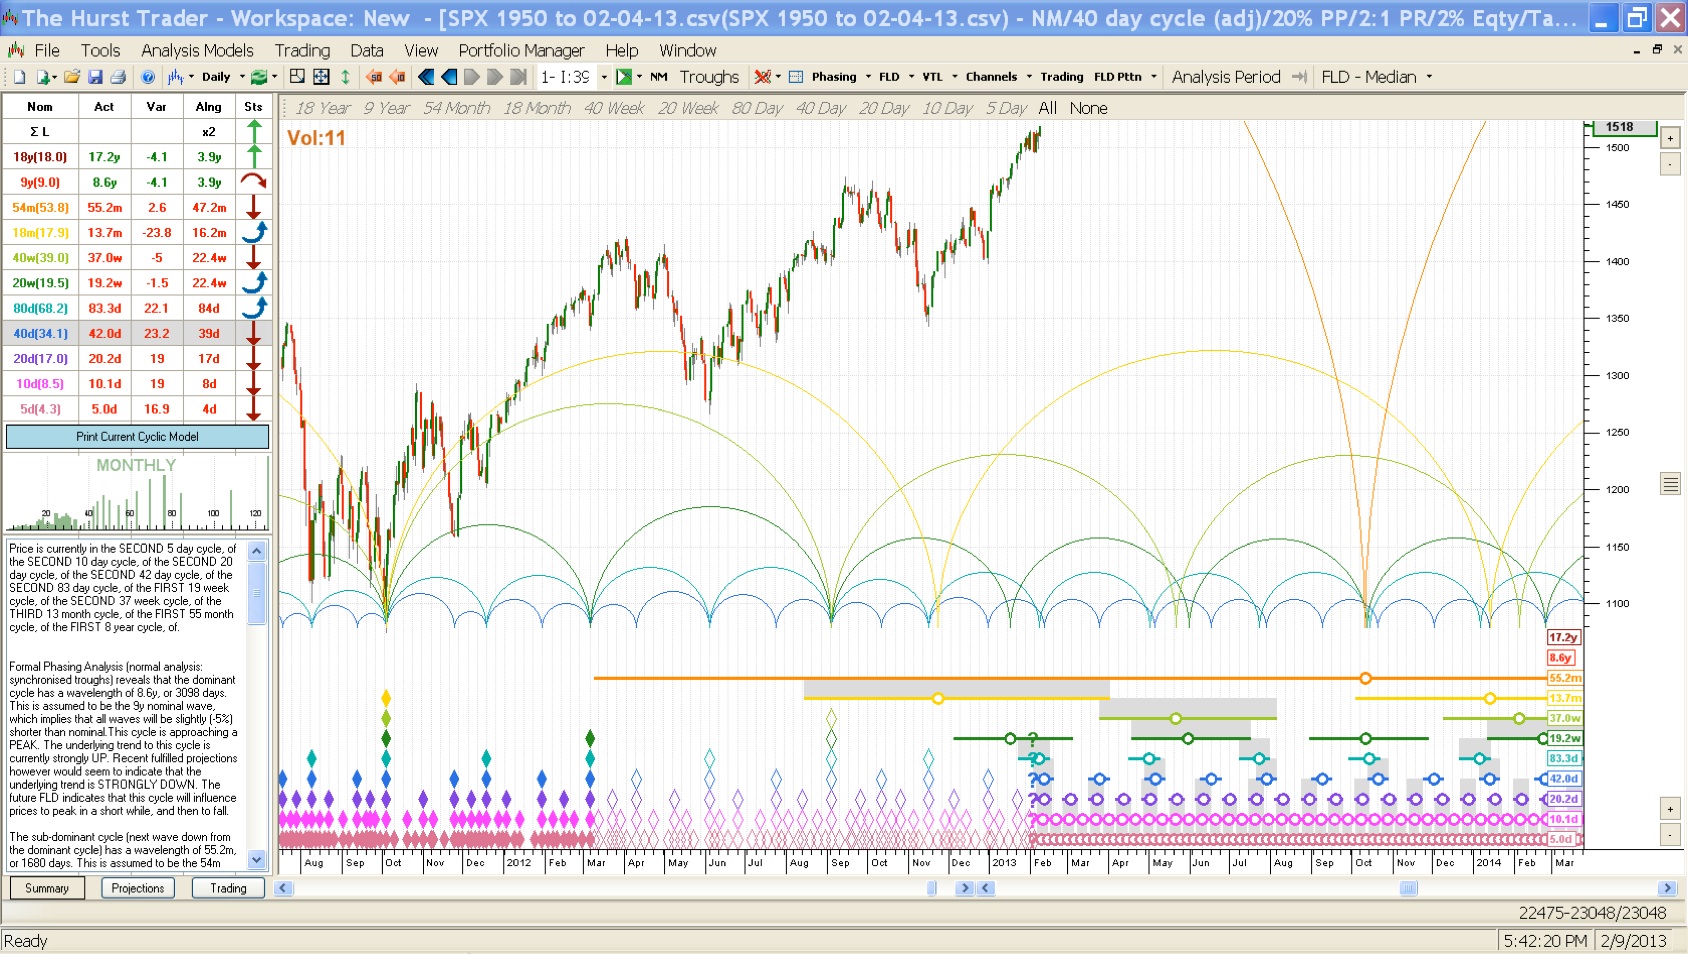
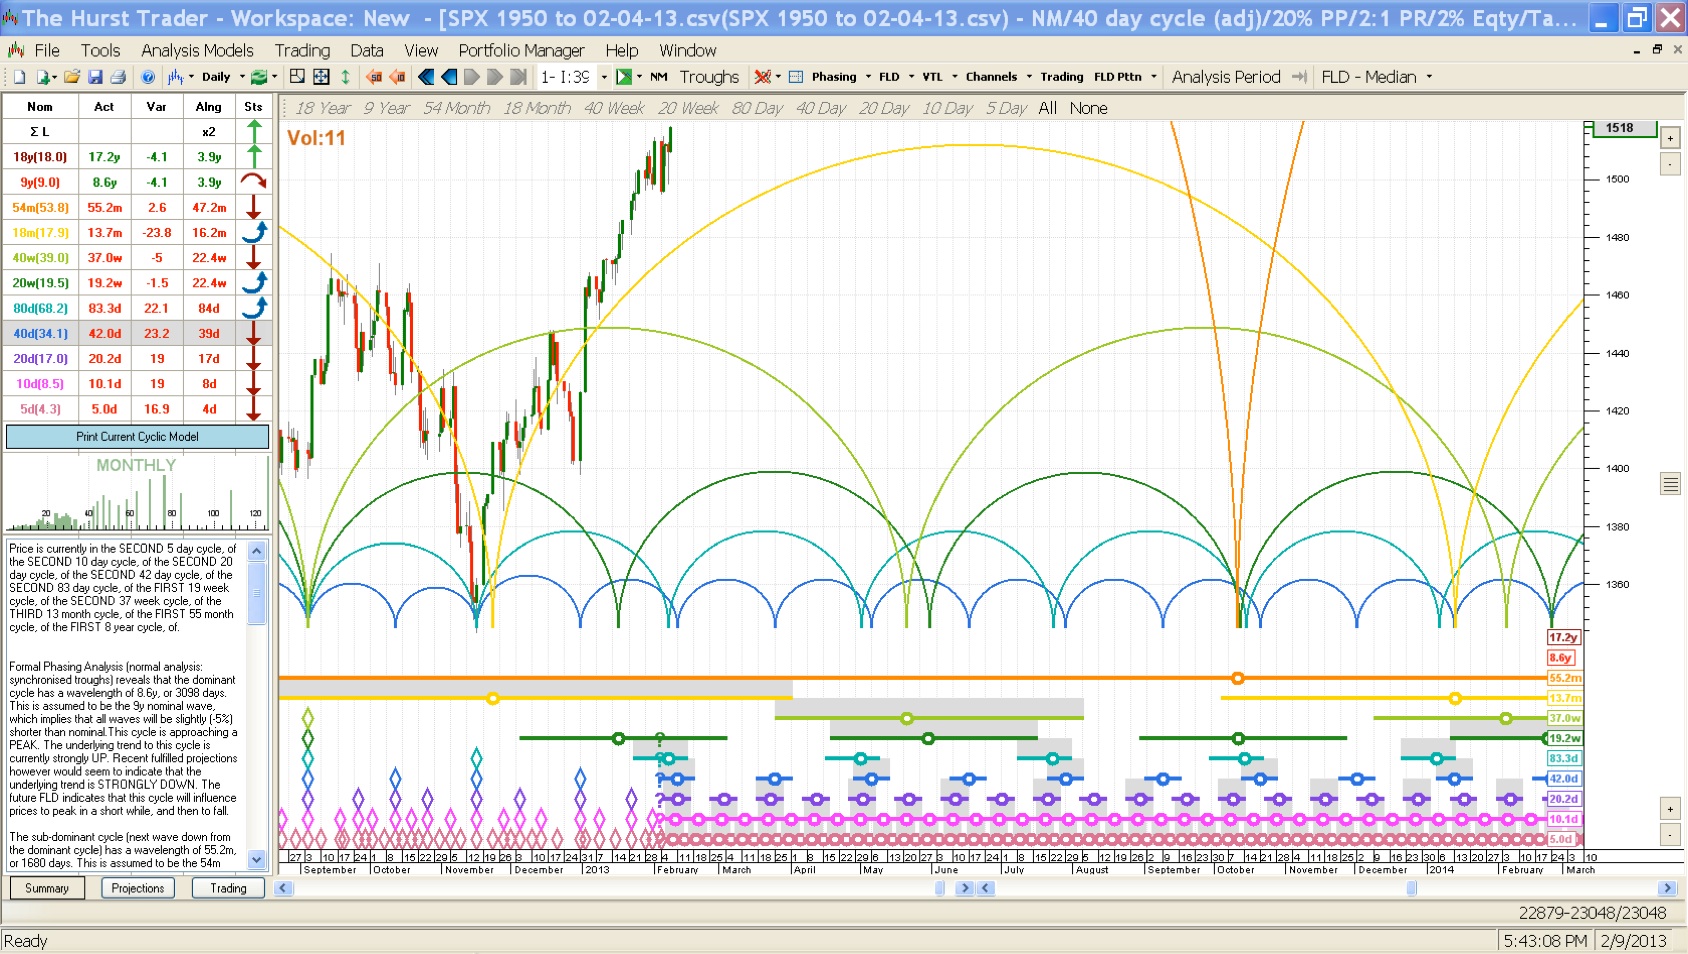
HURST CYCLES
The following are snapshots of various time cycles beginning with the largest cycle to the smallest cycles. You can see “potential” bottoms to the right of the last price fluctuation. A “good” potential bottom shows as a concentration of multiple lows on the charts. The Hurst rules follow these charts.
The software that generated these charts came from SentientTrader.com Check out the different packages they offer. The software is obviously very good and can point to an approaching time zone to look for a low. These time cycle lows can help in connection with my wave counting technique. It’s a good companion piece for wave counts. The company offering this software has it set up so that trades are issued automatically by the software. It’s up to the user whether they decide to follow the suggestions.
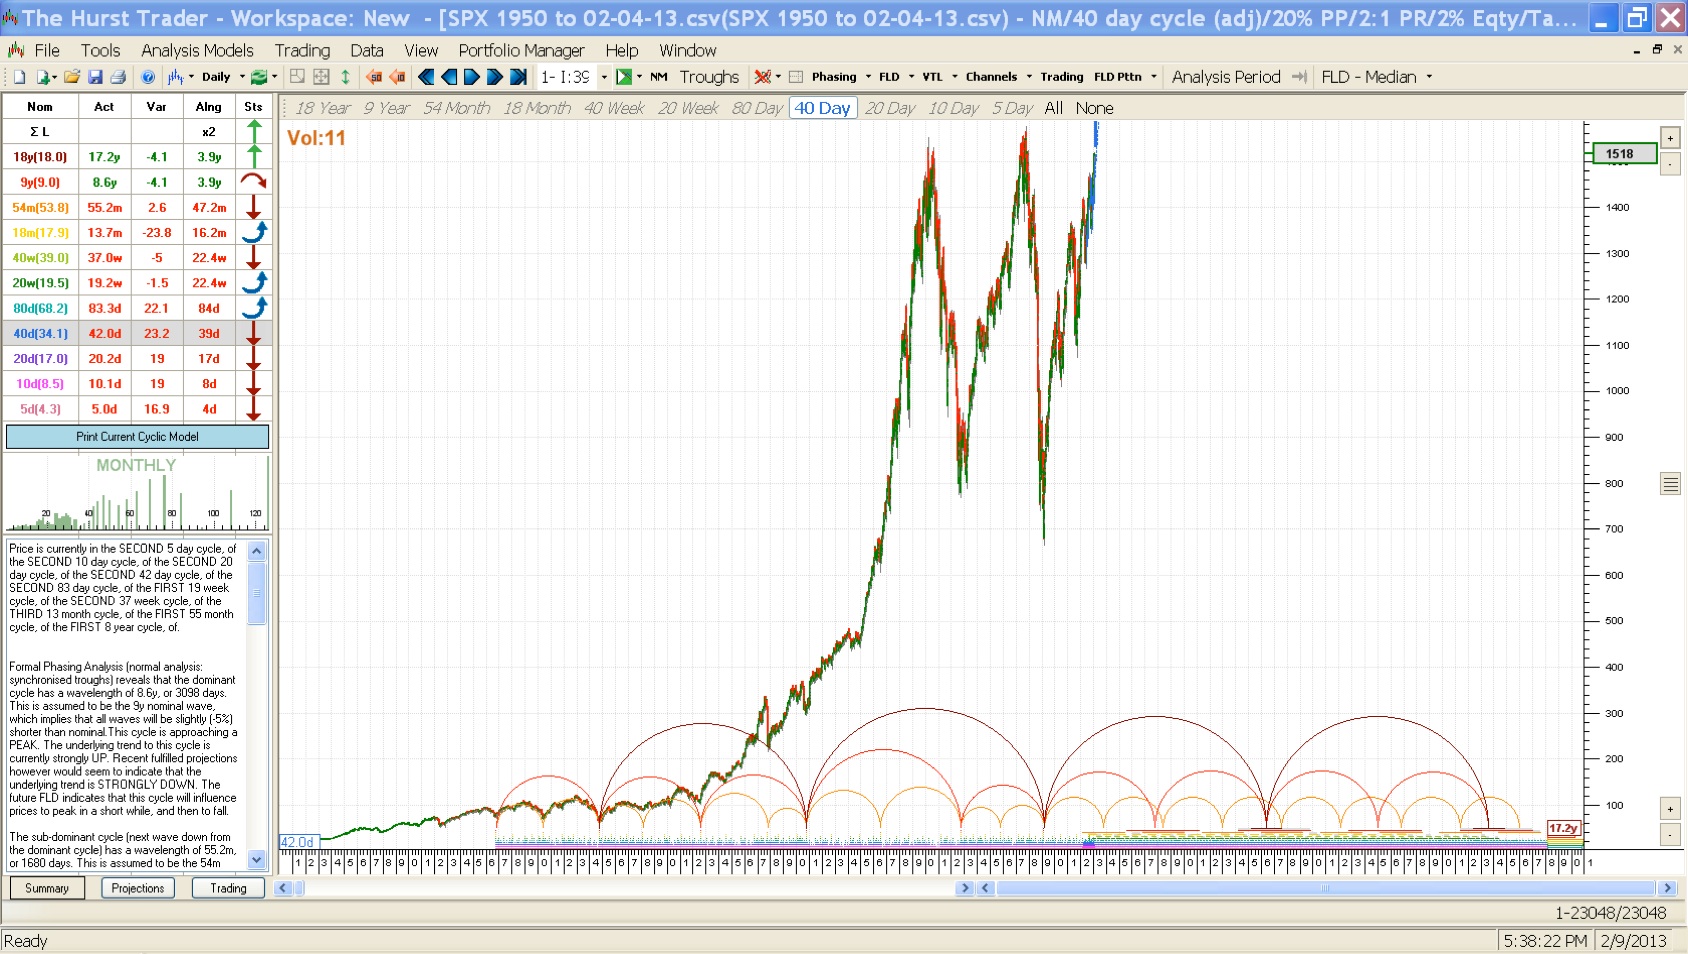
02:09:13 1950 to present
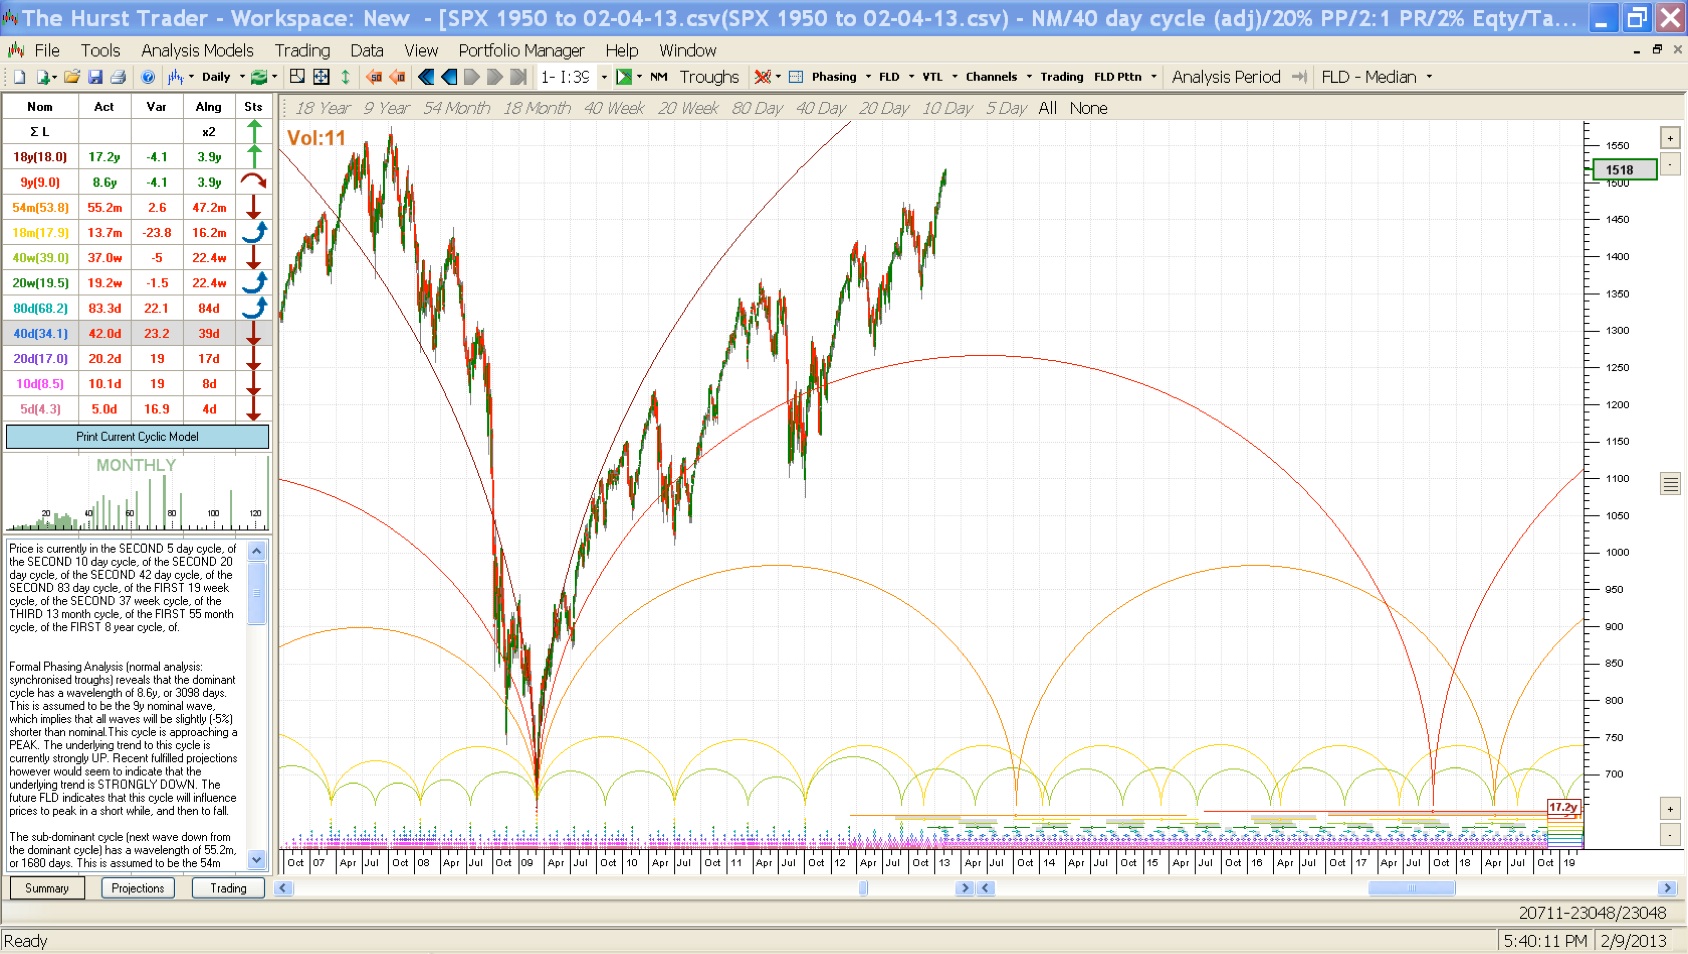
02:09:13 2007 – 2018
02:09:13 2008 – 2013
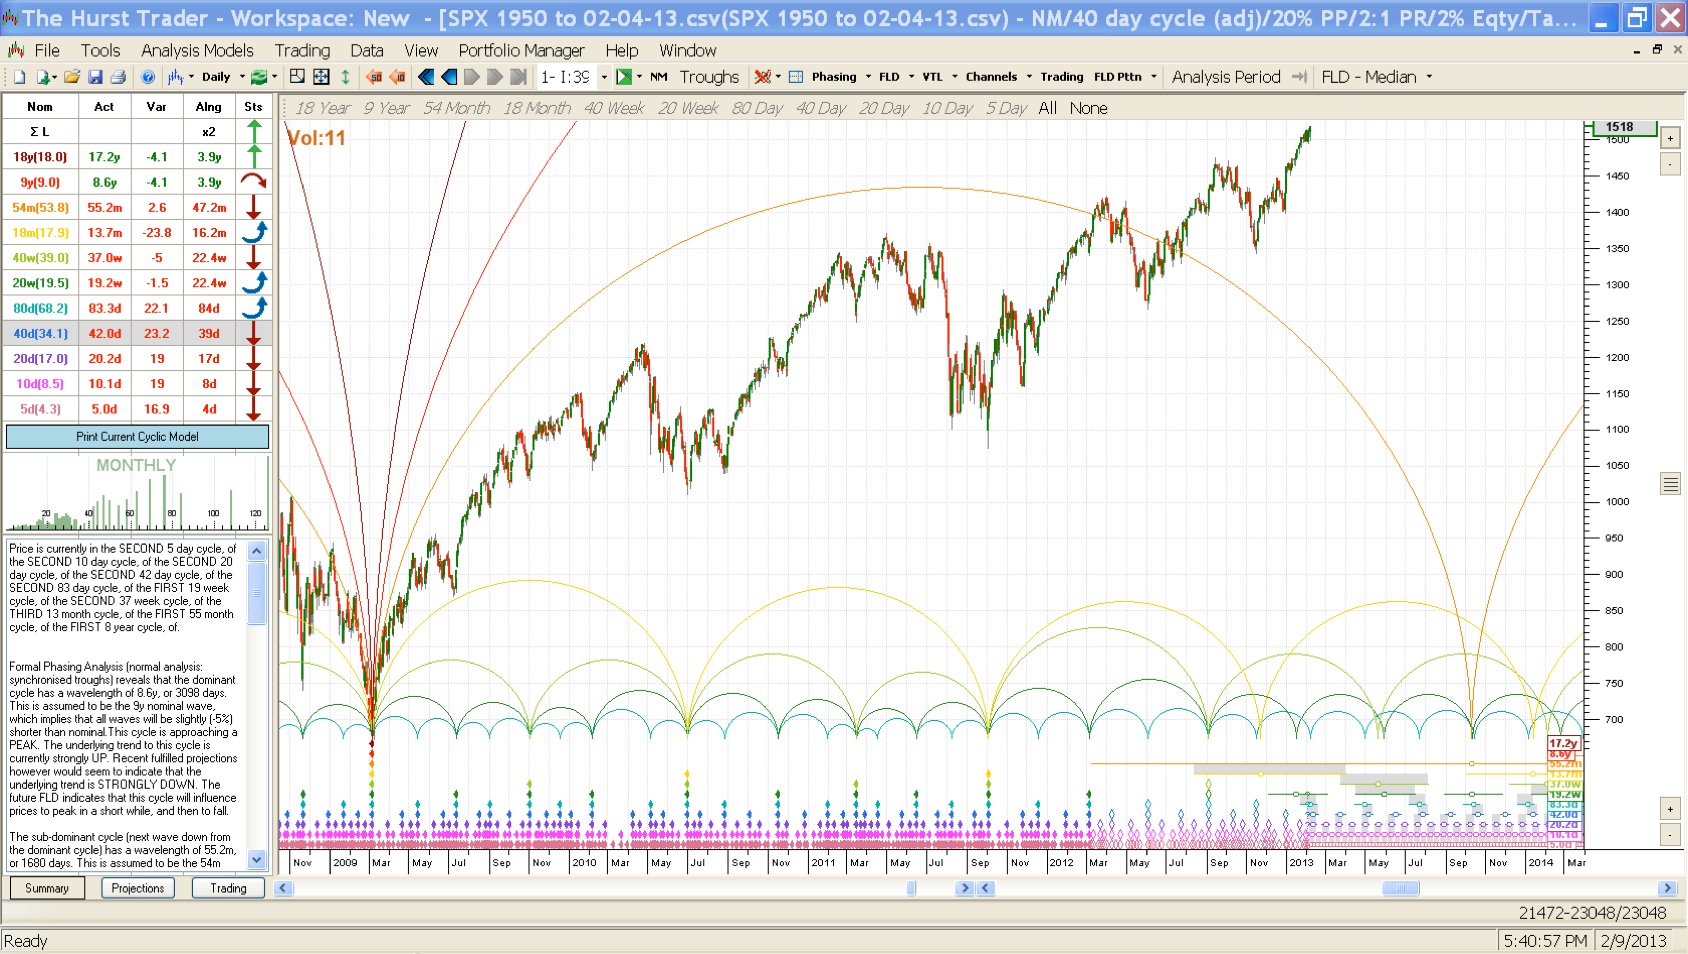
02:09:13 2011 – 2014
02:09:13 2012 – 2014
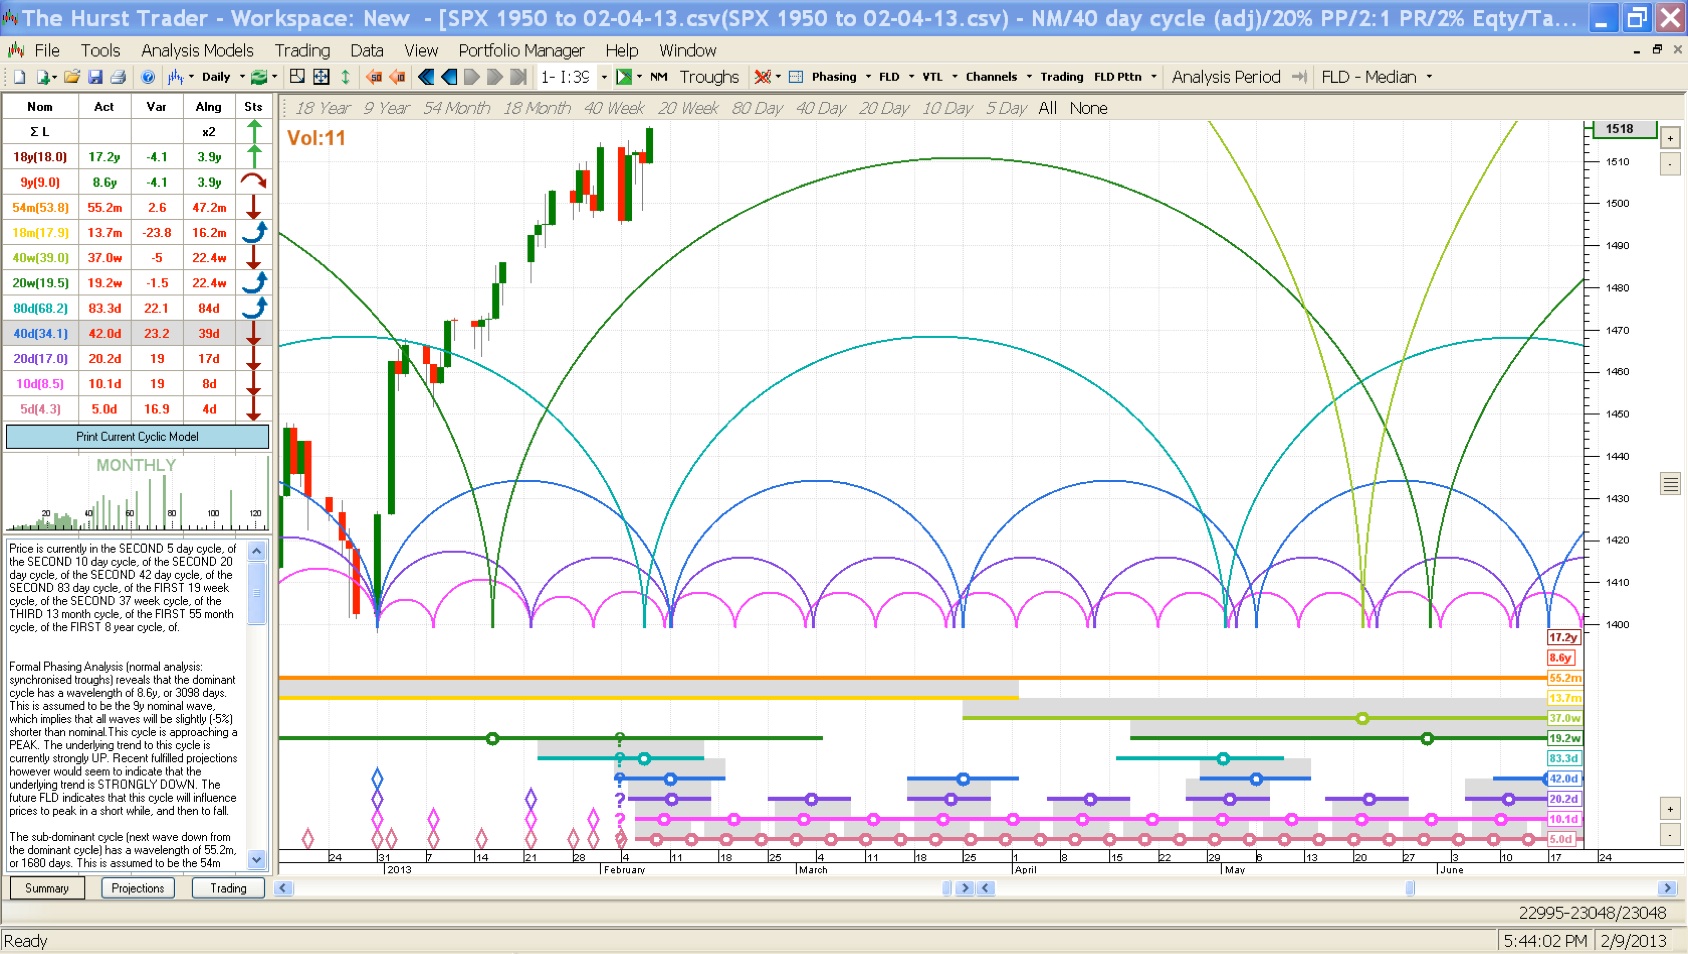
02:09:13 2013
PRINCIPLES OF HURST’S CYCLIC THEORY
The Principle of Commonality – All equity (or forex or commodity) price movements have many elements in common (in other words similar classes of tradable instruments have price movements with much in common)
The Principle of Cyclicality – Price movements consist of a combination of specific waves and therefore exhibit cyclic characteristics.
The Principle of Summation – Price waves which combine to produce the price movement do so by a process of simple addition.
The Principle of Harmonicity – The wavelengths of neighboring waves in the collection of cycles contributing to price movement are related by a small integer value.
The Principle of Synchronicity – Waves in price movement are phased so as to cause SIMULTANEOUS troughs wherever possible
The Principle of Proportionality – Waves in price movement have an amplitude that is proportional to their wavelength.
The Principle of Nominality – A specific, nominal collection of harmonically related waves is common to all price movements.
The Principle of Variation – The previous four principles represent strong tendencies, from which variation is to be expected.
JEFFREY SAUT
“Don’t Just Do Something, Sit There.”
February 11, 2013
“Don’t Just Do Something, Sit There” is the title of a book written by Sylvia Boorstein. I was reminded of the title when I received the following email from a financial advisor at another firm last week:
“Hey Jeff, not only do my clients want me to ‘do something,’ now I am starting to get the feeling I should do something. My shopping list of stocks to buy for the ‘consolidation-pullback’ is up 20%+ over the past five weeks, yet I have not bought any of them despite the fact I have plenty of cash on the sidelines. Now, the next pullback should be higher than where I started waiting for a pullback two weeks ago. For my active accounts, I’ve actually raised a little cash on every step to the upside, but have been holding back on that strategy this week. When my clients start calling ME to talk about what stocks to buy it makes me nervous and I start to get more cautious. Please remind me not to do something just to do something, to be patient. Regrettably, I’m starting to feel like an underperforming hedge fund manager.”
It is typical to hear such laments at this stage of a “buying stampede” as the outs want to be in for the presumed next leg of the rally. Unfortunately, today is session 28 in the typical 17- to 25-session duration of a “buying stampede.” As stated last Monday:
“Such skeins only have one- to three-session pauses or pullbacks before they exhaust themselves on the upside. While a few have lasted for 25 – 30 sessions, it is very rare to have one last for more than 30 sessions. That said, this one feels like it will extend toward the State of the Union address slated for February 12th. That address will likely be viewed negatively by the equity markets, which should serve to finally bring about a 5-7% correction. How the stock market reacts following such a pullback will tell us a lot about the market’s future direction.”
Indeed, I have written that if I could script what the markets were going to do it would be for the D-J Industrial Average (INDU/13992.97) to confirm the D-J Transportation Average’s breakout to new all-time highs with a new all-time closing high of its own. That would require the Dow to travel above its October 9, 2007 high of 14164.53, which is only 171.56 points away. If that happens, it would break the stock market out of its 13-year wide-swinging trading range, much like what occurred in August of 1982 following that 17+ year wide-swinging trading range market so often referenced in these missives. Likewise, it would clear up any doubts about a Dow Theory “buy signal.” Such an upside confirmation would also reinforce my sense that we are potentially in a new secular bull market.
With the thought of a new secular bull market in mind, I went back and studied my notes from August through November of 1982, which was the “lift-off” phase of a new secular bull market that would last until the spring of 2000. Accordingly, the sideways, wide-swinging stock market of 1965 – 1982 ended on August 9, 1982 with the Dow at 780.34. From there it went into a 20-session “buying stampede” that would leave the senior index 18.5% higher before peaking at 925.13 with a subsequent 3.7% pullback lasting 20 sessions. The second leg of the “lift-off” phase began on September 30, 1982 and took the Dow up another 14.7% where it challenged the then all-time high of 1051.70 made in January of 1973, coincident with the peaking of the nifty-fifty stocks. The Dow did not make it through that level on its first try, but after regrouping for seven sessions, the upside breakout was complete and the rest of the story is history, as can be seen in the chart on page 3.
Fast forward, the INDU bottomed on November 15, 2012 and marched higher into its mid-December short-term peak for a 5.66% gain. The ensuing decline was only 2.7% before the back-to-back 90% Upside Volume Days of December 31 and January 2, 2013 that started this year’s “buying stampede.” As of last Friday said stampede has lifted the Dow another 8.2%. The combined ride from November 2012’s intraday “lows” to the recent intraday “highs” has been 12.4%. Like in 1982, this two-step rise has left the Industrials and the S&P 500 (SPX/1517.93) within striking distance of their respective all-time highs. Whether they get through them on the first try remains to be seen, but many of the other indices have already done so. Yet, none of this really speaks to my emailer’s question about “doing something.”
To that point, I continue to like the strategy espoused by my friends at the Riverfront organization. To wit:
“First, identify the quantity of cash to be put to work – example: 20%. Second, break the trade into digestible chunks – example: break it into four parts, 5% each. Third, implement the first trade today – example: invest 5% into equities today. Fourth, set a date for implementing the second trade – example: two months from today invest the second 5%. Fifth, implement third and fourth segments if the market pulls back – example: invest the remaining 10% of the cash on market pullbacks. And six, after the date of the second trade occurs, return to step one with the remaining cash – example: two months from today, if the market never provides the opportunity to buy on a pullback, break the remaining 10% up into three to four parts and follow a strategy similar to the one utilized for investing the first 10%.”
The call for this week: Well, here we are with tomorrow night’s State of the Union address. Consequently, I am looking for a trading top this week follow by a 5% – 7% pullback and then we’ll see how the markets handle themselves. Again, if I could script it, I would like to see the Dow Industrials confirm the Dow Transports with a new all-time high of their own, which would use up all the stock market’s remaining internal energy on a short-term basis, resulting in a “sell on the news” pullback. However, they don’t operate the various markets for my benefit.
…………………………………
- Click on any picture or chart to enlarge it
All Rights Reserved © ™
Explore posts in the same categories: CYCLES, IN DEPTH, JEFF SAUT, UPDATE, WAVE COUNT
Leave A Reply