01/17/13 – Ammended – Long Term Wave Count

MARKET MESSAGES
1/16/13 – amended
I have added to yesterday’s blog posting. It’s the same as yesterday except for what follows the second chart.
As we approached the 2007 peak I was faced with choosing between 2 different wave counts. Today I have the identical situation facing me. My decision in 2007 was to go with both wave counts and today I will do the same. I’ll do this because I’m managing risk and Benjamin Graham said:
“The essence of investment management is the management of risks, not the management of returns. Well-managed portfolios start with this precept.”
In the distant past it took a young gunslinger like myself a lot of years to learn this concept.
The following two charts are identical except for the wave counts and a couple of lines that I have drawn.
The 1st chart shows a conventional wave count for step 3 (yellow). The point that is contentious is the blue wave count in yellow step 3.
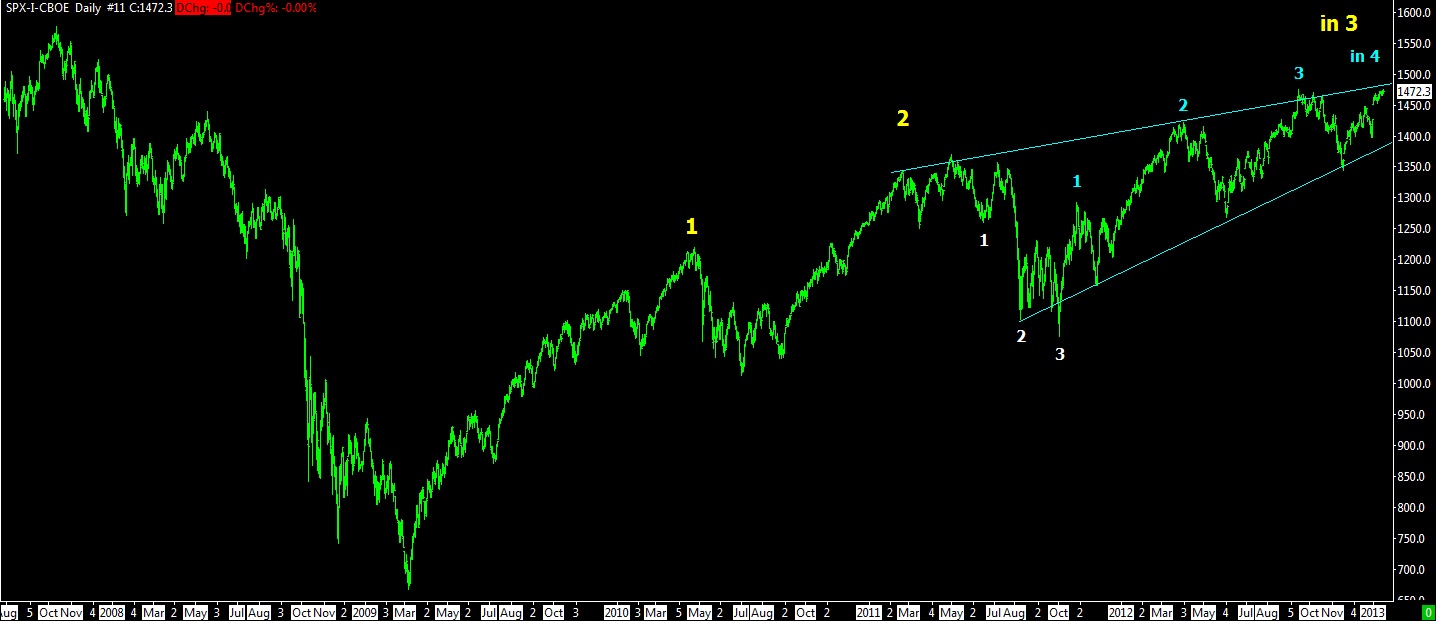
01-16-12 SPX DAILY BARS – 1
This next chart is a bit unconventional because of the wave count during the correction in the first half of 2011. Notice that I have labeled step 1 down (white), which is followed by a higher high. The end result is that this chart starts the 5 steps up (blue) at an earlier date than the first chart. The end result is that this chart shows us currently in step 5 (blue), while the first chart shows us in step 4 up (blue).
I was troubled by the wave count in 2011 and decided that the wave count in the second chart was correct. The surprise that followed was the October 2011 plunge.
One factor in support of the following wave count is that you can draw a straight line from the peak 1 to peak 3 (blue). This is part of the channel concept, but it doesn’t necessarily make the unconventional wave count correct. It just makes it a better “what if”.
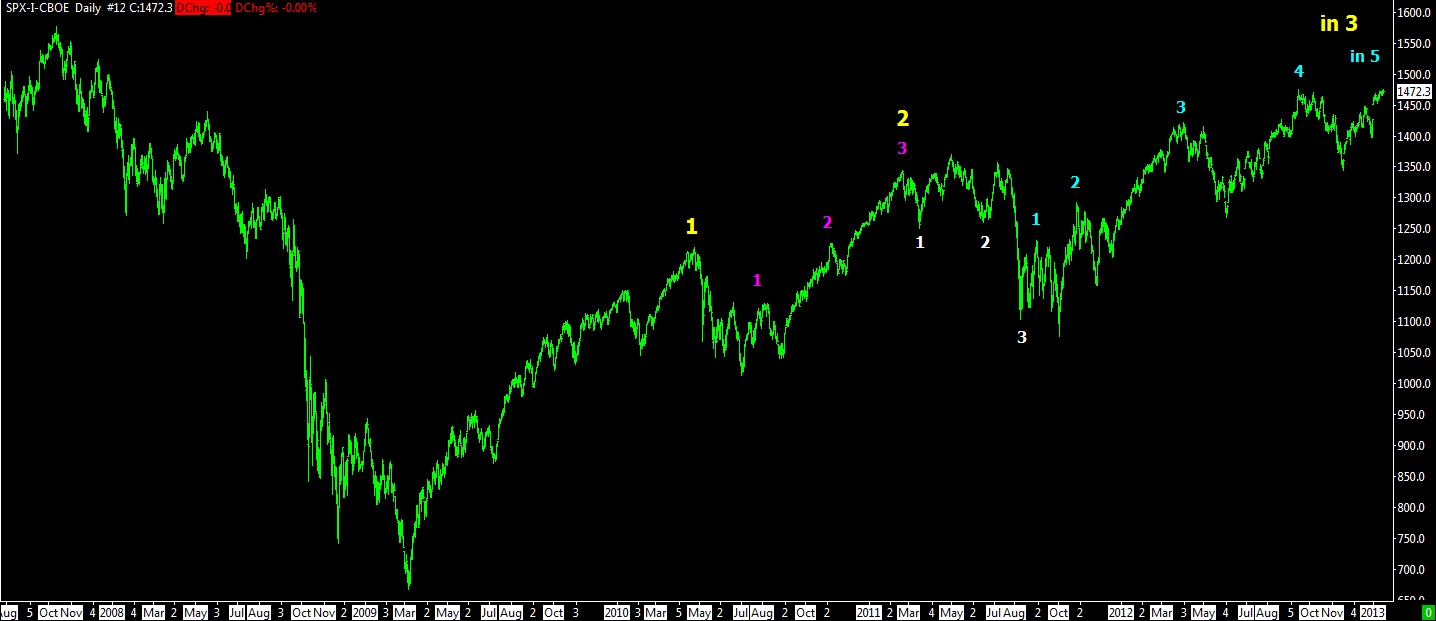
01-16-12 SPX DAILY BARS – 2
As we approached the 2007 peak I declared that the end of the bull market was possibly over in early May 2006. This was wrong because this correction was followed by another rally to a new high. Upon hitting new highs I knew that the secondary wave count was correct.
Look at the next chart and you can see how easily I made the mistake on the wave count in 2007. I was well aware of the fact that I could be making a mistake in 2006 because I was bothered by the fact that the March 2003 bottom was considered to be THE bottom and not October 2002. But March 2003 was a higher low in a LOT of indexes and I therefore initially went with the October 2002 bottom.
Where is the bottom type problem also arose in September-October 1974. At that time the bottoming step was not counted correctly by Edson Gould (he had a completely different step method than me). The bottom was September 1974 and not December 1974 as Gould declared. That was my first lesson in seeing this type of problem. It can often occur on major bottoms and you have to work the problem out for your own satisfaction. My advice is to not be married to one viewpoint. Be ready to recognize your error and take advantage of the current situation. Sitting with a long term short when you should be long is ridiculous and you need to shift gears when necessary.
I have seen THE major expert on the Elliott Wave Theory sitting short through the last step up of the bull market (2006 to 2007). A LOT of money was lost before it was made back. In fact he missed almost all of the bull market moves beginning in the 1990s. Don’t ever make that mistake. I admit my errors quickly and do whatever is necessary to get back on board. It’s called survival.
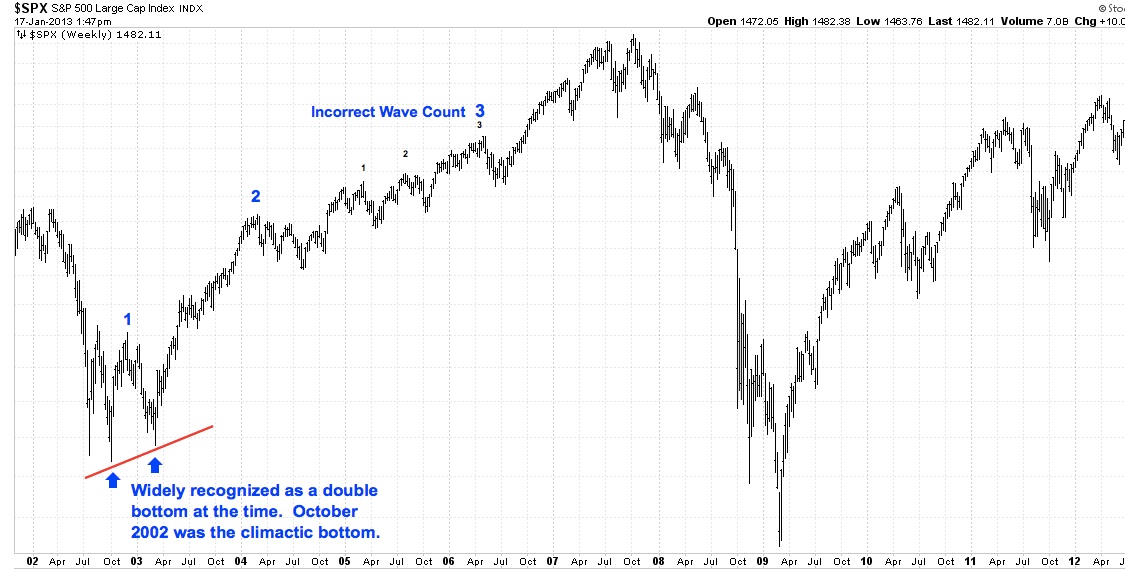
01-17-12 Incorrect Wave Count
The following chart is the way that I should have counted the steps up from 2003 and it did become my revised count after the decline in May 2006 didn’t work out.
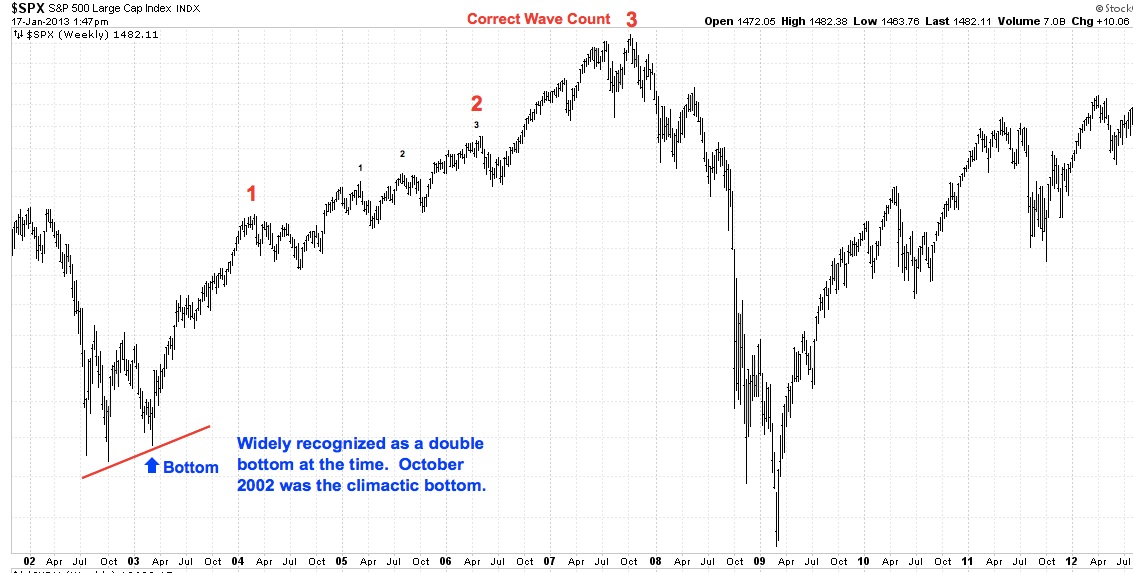
01-17-12 Correct Wave Count
In 2002 – 2003 the second bottom (March 2003) was the bottom to start the count. It is very likely that the March 2009 bottom was THE bottom too. Did you notice the repeating dates there??? March 2003 and March 2009 for major bottoms. The panic lows were also seen in October 2002 and October 2008. Maybe March 2015 is going to be a bottom of significance too??? That would be too easy if true. I don’t see 2015 as the end of step 3 down. It doesn’t seem right, but who really knows what’s going to happen. I don’t.
Just to confuse the situation unnecessarily, there is an unlikely possibility that the bottom in October 2008 was the real bottom and step 1 up occurred from October 2008 to December 2008. This would mean we haven’t begun the last step up (5th). At the moment this possibility has no place in my thinking, but later . . . who knows.
- Click on any picture or chart to enlarge it
All Rights Reserved © ™
Explore posts in the same categories: UPDATE
Leave A Reply