01/19/13 – Clarification & Cycles

MARKET MESSAGES
1/18/13
I saw some referral comments on Thursday regarding my blog post on the 16th and 17th that kinda led me to believe that people “might” be thinking that I am bearish RIGHT NOW. Nope, not true. I was “trying” to tell everyone in those posts (not completely successfully) that I can see ahead where things are going to create a bearish turn. Today I am on guard against the unexpected event, but enjoying the ride. I ain’t buyin’ and I ain’t sellin’ (short term holdings only meaning they are for sale at a moment’s notice, I have no long term holdings left).
I guess I also didn’t cover the possibility of a wave extension in the earlier posts. This is one of those things that makes a bull market have legs. As I have said before, I don’t see the bull market ending now, but later this year could be a possibility (if not earlier).
Sometimes I really don’t make myself clear in my blog and I know that. They only way I know if I’ve screwed up is if someone tries to summarize my post. Without that, I’m clueless (as usual). After I saw the comments, it made me think that I came across TOO bearish.
The long term count that I posted on January 16th and 17th weren’t supposed to frighten you right now. It was meant as a look ahead as to what could be developing. So don’t get bearish right now . . . WAIT for proof of the wave count conclusion before you go full out bearish. That’s something that kept me in the bull camp earlier when the market was correcting. I couldn’t pull the plug on the bull because things didn’t seem right to me. Sometimes you might be wrong in your conclusions, and you gotta be careful about going against the tide for obvious reasons.
One thing that I’ve learned about the wave count is that you have to wait for the step to end conclusively before going full out in the opposite direction. Sometimes wave extensions take place or you just miscounted the steps. Sometimes there is nowhere for the count to go except reverse. I love it when that happens because those are really big profit points for me as I leverage way up for those.
One point that can save you from a mistake is remembering that the trend is intact until the channel is broken. I have seen a single small step go on for 6-9 months. That’s a long time for a single small step and it marks a really strong market. One that won’t turn around quickly.
Making the case for the bull was Arthur Hill on Friday. I do agree for the moment but I almost NEVER agree with anyone when I declare a top or bottom. Most people’s records on tops and bottoms are dismal. His Friday update follows:
“RISING PEAKS AFFIRM LONG-TERM UPTREND IN SPY … The long-term trends are clearly up as several major index and sector ETFs recorded 52-week highs this week. Despite these long-term uptrends, short-term conditions are getting quite overbought. The S&P 500 ETF (SPY) is up around 10% from its mid November low and the Russell 2000 ETF (IWM) is up over 15%. These are big moves in a relatively short timeframe (two months). There was a short and sharp correction at the end of December, but stocks quickly recovered to start 2013 with a real bang. Now what? Even though upside momentum is slowing and signs of indecision are starting to appear, there are simply no signs of significant selling pressure and turning long-term bearish now would be a top picking exercise. Furthermore, we have yet to see a major topping or distribution pattern form on the price charts. Chart 1 shows weekly bars for SPY since July 2010. A distribution pattern formed in the first half of 2011 and SPY broke support with a sharp decline in August 2011. Even though the market firmed soon after this breakdown and SPY resumed its uptrend, such a strong support break argued for caution at the time. SPY clearly resumed its uptrend with the higher low in November 2011 and breakout in January 2012. The ETF has since formed a series of higher peaks and higher troughs. We have yet to see a distribution or topping pattern similar to that seen in 2011. Long-term support is based on the November low.”
It wouldn’t be surprising to see a correction begin before too long as the market is overbought (see oscillators on page 3 and 4 of my charts).
We achieved a NEW Dow Theory signal on Friday. That conventionally means that all is well for now and I have no quibble with that. I think Jeff Saut will have more to say on that subject on Tuesday.
01-19-13 Dow Theory
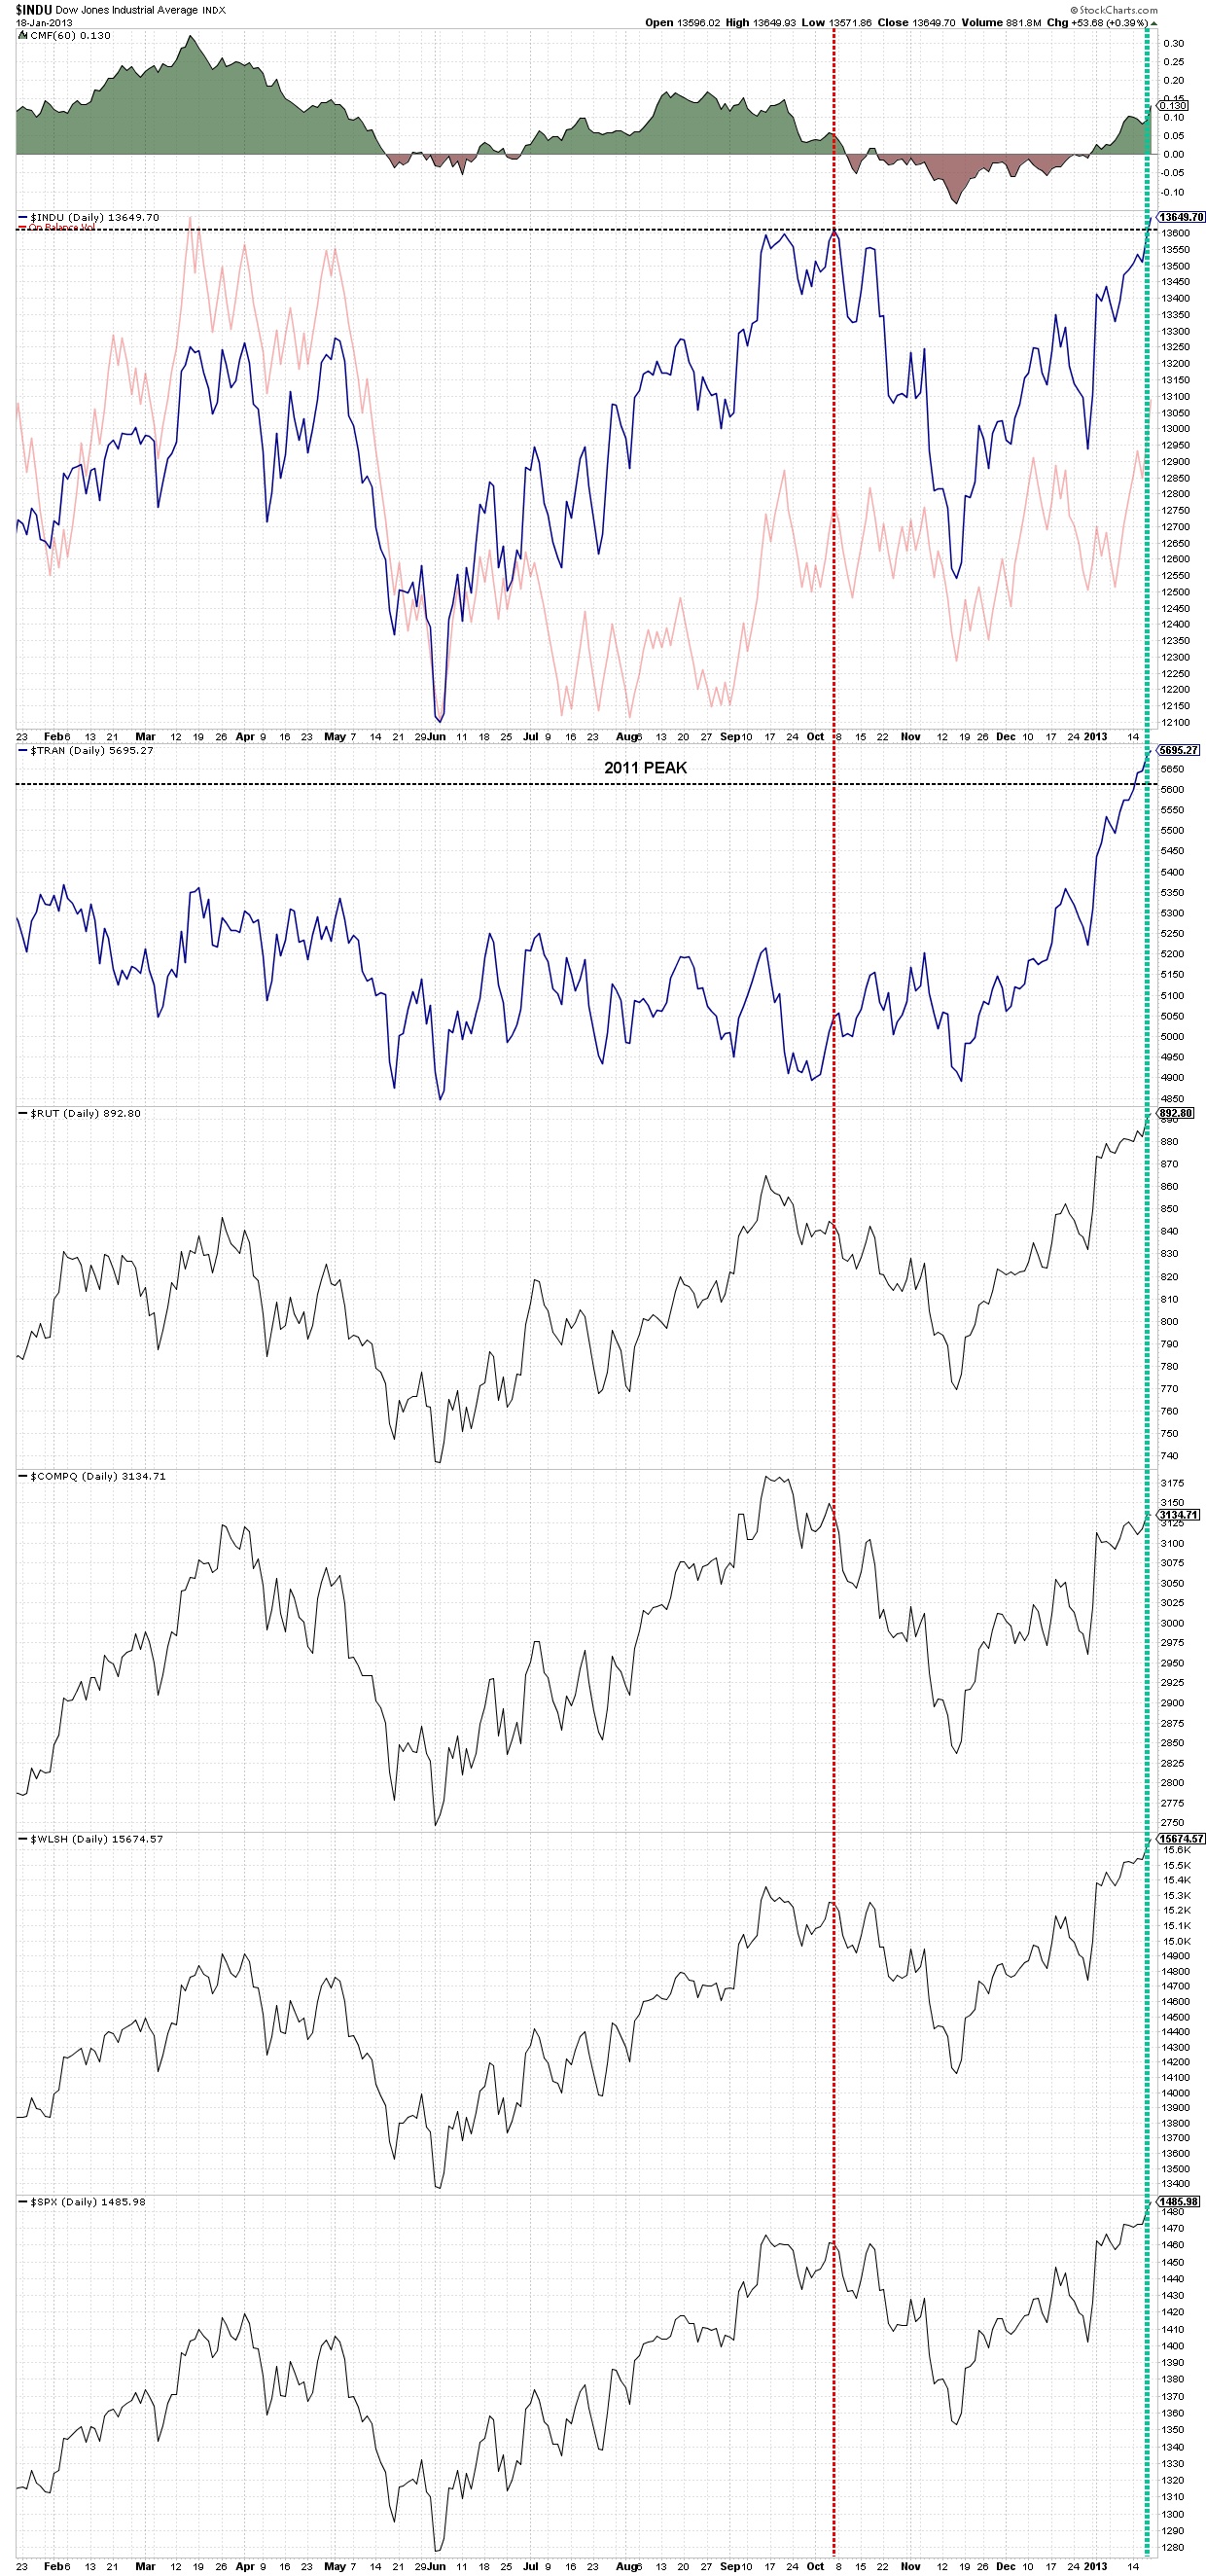
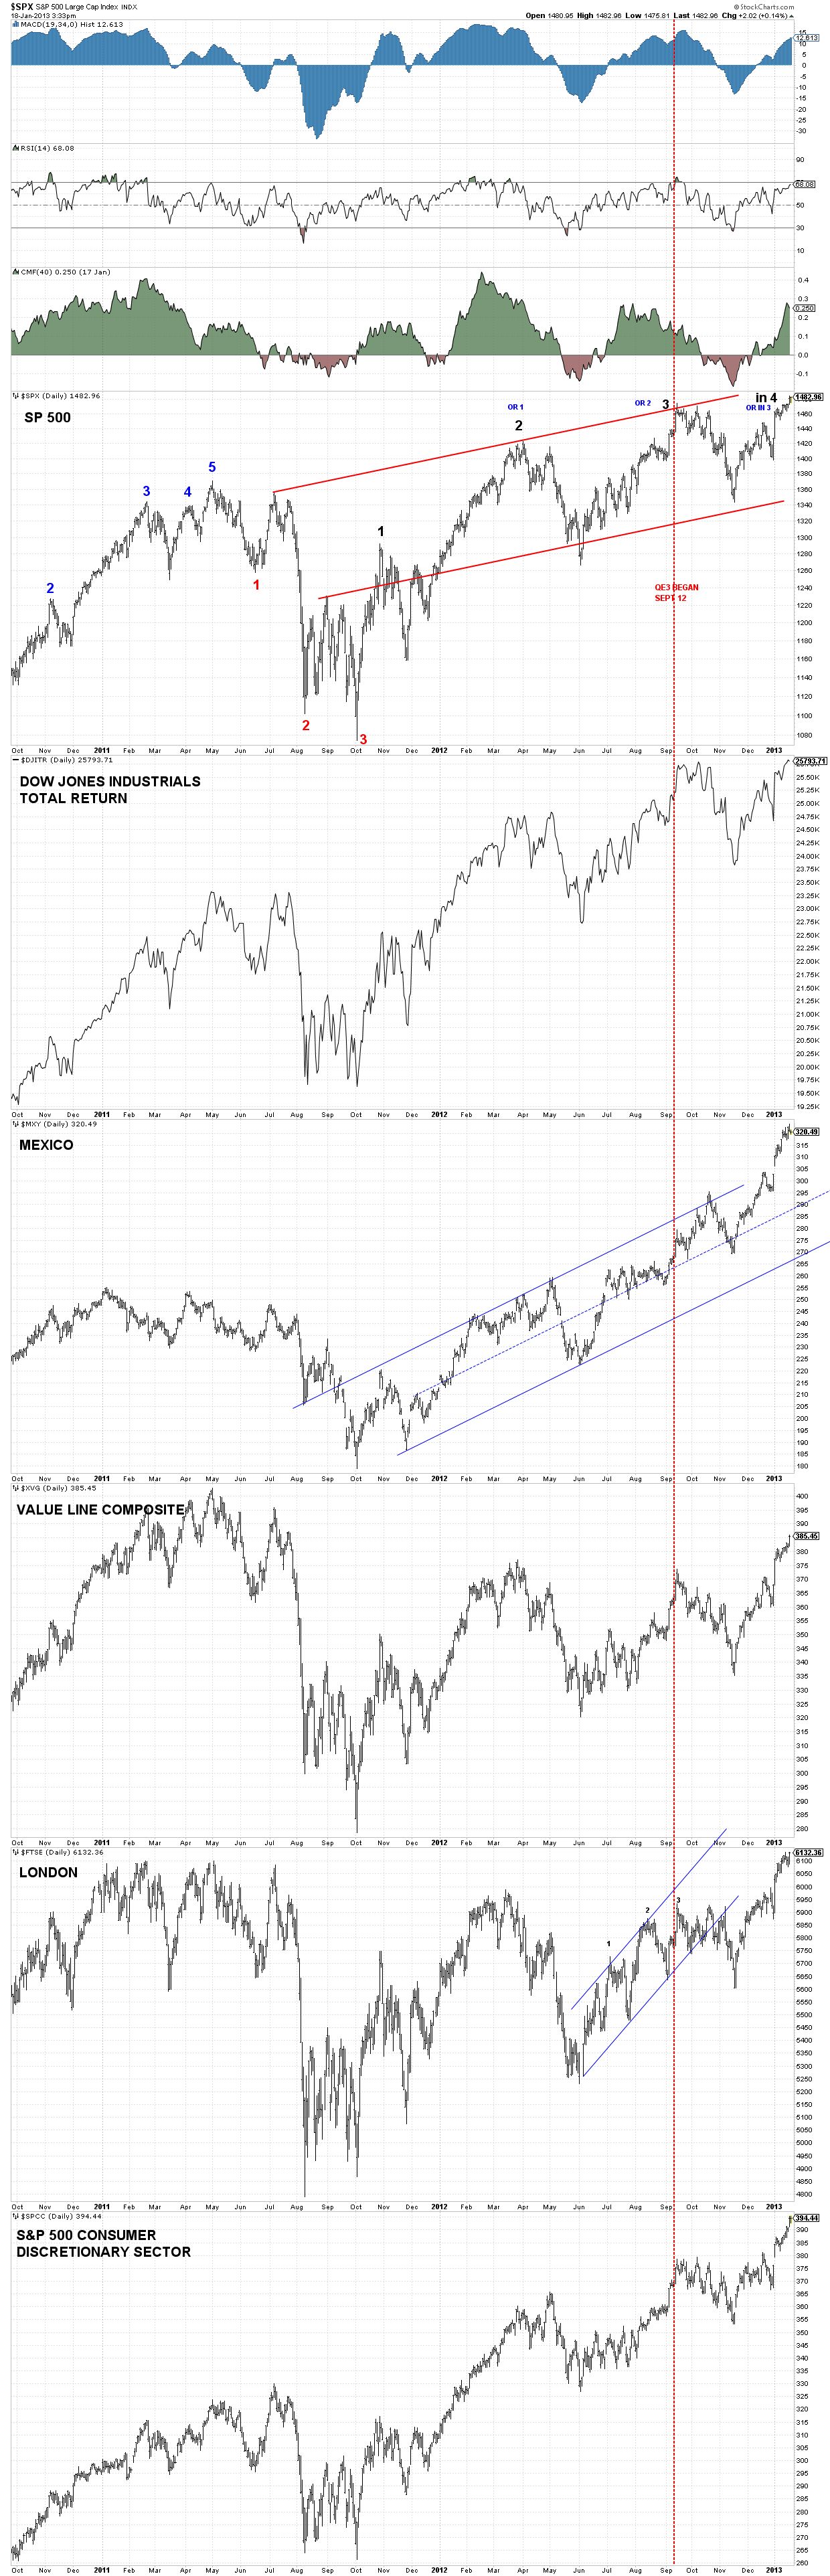
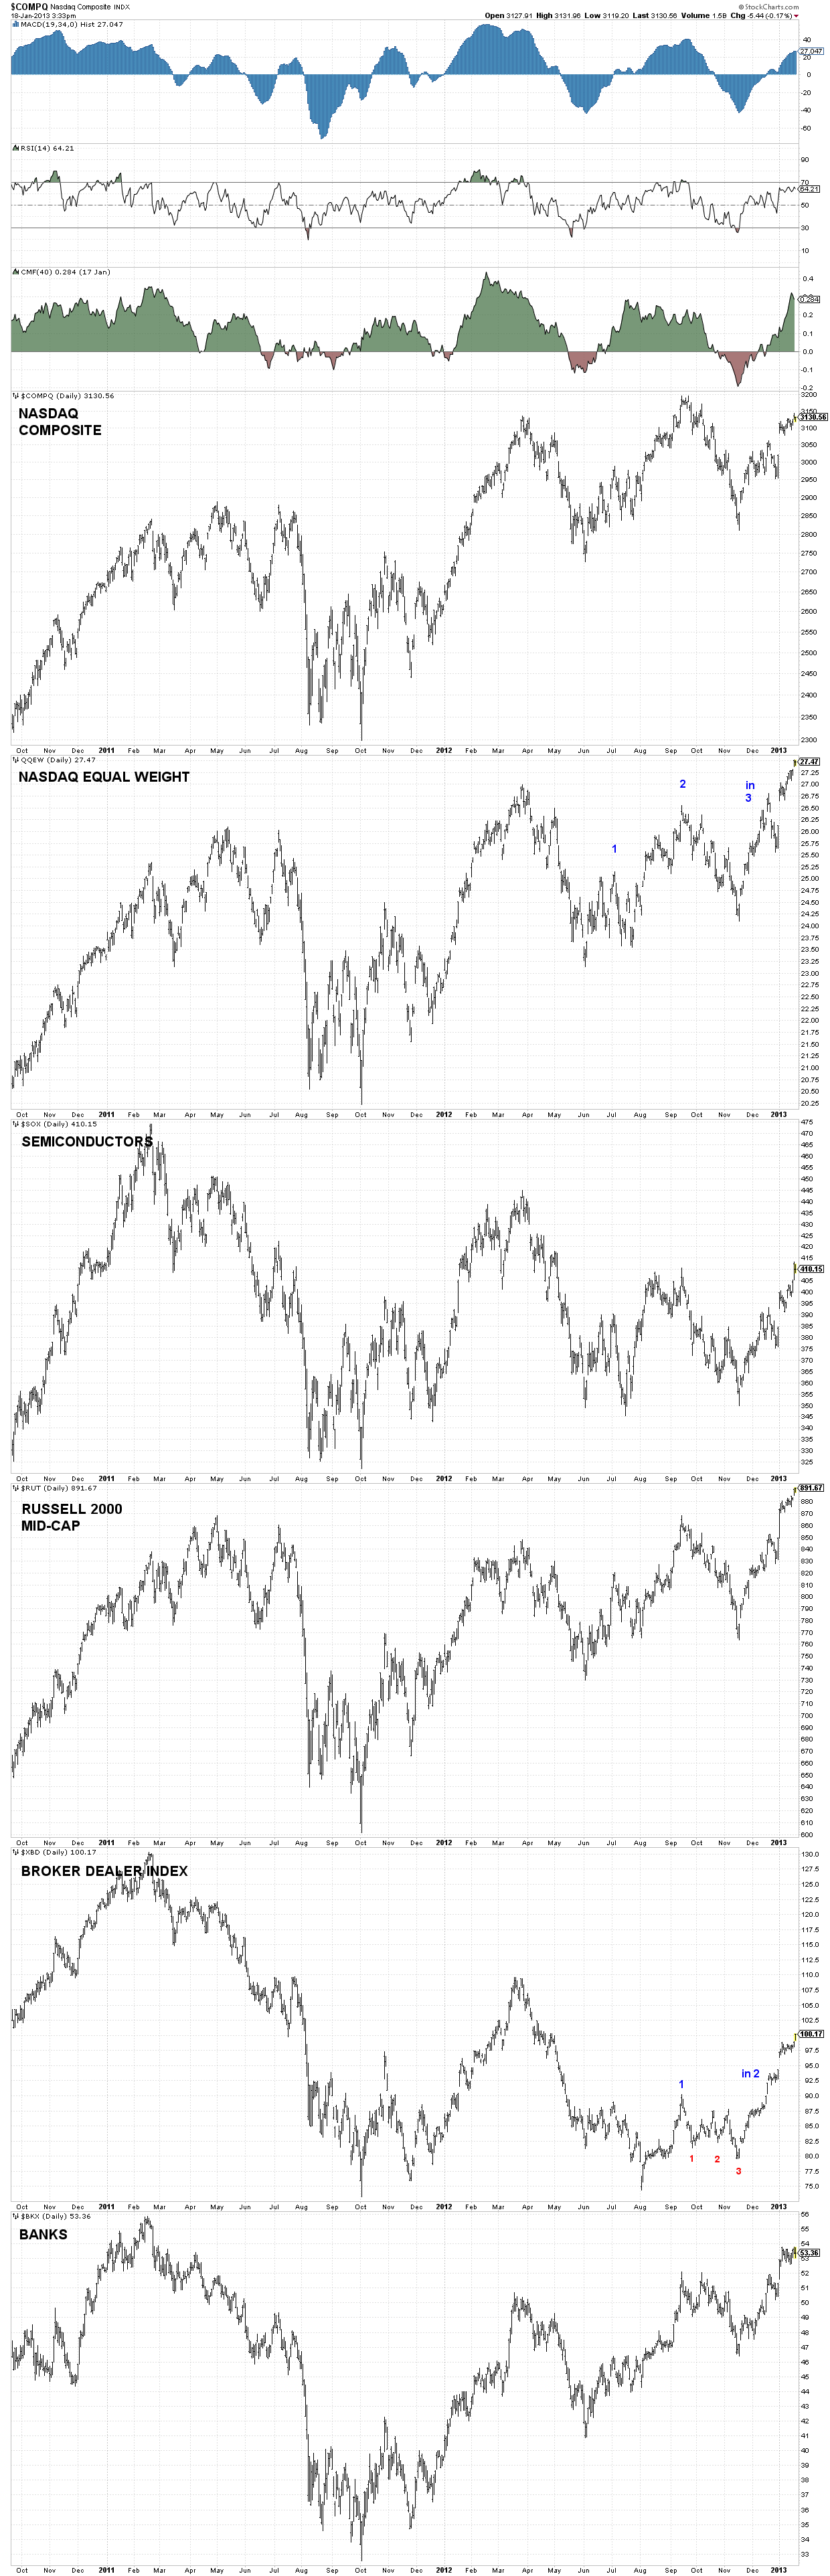
In the following 3 charts, look at all of the indexes that have made a new high above the 2011 high. In some cases, these are ALL TIME HIGHS.
Notice that the Value Line Index was a big leader until 2011. It’s been trying to catch up recently and we’ll see if it can make a new high. A high above the 2011 high in the Value Line would be an all time high. The last all time high was late April 2011. When this index is soaring, things are usually OK. The Value Line shows that we are in the 4th step up since October 2011. Breaking it down further, the 4th step has only completed one step up and is currently in step 2 up. There is another interpretation to this count, but it doesn’t make sense because the chart wouldn’t have good form to be correct, so I am disregarding it.
10.3 – Daily Indexes Domestic #1
10.4 – Daily Indexes Domestic #2
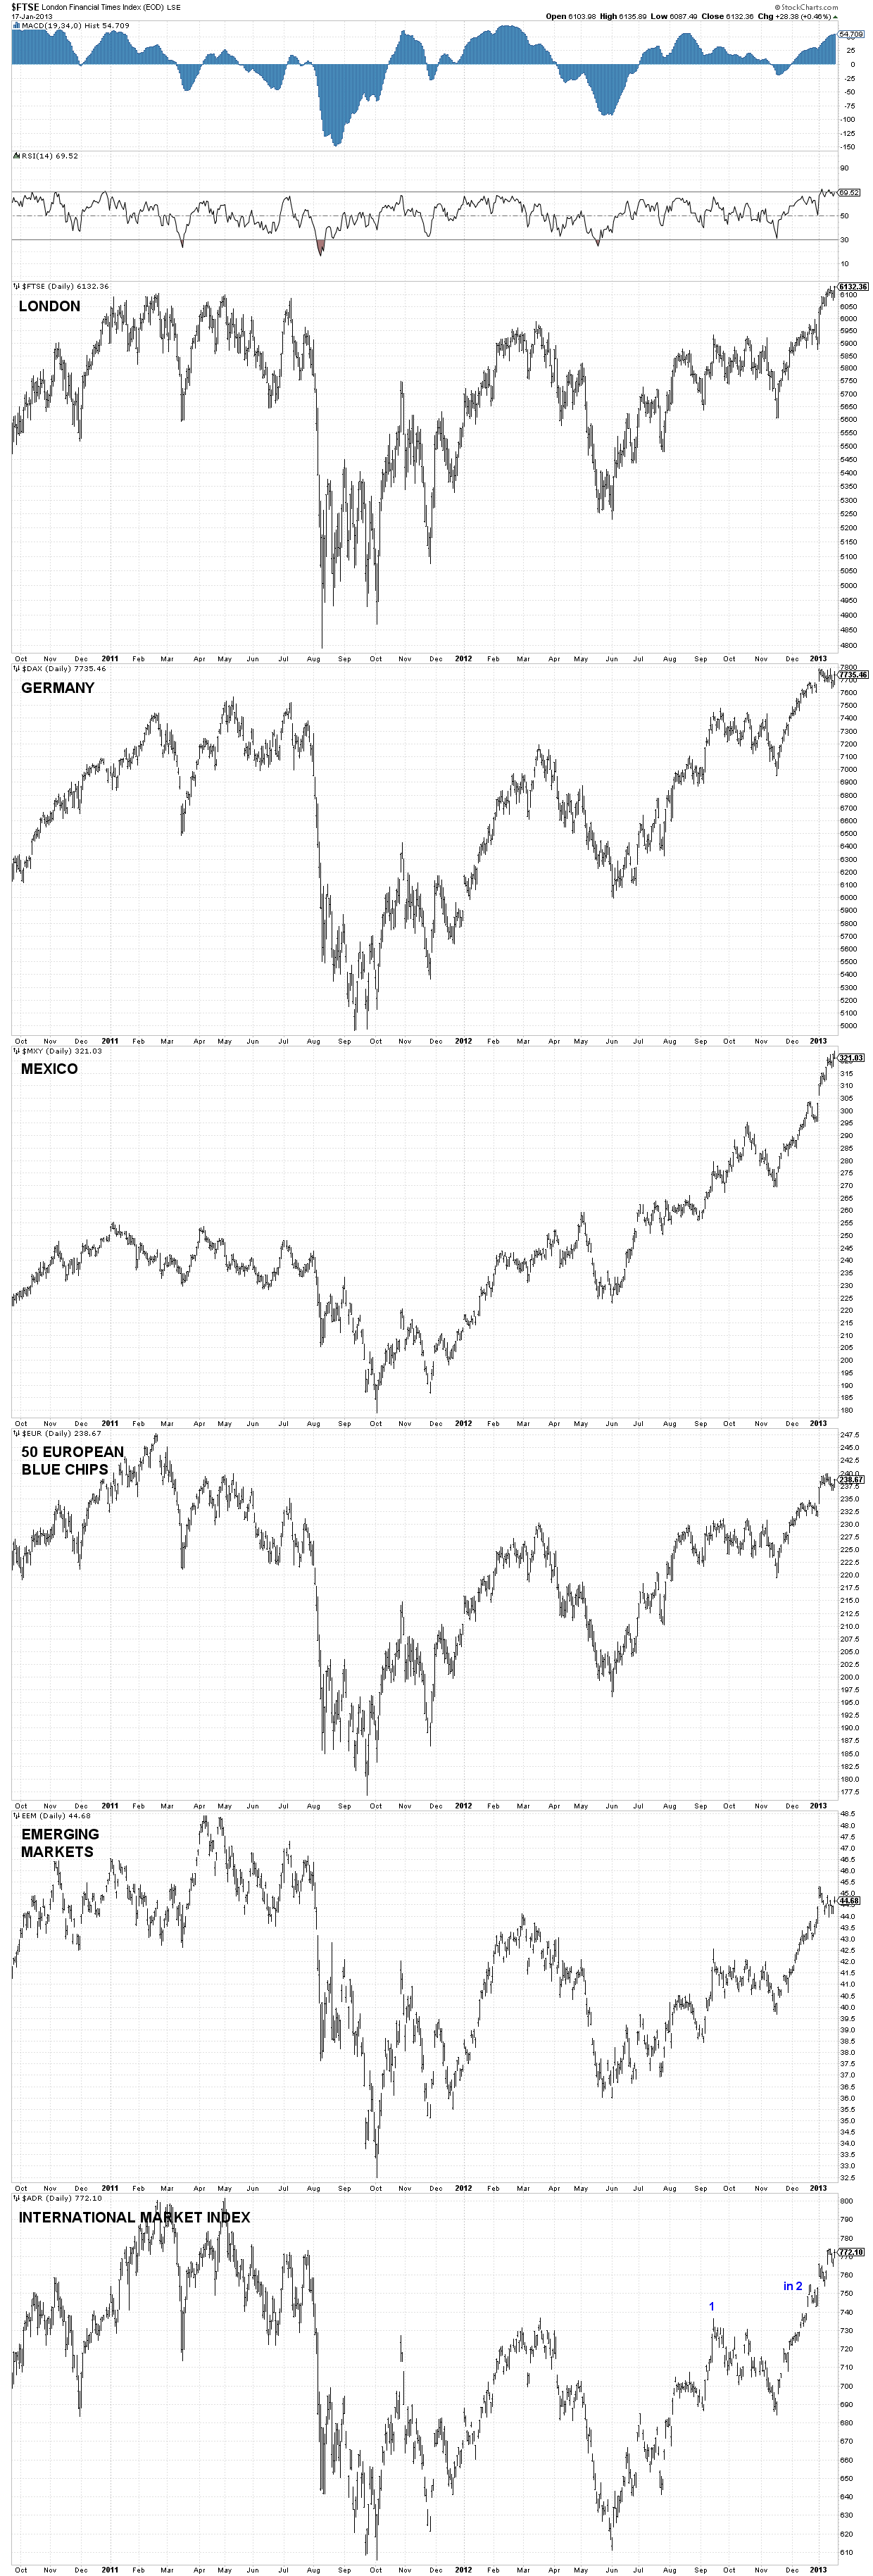
10.5 – Daily Indexes International
CYCLIC OUTLOOK
The following is from SentientTrader.com and they sell a very good cyclic software package. There interpretation of the cycles is bearish. As I’ve seen before, it doesn’t pay to be bullish or bearish too early. We’ll see if they modify their position later.
Hurst defined two cyclic tools: the FLD (Future Line of Demarcation) and the VTL (Valid Trend Line). The FLD is in my opinion the more reliable of the two when it comes to trading (which is why we created the FLD Trading Strategy), but the VTL can often provide some insightful information.
The VTL is a trendline which joins two peaks or troughs, and which is “validated” by obeying a few rules that Hurst defined. When price crosses a VTL (drawn between troughs) from above it confirms that a peak of a cycle has formed in price, and when price crosses a VTL (drawn between peaks) from below it confirms that a trough of a cycle has formed. The cycle of the peak or trough which is confirmed is the cycle one degree longer in the cyclic model than the cycle whose peaks or troughs are joined by the VTL.
What usually happens after price crosses the VTL is that it returns to the VTL (as is often observed with any trend-line). In the case of a downward crossing by price, this return to the VTL creates a second peak, and gives rise to the typical M-shaped cycle.
I’m explaining all of this because it is exactly what has been playing out in the markets since price crossed decisively below the 40-week VTL on 7 November 2012. Since then price has been drawn up to touch that VTL no less than 5 times, as can be seen in this chart of the S&P 500 (ES futures contract):
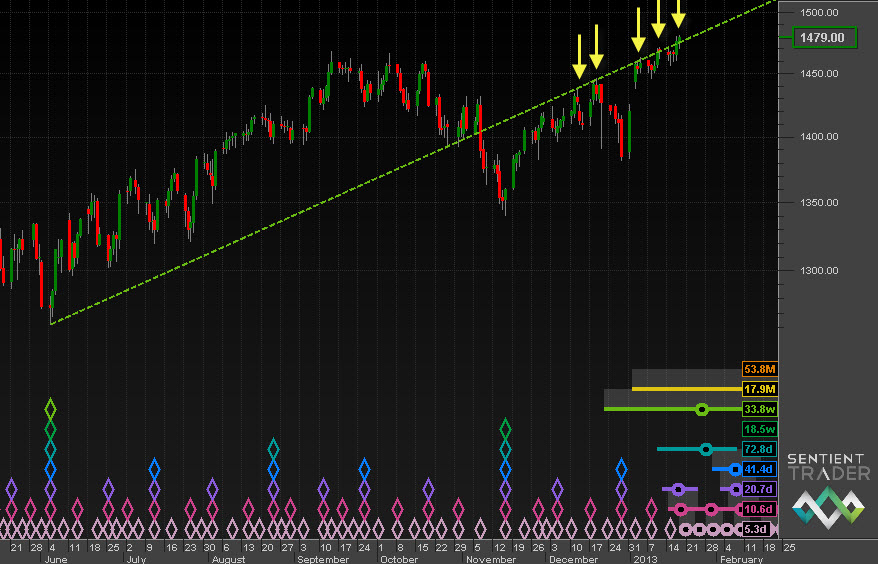
SP500-2013-01-19
(Note that the scaling is logarithmic – longer VTL’s work best on logarithmic charts) I have zoomed in on this chart to show the price reaching back up to the VTL, and so you cannot see the start of the VTL which is at the 18-month cycle trough on 4 October 2011. (emphasis is mine because that was a MAJOR bottom – Bob)
What does this mean? The cross below the VTL indicates that the September 2012 peak was the peak of the 18-month cycle. The action of price rising back to the VTL is most often the final bull move of the cycle, sometimes referred to as the “final kiss goodbye” before price falls into the trough, and I continue to expect (as discussed last week) that the market will peak soon and slide strongly to the downside. There is still the possibility of the alternate analysis which I have been tracking in the Nasdaq, particularly as the S&P 500 reached new highs this week, exceeding the September 2012 peak, but this market does not feel to me like a fresh young bull, but more like a bull on its last legs about to turn bearish. An example of the weariness of the bull can be seen in the Nasdaq which has spent the last two weeks struggling to get much above the high level of the first day of trading this year.
The US markets are closed on Monday – always a dangerous time in my opinion. While we take a break the cycles keep moving!
The S&P 500 reached new highs this week, and closed at the high for the week. The new high either indicates that the November 2012 trough was an early 18-month cycle trough (the alternate analysis presented in the Nasdaq) or it contradicts the VTL information discussed above. At the moment the new high is so slight that I tend to favor the latter reasoning, but if price continues much further upwards we will have to accept the alternate analysis. The bar counts on this chart show that (according to this analysis) we still have two or three months to go before price is expected to form the 18-month cycle trough. Despite the new highs this week, I remain convinced that that we will see a strong fall into that trough.
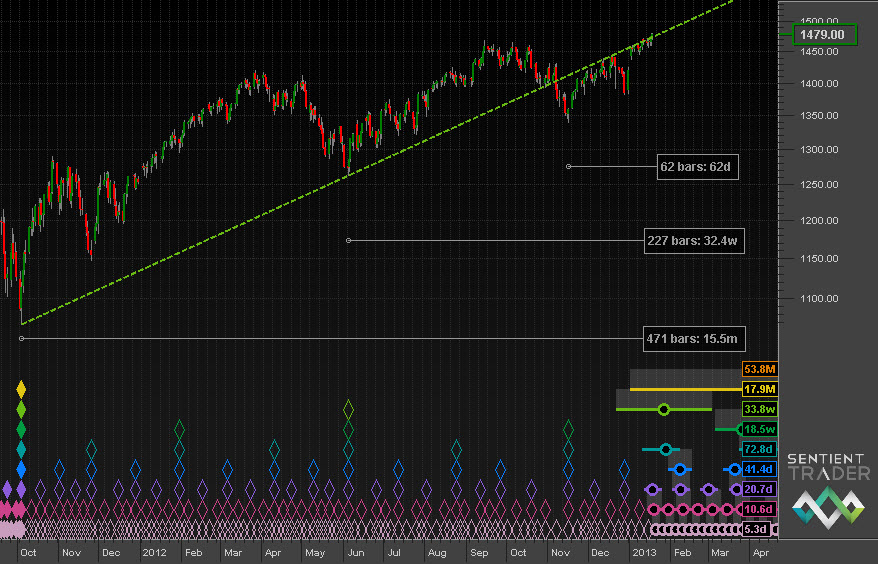
SP500-2-2013-01-19
All Rights Reserved © ™
Explore posts in the same categories: CYCLES, UPDATE
January 19, 2013 at 2:58 PM
Thanks, I’m looking for 1560 area before any correction to speak of.
LikeLike
January 19, 2013 at 2:20 PM
Thanks Bob and to clarify by signal I meant- 40.1 – Daily – ADX and Daily 5 Day EMA Buy/Sell System
LikeLike
January 19, 2013 at 1:59 PM
Hi Michael,
I haven’t been very diligent about issuing signals, so I would be very careful about depending on me. Also what if I croaked, you never know about such things. That said, I “hope” that I will see some type of top and write about it. I’m very leery about declaring an end to this bull market that I might be gun-shy on pulling the trigger. I think that any positive declaration coming from me might be late as I might wait for significant lower lows. That’s not a very productive strategy in some cases. We just have to wait and see what happens.
I harbor one weird thought that this bull market might “possibly” last a lot longer than anyone expects (including me). It could be interrupted by a decline “looking” similar to the 2011 correction, but it would be much longer and deeper. It could possibly last over a year and stop somewhere near the October 2011 low. That would seem like a bear market to most people but it could be looked at as a large correction in an ongoing bull market. It’s funny how I haven’t mentioned this thought in my blog. We’ll see if this has any chance of taking place, but I would be looking for an indication of it when we are near the October 2011 bottom.
The system of moving back and forth between something like JNK and TLT is a conservative method of capital appreciation and I’ve liked it since Terry introduced me to it. There isn’t any long term data on this method as junk bond funds haven’t existed long enough. One of the oldest junk bond funds is PRHYX and it was introduced in 1990. To me, 22 years isn’t very long for historical reference.
As far as a bond bear market beginning in 2000, I don’t see it, but that hasn’t changed the success of Terry’s best bond scenario. I think it seems likely that the best bond strategy can endure through the years.
Certainly at some point the bull market in bonds will end. The present bond bull market began in 1982 (simultaneously with the stock bull market) and the bond bull is about 31 years old. Edson Gould said that bonds moved in very long cycles and on October 1, 1975 Edson Gould said in his publication “Findings and Forecasts”,
“The present market affords, we believe, one of those rare, once-in-a-lifetime opportunities to buy bonds at bargain prices.
The last time it occurred was in 1920, 55 years ago.
The prior occasion was in 1869, more than 100 years ago.
Each was followed by a great bull market in bonds lasting for decades.”
The bear market in bonds didn’t end until 1982, but Gould was on the right track predicting a major bottom in the not too distant future.
As Gould pointed out there were only three bull market buy points from 1869 to 1982. This indicated that there were 2 complete cycles during those 3 buy points.. This tells us that the bond cycle lasts an average of 56.5 years. This 51-62 year cycle includes both the up and down part of the cycle. Presently we have an elapsed time in this cycle of 31 years with a possible end of the cycle coming in the next 20 to 31 years. Of the remaining cycle time, you must reserve a fair length of time for the correction. A decline lasting 20 years (rough estimate) would mean the end to the bull market in bonds could occur anytime over the next 11 years. Anytime over the next 11 years means the window is open right now, so we should be on guard for the future fundamental development that will cause this to happen. Anticipated fundamental results drive bonds unlike stocks, which are driven by fear and greed. There are many factors that could cause this fundamental shift, but an out of control dollar “could” top the list. The falling dollar is is part of the deficit problems this country continues to have.
I had forgotten some of these details as I don’t refer often to his publications. I keep them because they are an obvious treasure and a great reference.
This response turned out to be a lot longer than I anticipated, but I’m glad I did it.
Bob
LikeLike
January 19, 2013 at 10:32 AM
Hi Bob thanks for the update. I’m still waiting for your Daily buy/sell system to issue a sell signal-last signal was a buy Nov 15. Decided beginning 2013 to use the Daily system instead of the 60 minute to catch the bigger moves-only using the 15/60 system to refine enter/exit points. I have a question pertaining to bonds. In 2000 Terry thought we entered a Secular bear market in which he came up with the Best Bond Strategy moving between JNK/TLT. Interesting that in 2012 the Daily system caught these trends changes between these ETF’s to the day. My question do you anticipate this to continue going forward. Some say that this at some point will change and during a correction bond yields will rise instead of fall-like the 70’s. This would be due due to all the money printing and devaluing the currency’s around the world. Your thoughts?
Thank You
Michael
LikeLike