1/16/13 – Long Term Wave Count

MARKET MESSAGES
1/16/13
As we approached the 2007 peak I was faced with choosing between 2 different wave counts. Today I have the identical situation facing me. My decision in 2007 was to go with both wave counts and today I will do the same. I’ll do this because I’m managing risk and Benjamin Graham said:
“The essence of investment management is the management of risks, not the management of returns. Well-managed portfolios start with this precept.”
In the distant past it took a young gunslinger like myself a lot of years to learn this concept.
The following two charts are identical except for the wave counts and a couple of lines that I have drawn.
The 1st chart shows a conventional wave count for step 3 (yellow). The point that is contentious is the blue wave count in yellow step 3.
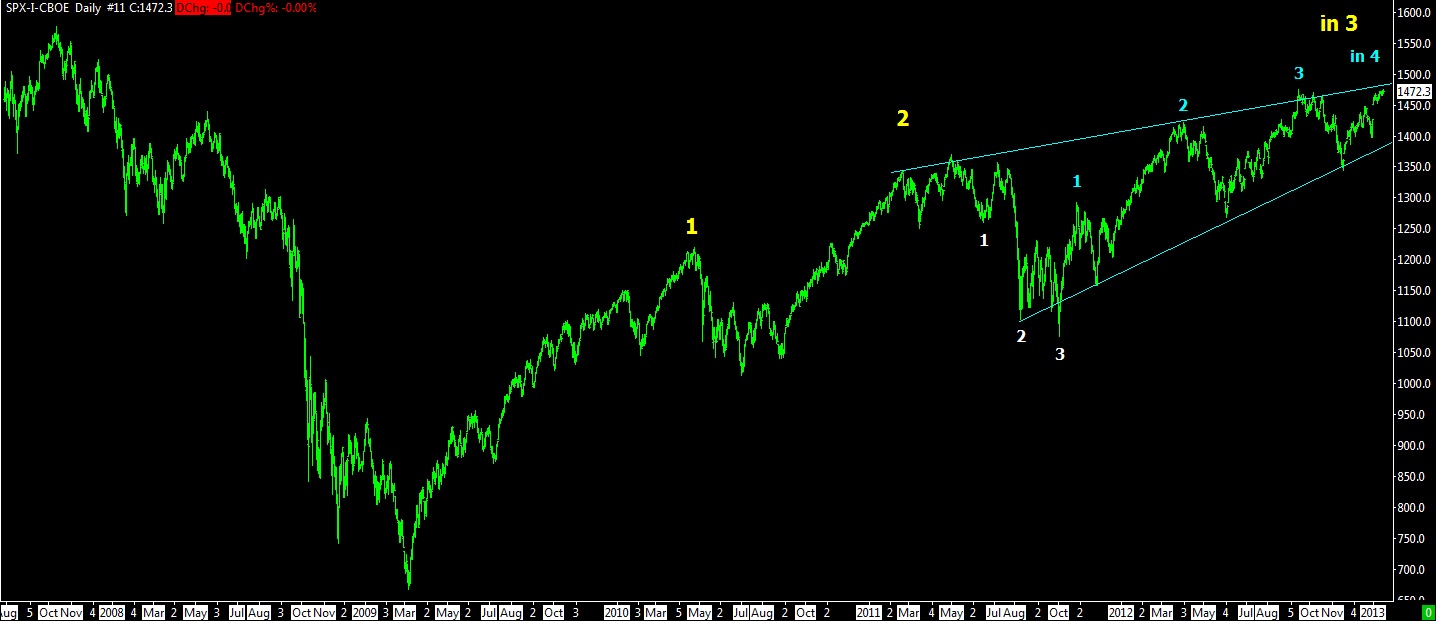
01-16-12 SPX DAILY BARS – 1
This next chart is a bit unconventional because of the wave count during the correction in the first half of 2011. Notice that I have labeled step 1 down (white), which is followed by a higher high. The end result is that this chart starts the 5 steps up (blue) at an earlier date than the first chart. The end result is that this chart shows us currently in step 5 (blue), while the first chart shows us in step 4 up (blue).
I was troubled by the wave count in 2011 and decided that the wave count in the second chart was correct. The surprise was the October 2011 plunge into the final step. Naturally the conventional wave count (first chart) accounts for this plunge because this plunge is step 3 down (white).
One factor in support of the following wave count is that you can draw a straight line from the peak 1 to peak 3 (blue). This is part of the channel concept, but it doesn’t necessarily make the unconventional wave count correct. It just makes it a better “what if”.
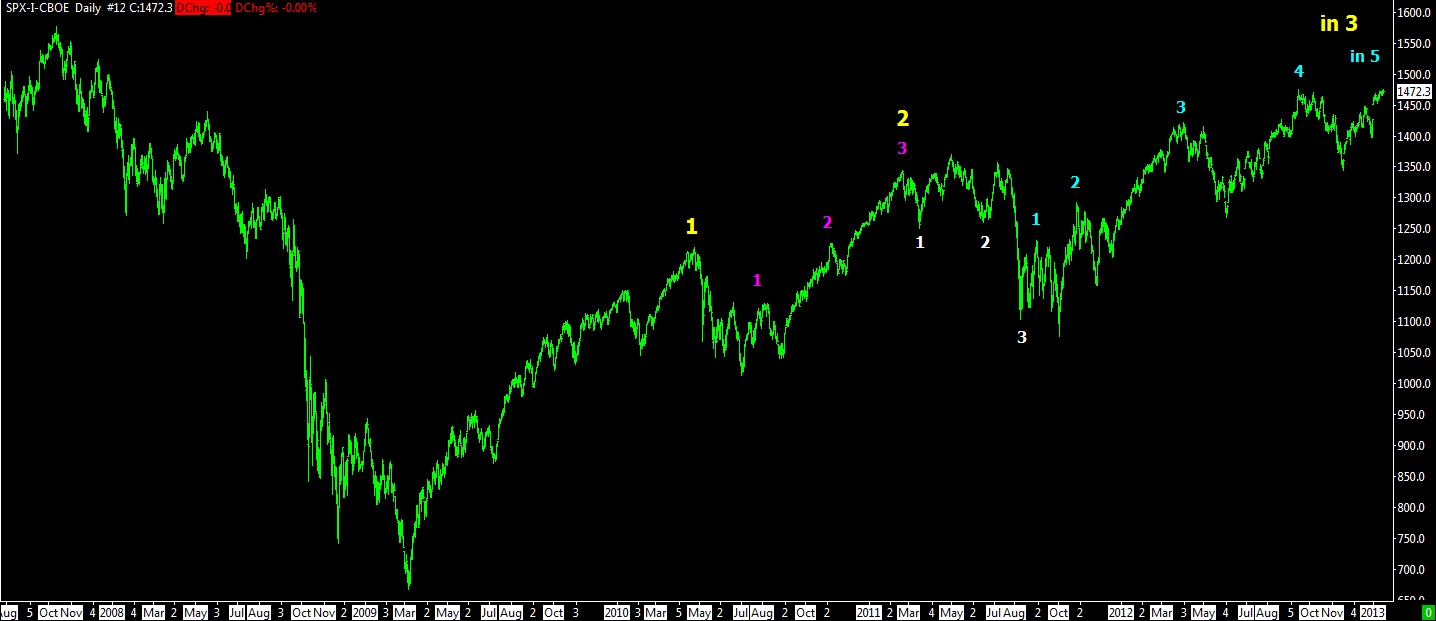
01-16-12 SPX DAILY BARS – 2
As we approached the 2007 peak I declared the end of the bull market was possibly over in early May 2006. This was wrong because this correction was followed by another rally to a new high. The conventional wave count was correct. Today one could ignore the unconventional wave count and wait for step 5 (blue). This may be correct but I thought I would warn you of the possibility of another outcome.
Just to confuse the situation unnecessarily more, there is an unlikely possibility that the bottom in October 2008 was the real bottom and step 1 up occurred from October 2008 to December 2008. This was the problem I was faced with in 2007. Where was the final bottom??? Back then it turned out that the second bottom (March 2003) was the bottom to start the count. It is very likely that the March 2009 bottom was THE bottom too. Did you notice the repeating dates there??? March 2003 and March 2009 for major bottoms. Maybe March 2015 is going to be a bottom of significance too???
- Click on any picture or chart to enlarge it
All Rights Reserved © ™
Explore posts in the same categories: UPDATE
Leave A Reply