StockCharts Messages – 12/11/12

- These messages are never edited from the original post. Warts and all are in plain view.
MARKET MESSAGES
12/11/12 – TUE
The first chart has the last downtrend line connecting 3 peaks. If there is another down sloping line I should draw, it isn’t apparent. The market is oversold and so far refuses to correct. That’s usually a good sign. But at some point that does run out.
Mike Burke said last Saturday that we were entering a two week period of traditional weakness. Later today the market began a correction (down 10 SP futures points since 11:30 EST). We’ll see if it turns into something more meaningful.
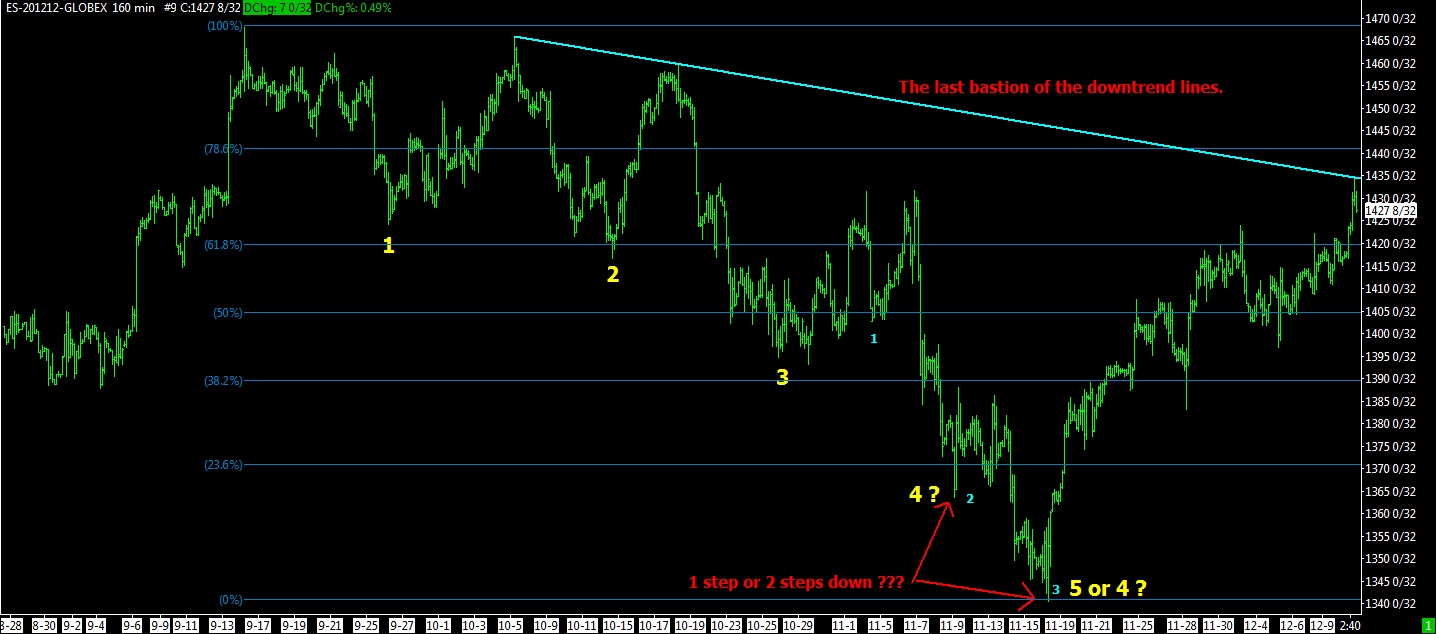
12-11-12 SP FUTURES 160 MIN BARS
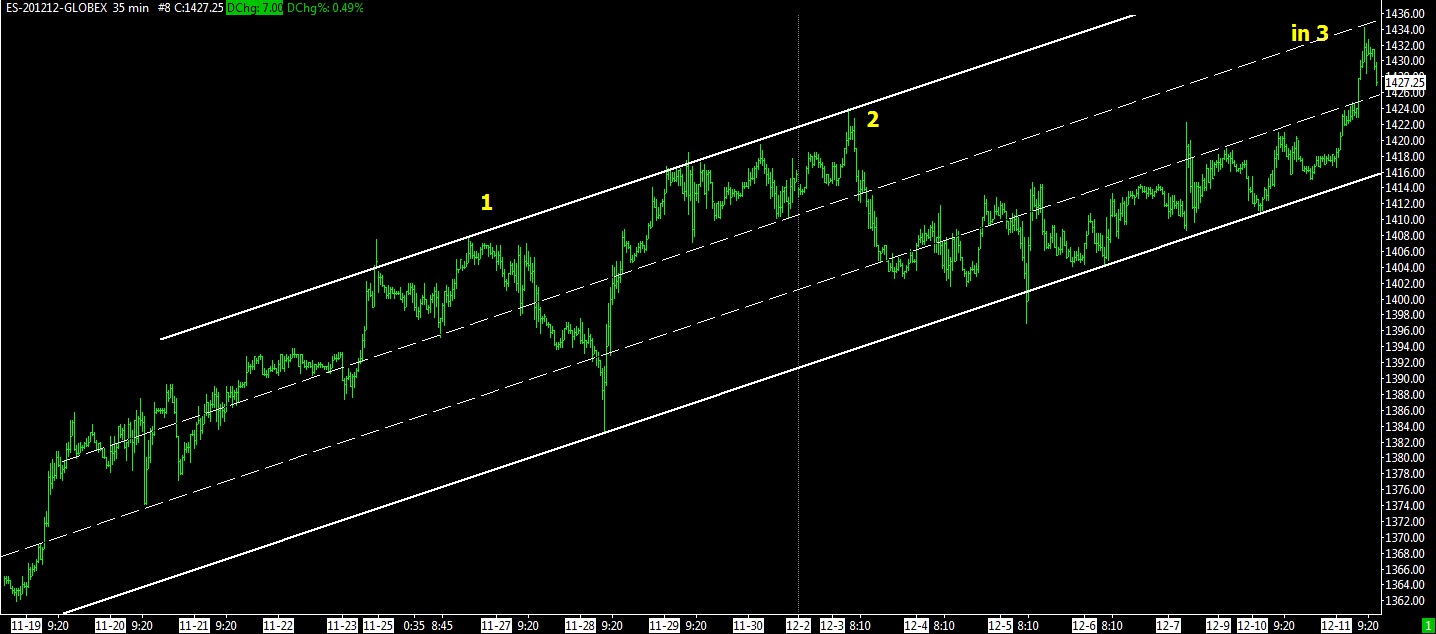
12-11-12 SP FUTURES 35 MIN BARS
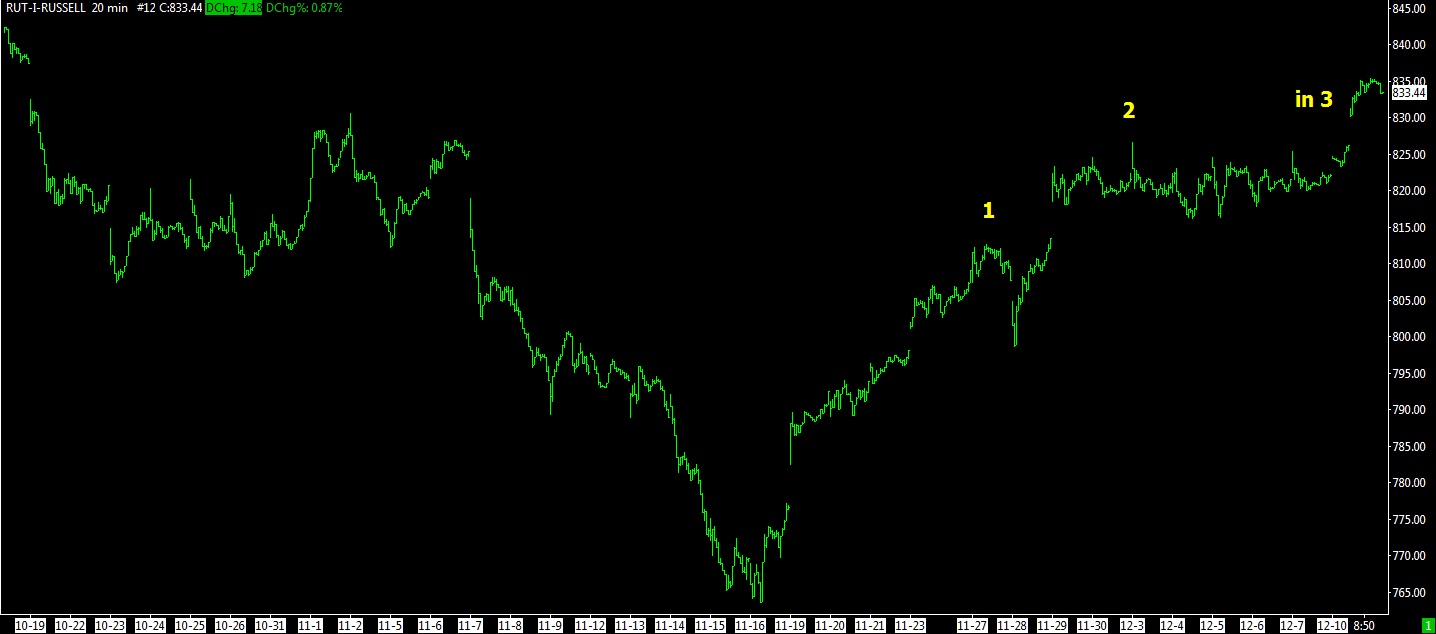
12-11-12 RUT 20 MIN BARS
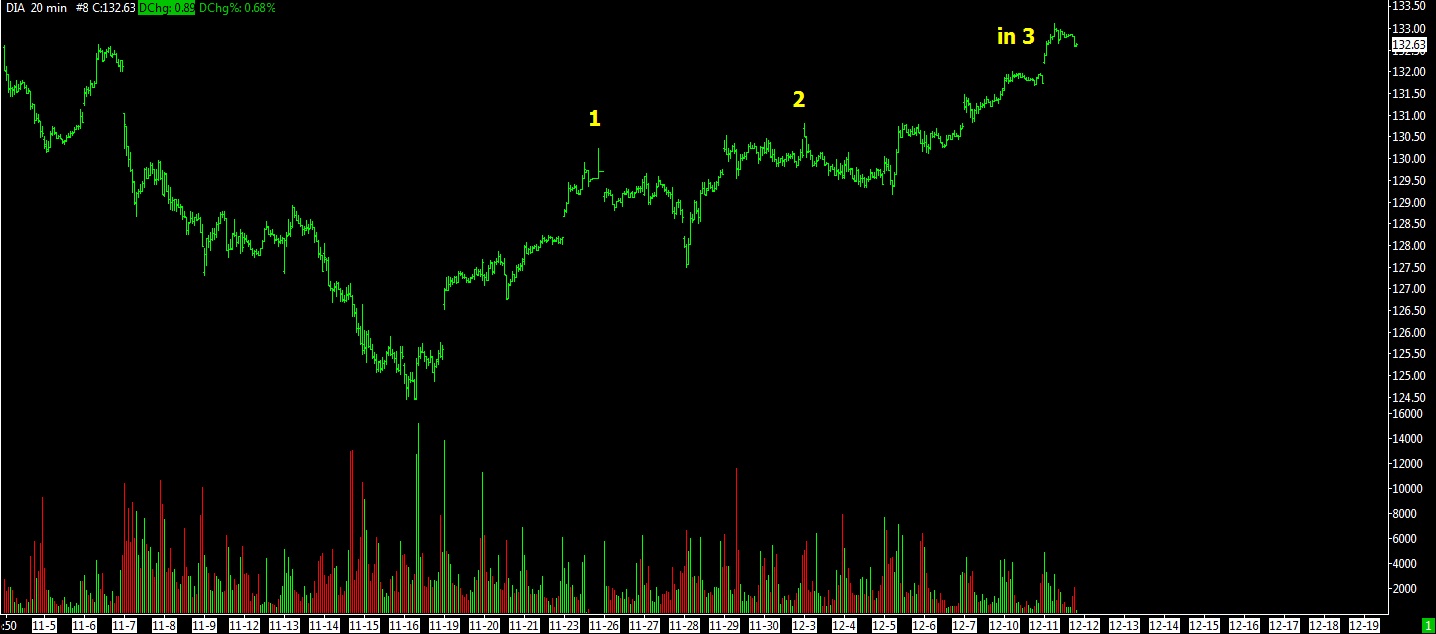
12-11-12 DIA 20 MIN BARS
And lastly is the SOX index (semiconductors). It’s count is off from the others.
It can lead the market up, but it’s not unusual for it to peak late. Following a good rally in the SOX, it seems to get over exuberant causing a late reversal. This index is often a confirmation in the early stages of a reversal that the rally is going somewhere. A flat to mildly up SOX with a good rally in the SP500 is not likely to be sustained. An early bottom in the SOX followed by a strong rally strongly indicates that the market will probably have a worthwhile rally.
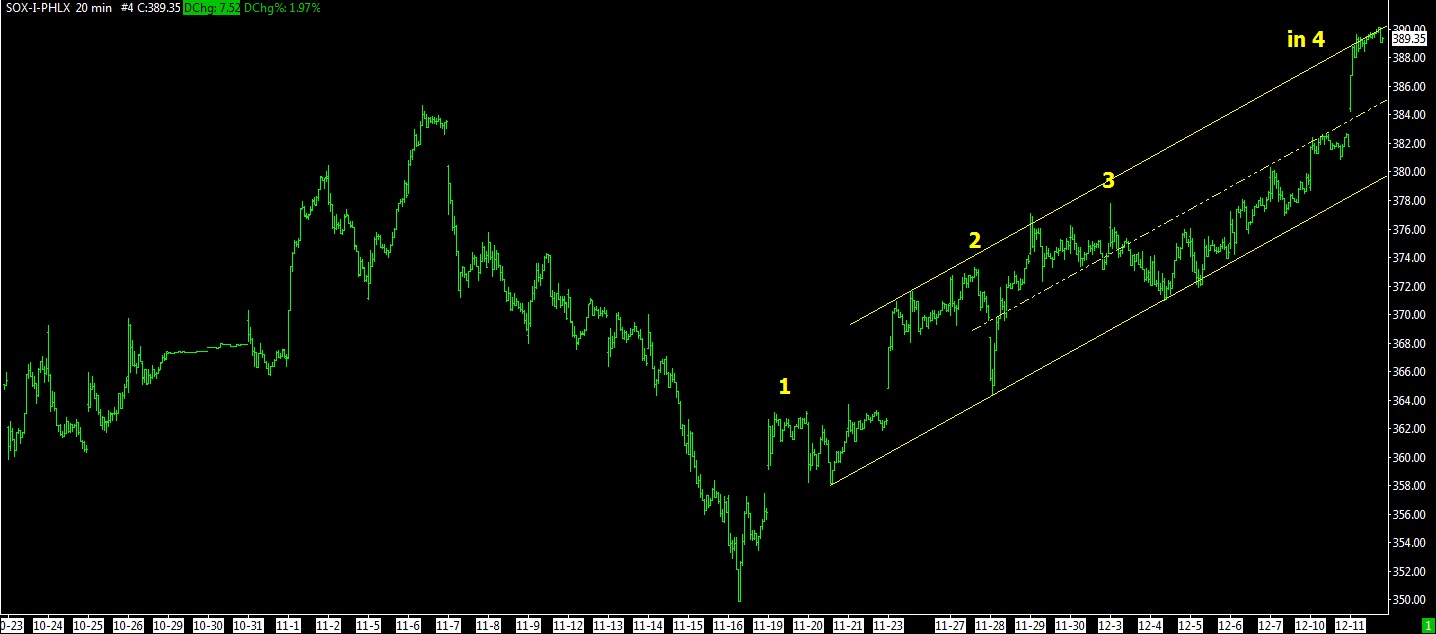
12-11-12 SOX 20 MIN BARS
The following is an updated chart of the 10 day EMA system based on 15 minute bars (10 day EMA is shown here instead of 5 day). Notice how this can usually keep you invested on the right side of the market.
Ideally, you need a brokerage transaction order algorithm to execute this properly during all hours of the day. Nobody can watch this stuff 24 hours per day (who would want to???) and execute it manually. You need to check with your broker to see if they have something like this available.
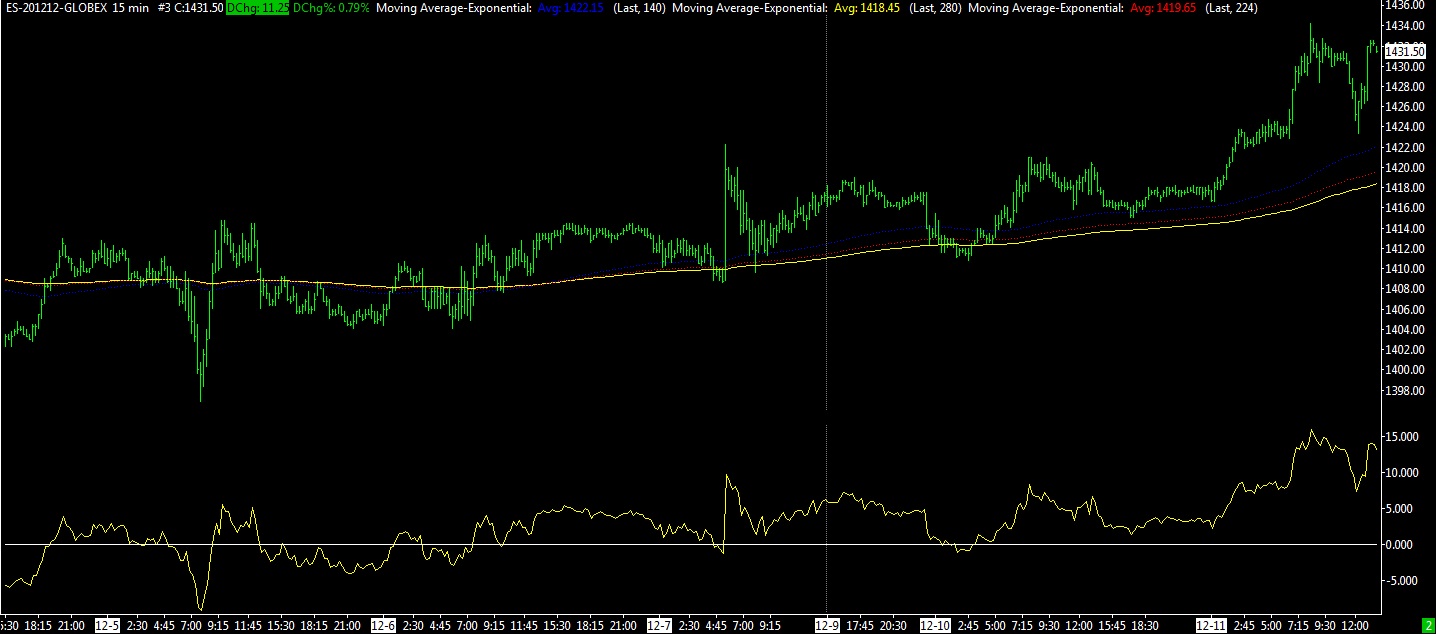
12/11/12 – 10 DAY EMA SYSTEM – SP FUTURES 15 MIN BAR
All Rights Reserved © ™
Explore posts in the same categories: UPDATE
Leave A Reply