StockCharts Messages – 12/12/12

- These messages are never edited from the original post. Warts and all are in plain view.
MARKET MESSAGES
12/12/12 – WED
The German DAX Index made a new recovery high today since 2009. The London FTSE is struggling to make a new high above 2011, but has failed to date. See chart #10.5 – Daily Indexes International.
The first chart is a 60 minute bar chart of the Dow Industrials with an envelope. Notice that the limits of the envelope have done a fair job of containing the extreme moves of the Industrials. Each time it hit the upper bounds of the envelope (solid red line), it usually backed off, sometimes quickly and other times price may have crawled up the extremes of the envelope. Currently we are touching the upper edges of the envelope. The second chart is the same only with a shorter time span. This indicator is likely telling us that (for the moment) the most significant gains are behind us.
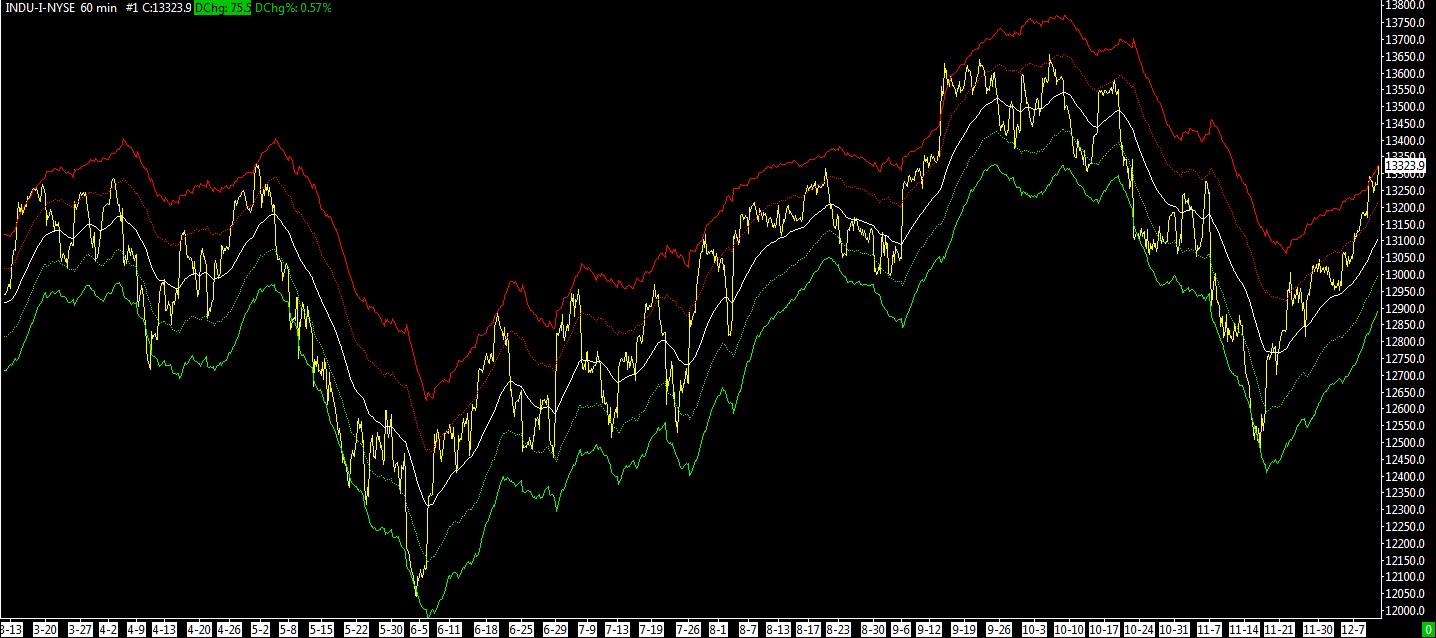
12-12-12 IND 60 MIN WITH ENVELOPE
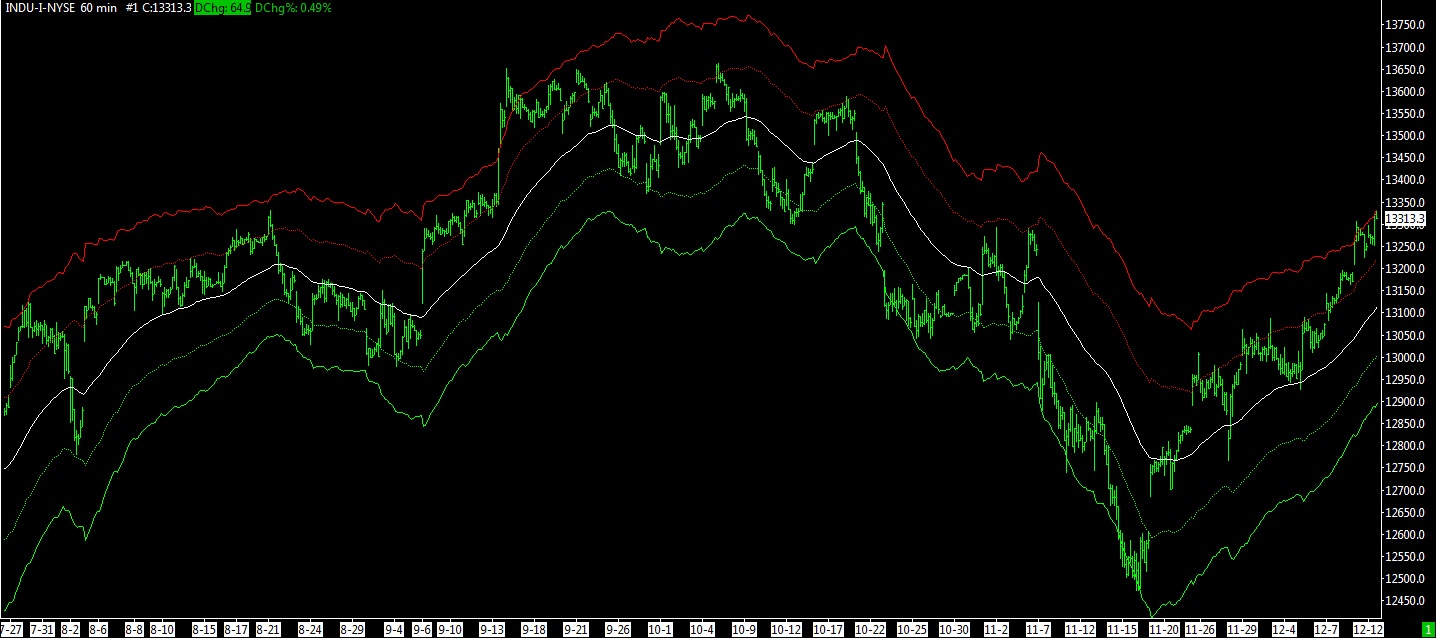
12-12-12 INDUSTRIALS 60 MIN BAR WITH ENVELOPES – 2
Below is the 5 Day EMA System and it shows where today price almost touched the 5 Day EMA line and rebounded. As long as price remains above the 5 Day EMA line, the market is a buy but buying when it is at the line is a transaction opportunity. If the line has moved down and penetrated the line, you would have sold your holding immediately and gone short (or standby if you don’t short). The rules to this system follow this chart.
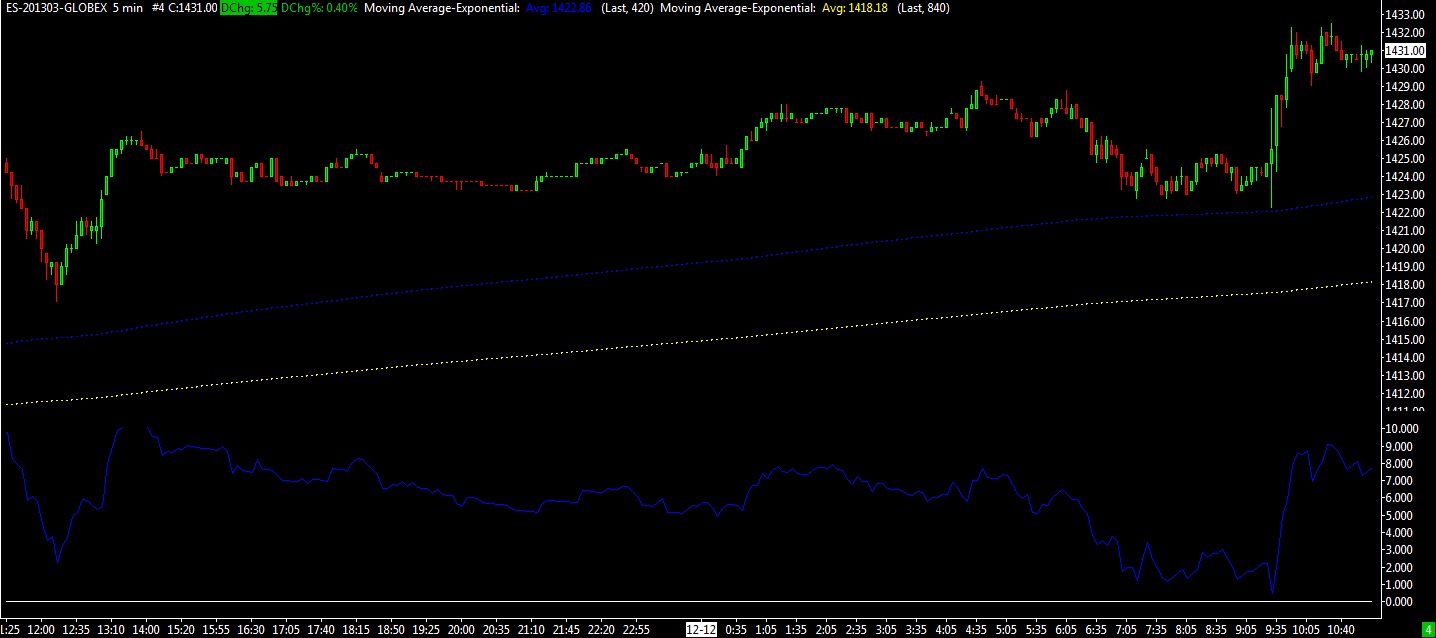
12-12-12 SP FUTURES 5 MIN BARS WITH 5 DAY EMA SYSTEM
Quote from Robert Colby’s book, The Encyclopedia Of Technical Market Indicators, Second Edition, regarding the 5 Day EMA Crossover Strategy.
‘This is the best simple trend-following indicator we tested against daily DJIA data. Substituting 5-days for 120-days in the same formula (above), and starting with $100 and reinvesting profits, total net profits for this 5-day EMA Crossover Strategy would have been $16 billion, assuming a fully invested strategy, reinvestment of profits, no transactions costs and no taxes. This would have been 78 million percent better than buy-and-hold. Short selling would have been profitable.”
I have modified the 5 day into a 35 hour EMA. This was done due to volatility issues (gaps) in today’s markets. Trading the SP futures (nearly 24 hours/day) can minimize gaps but not completely. To avoid sleepless nights, there are trading algorithms available with certain online brokerages that can execute this trade automatically otherwise, it’s probably not practical without some modifications.
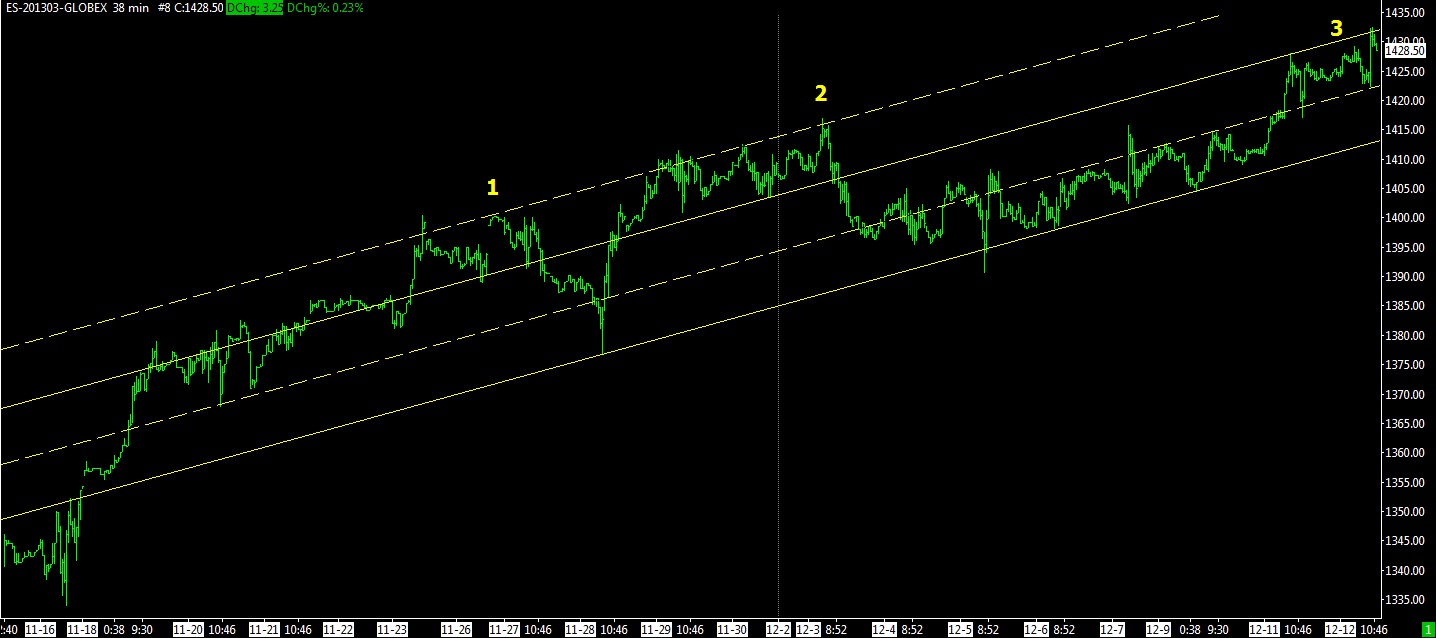
12-12-12 SP FUTURES 38 MIN BARS WITH TRENDLINES
In the next chart notice how the last downward trendline was briefly penetrated today to the upside. We’ll have to wait and see if that’s significant but today’s rally stopped almost exactly on the 78.6% retracement line.
If the market is still in an overall decline, it’s not normal for a rally to retrace this much of the prior decline. An exception to this would be where large step one declines and then retrace the entire decline, making a double top. That would be the exception but it’s too early to say if that’s happening here.
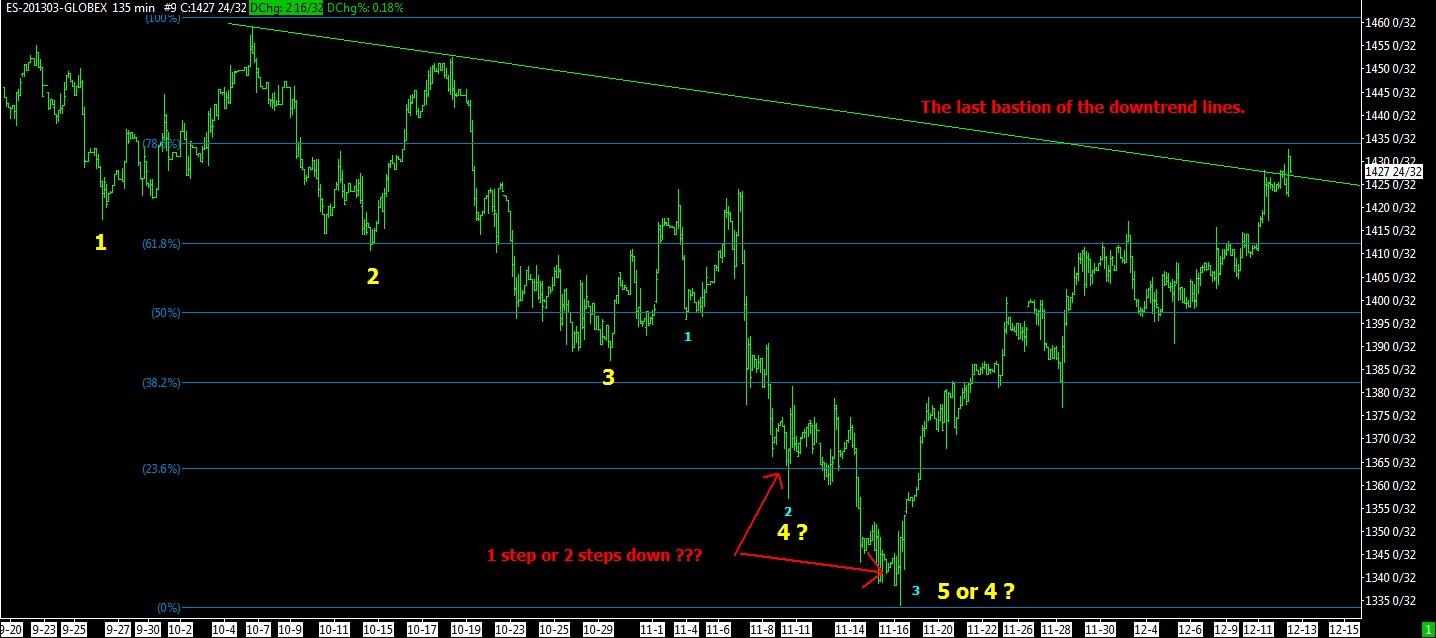
12-12-12 SP FUTURES 135 MIN BARS WITH TRENDLINE & FIBONACCI RETRACEMENT
Since the overall wave count indicated a 3 count of a 3 count since March 2009. There is always the possibility that the bull market is over. The alternative is that we will trace out a 4th and 5th step of the larger step 3 up. That would have the possibility of making the bull market last into 2013. This is where I had previously thought the bear market would begin. But until it’s proven, it’s just a thought.
Below is the long term wave count since 2009, which clearly shows we are in the 3rd step up. The following chart shows the wave count since September 2010.
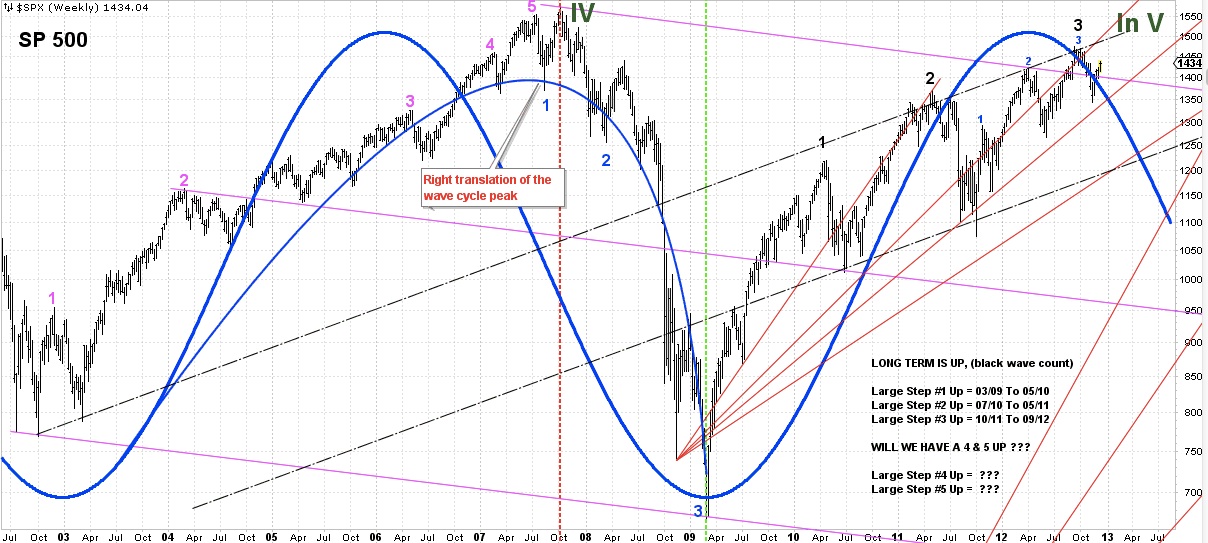
12-12-12 SPX WEEKLY BARS WITH WAVE COUNT & CYCLE
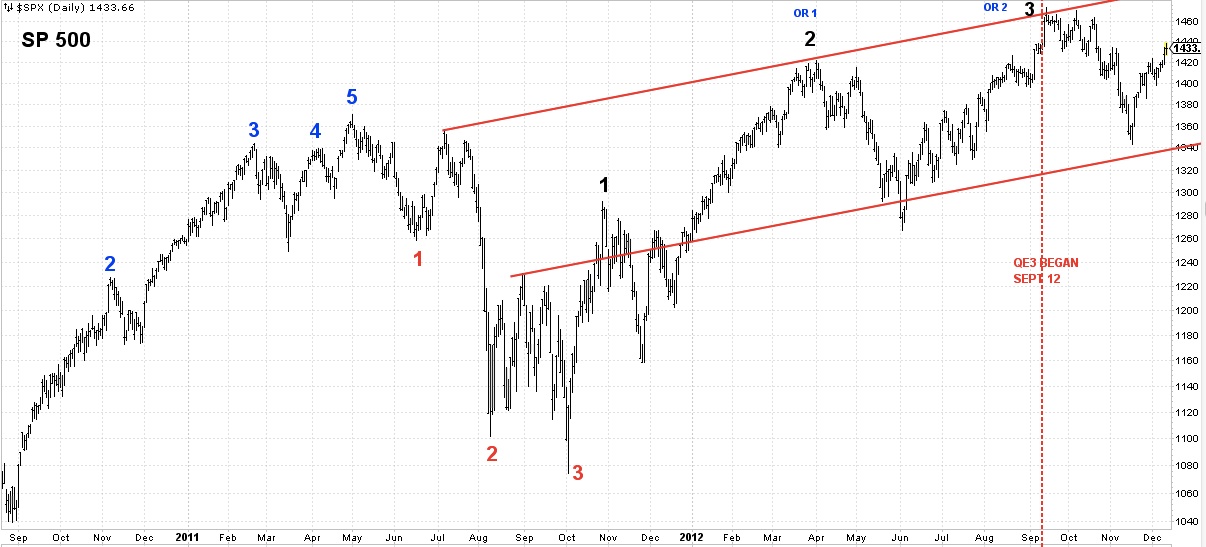
12-12-12 SPX DAILY BARS WITH WAVE COUNT
All Rights Reserved © ™
Explore posts in the same categories: UPDATE
December 12, 2012 at 12:07 PM
Thanks Bob.
LikeLike